On 3 June 2020, Workhorse Group opened at $2.73, its prior close, and finished at $2.95, up 8.1% on volume 1.9 times its 20-day average. The stock was still 13.9% under its May high, the company had booked almost no revenue, and the electric-vehicle trade was only starting to run. That WKHS base breakout setup ran vertical: from the June 2020 entry, the stock was 595% higher at the October exit, 139 calendar days later.
When WKHS shows up on traders’ screens again, this is the chart worth studying. It shows how a theme stock with thin fundamentals can still set up properly, and how a move that went vertical in four weeks then spent four months deciding whether it was done.
WKHS base breakout: key takeaways
- Pattern: a 66.6% crash-and-recovery base from the 21 February high of $3.94, finished by a four-week pullback under the $3.43 May high.
- The move: +594.7% from the entry close of $2.95 to the exit close of $20.50, across 139 calendar days, with a peak of $30.99 along the way.
- One add-on point, on 25 August at $18.20, as the stock left a seven-week range.
- The fundamentals didn’t carry it: March-quarter revenue was 84,300 dollars, down 76.9% year over year.
- The trend lesson: the stock never closed below its 50-day line between the entry and the exit day itself.
| Ticker | WKHS |
| Study entry date (anticipatory) | 2020-06-03 |
| Entry close | $2.95 |
| Pivot (prior 20-day high) | $3.43 |
| Pivot cleared | 2020-06-09, close $3.74 |
| Volume vs 20-day average | 1.9x |
| Exit date | 2020-10-20 |
| Exit close | $20.50 |
| Price change, entry close to exit close | +594.7% |
| Calendar days | 139 |
| Peak before exit | $30.99 (2020-09-21) |
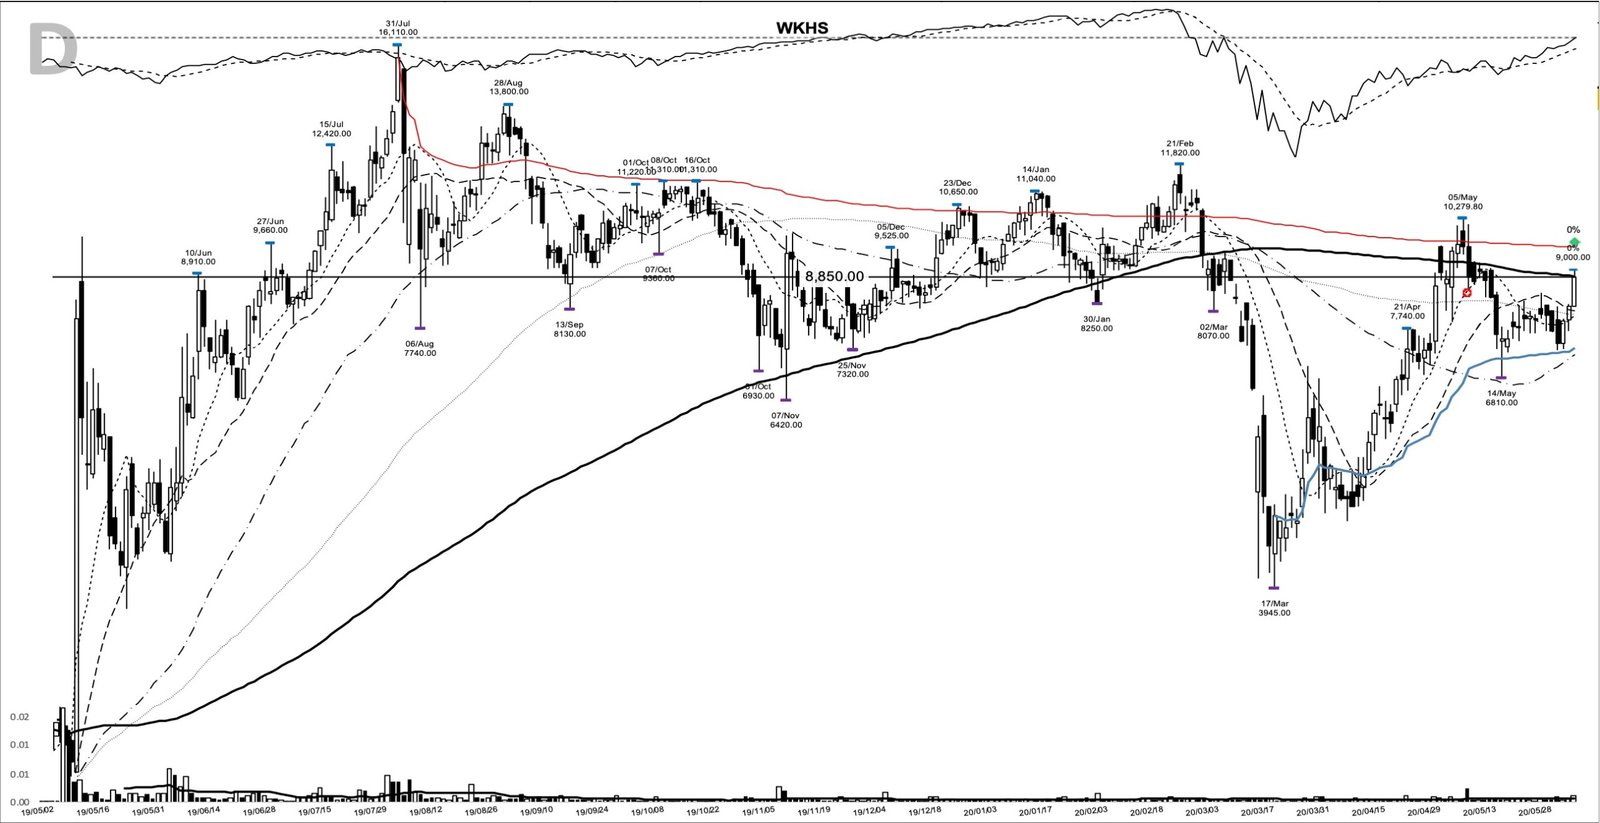
The spring 2020 base and the $3.43 pivot
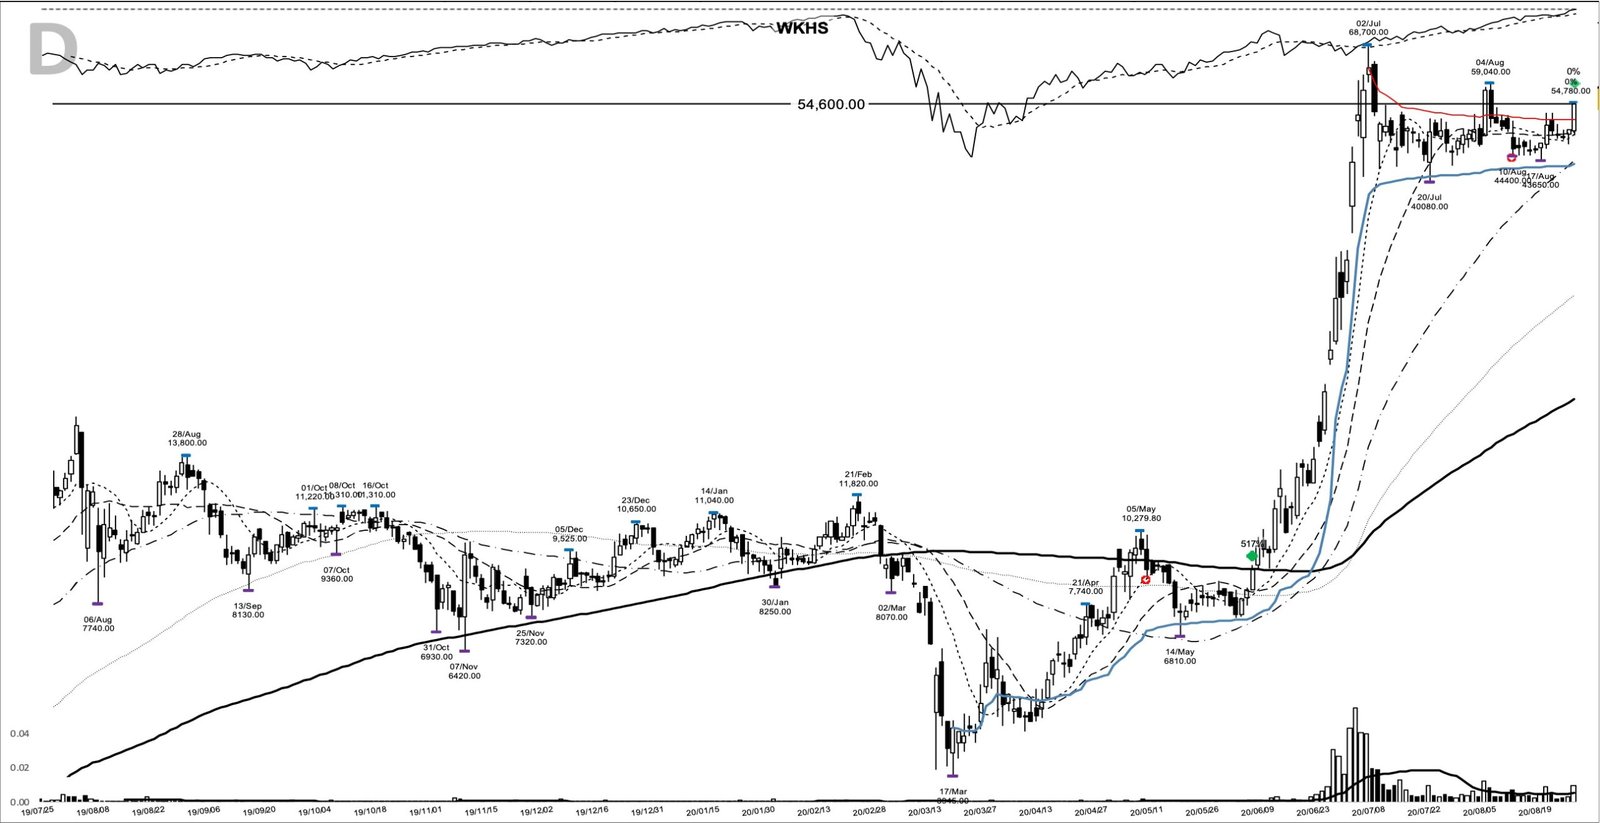
The chart, from my study archive, shows a stock that spent a year going nowhere. WKHS printed $5.37 on 31 July 2019, then chopped through the second half of the year, down to $2.14 on 7 November. The 21 February high of $3.94 was the last push before the crash, and on 17 March the stock hit $1.32. That’s a 66.6% drawdown from the February high, deep even by wide and loose base standards.
The recovery was fast. From $1.32 the stock ran 160.6% to $3.43 on 5 May, about 80% of the way back to the February high. Then came the part that made the setup. WKHS pulled back to $2.27 on 14 May, a 33.8% retreat, and spent the next three weeks below $2.83, with the last dip holding at $2.44 on 29 May. Every low in that stretch held above the rising 50-day line.
The 3 June entry was anticipatory. The close of $2.95 sat $0.48 below the $3.43 pivot, and it landed almost exactly on the 200-day line, which stood at $2.96 that day. Two sessions later, on 5 June, price traded up to $3.46 intraday but closed back at $3.19. The pivot was cleared on 9 June, when WKHS closed at $3.74 on volume 3.8 times its 20-day average, six calendar days after the entry.
Workhorse in May 2020: a paper profit and almost no sales
Workhorse built electric delivery vans and had bid for the U.S. Postal Service’s next-generation delivery vehicle program. On the model-book fundamental frame it fell well short. SEC filings show March 2020 quarter revenue of 84,300 dollars against 364,182 a year earlier, a 76.9% decline. Earnings per share swung to 0.06 from a loss of 0.11, but the company’s first-quarter release attributed the swing to non-cash fair-value changes on lender warrants and a convertible note as the share price fell, and said delayed deliveries had pushed meaningful revenue into the second quarter.
The story investors argued about was optionality. Workhorse held roughly a 10% stake in Lordstown Motors, received for its W-15 pickup technology, plus a royalty on Lordstown’s Endurance truck. Then there was the postal contract, a binary decision that hung over the stock the whole way. On 9 June, the day the pivot cleared, a Motley Fool piece noted the stock was rising with no company news at all, carried by enthusiasm spilling over from Tesla and Nikola.
A record Nasdaq and an electric-vehicle stampede
The backdrop was a power trend. The market had recovered from the March crash, and the Nasdaq Composite closed above 10,000 for the first time on 10 June, the day after WKHS cleared its pivot. Large-cap technology led, but speculative growth themes ran even harder. Electric vehicles were the loudest of them, with surging Tesla and Nikola shares pulling attention toward any company that built a battery-powered truck.
That tape rewarded aggression in leaders and forgave a lot. It also meant WKHS was a theme stock first and a business second, which matters for how the trend ended.
How a trader could have prepared before 9 June 2020
The watchlist case was visible by late May. The stock had recovered most of its crash in seven weeks, then pulled back without breaking the rising 50-day line, which sat at $2.41 on the entry day. Price had closed above its 10-day line for three straight sessions into 3 June, and the entry close was 10.7% above that line at $2.67. A screen for stocks within striking distance of a recent high, in the hottest theme of the month, would have flagged it.
The plan a trend follower could have written that week was simple. Entry on a close above the $3.43 pivot. Initial stop below the $2.44 shelf low from 29 May, a 28.8% risk measured from the pivot, which is wide and argues for a smaller position. Below that, the $1.32 March low is where the whole structure fails. Once in, trail the 10-day line and widen to the 20-day after the stock is well advanced.
The study entry anticipated that pivot. Bought at $2.95 against the same $2.44 shelf, the risk was 17.3% instead of 28.8%, the reward for acting before confirmation. The cost was carrying a position that, until 9 June, hadn’t proven anything.
From $2.95 to a $30.99 peak: how the WKHS run unfolded
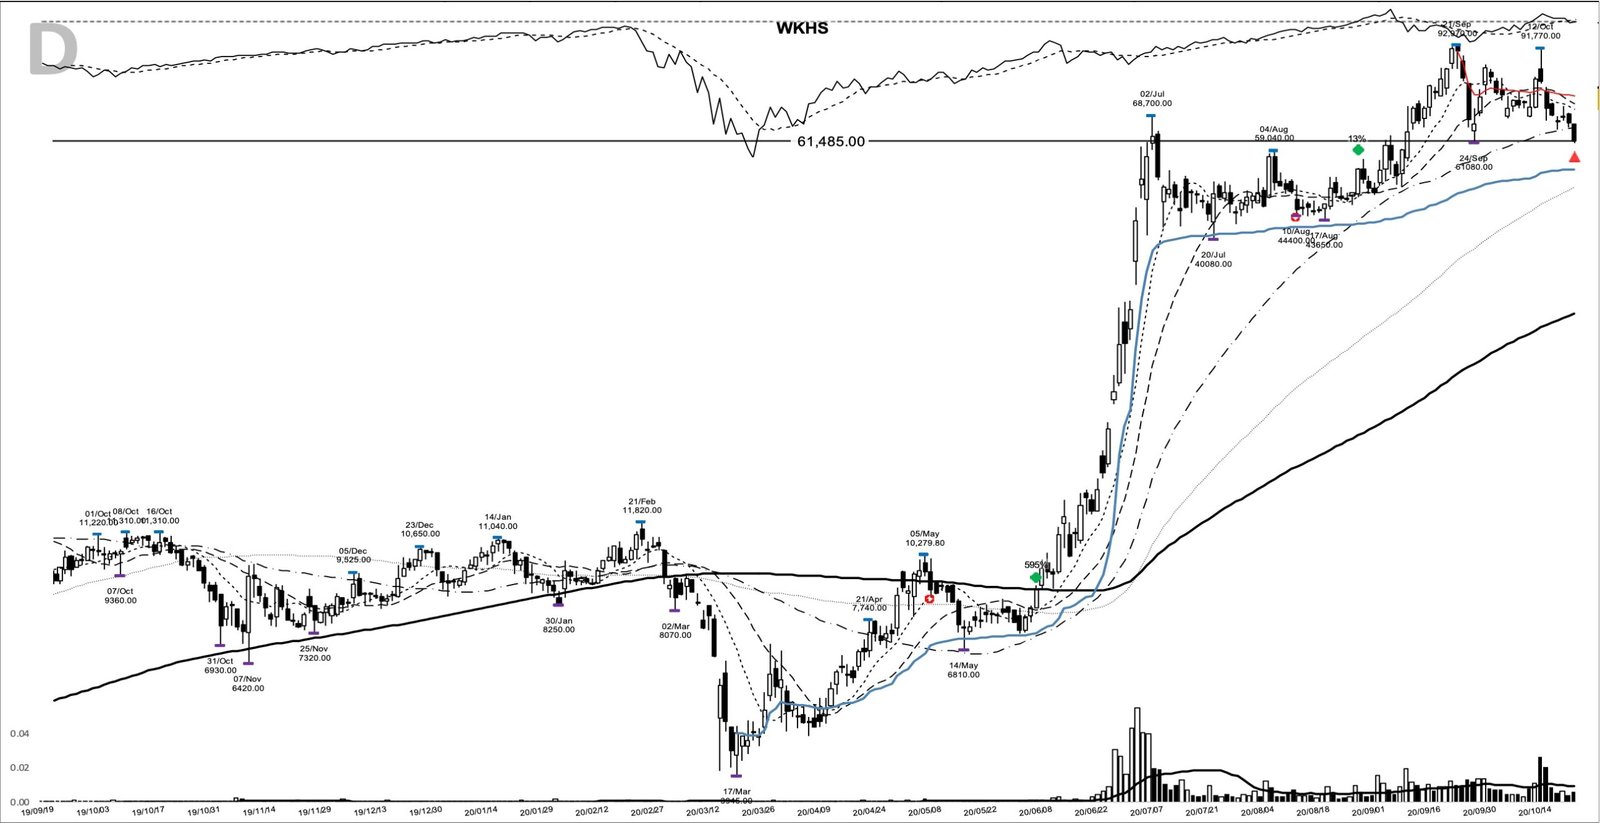
The first leg was vertical. After the 9 June clearance, WKHS closed at $17.39 on 30 June, 489.5% above the entry, and printed $22.90 intraday on 2 July. Volume exploded through the second half of June, a pace that resembles a climax run more than an orderly advance. On 10 July Hindenburg Research published a short report doubting the postal bid, and the stock closed down 5.5% at $15.18.
What followed was a seven-week range. The lows came at $13.36 on 20 July, $14.80 on 10 August and $14.55 on 17 August, all well above the rising 50-day line. The Lordstown merger with DiamondPeak, announced on 3 August, lifted the stock to a $19.18 close that day without breaking the range. On 25 August WKHS closed at $18.20 on volume about 1.9 times average, its highest close since 3 August, and there was an opportunity to add as the range resolved.
September tested that add. The Nasdaq fell into correction on 8 September, and WKHS closed up 8.5% that day at $21.38 on volume 3.3 times its average. It reached $30.99 on 21 September, 950.5% above the entry. Then it fell 11.1% and 16.5% on the next two sessions, closing at $22.47 on 23 September. A short report from Fuzzy Panda Research on 8 October renewed the postal doubts, and a rally to $30.59 on 12 October closed at $26.58, well off the high, on volume 2.9 times average.
The exit came on 20 October at $20.50, the stock’s first close below its 50-day line since the entry. The low that day was $20.36, the same price as the 24 September low. The exit closed the move 594.7% above the entry, and 1,000 dollars riding the full move would have become 6,947 dollars.
What the WKHS chart did not promise
The first misread is calling 3 June the breakout, when its close sat below the pivot and the 5 June push through $3.43 failed by the close. Volume of 1.9 times average was above normal, yet a stock 13.9% under its high can stall there for weeks. The early entry earned a tighter stop, and nothing more, until 9 June.
The second is assuming a mechanical trail would have held on. A 10-day trail would have exited on 10 July at $15.18, and a 20-day trail on 23 July at $15.60. Both would have locked in a large gain, and both would have missed the September leg to $30.99. Only a slower rule, such as the 50-day line, rode the whole move, and it gave back 33.9% from the peak before it triggered.
The third is reading the move as a verdict on the business. Revenue was shrinking, the profit was an accounting effect, and the postal contract was still undecided at the exit. The chart priced a story and a tape. A trader who confused that with earnings leadership had no reason to respect a 50-day break when it came.
Theme stocks run on the tape, then on the trend
WKHS rewarded two things: acting near a well-defined pivot in the strongest theme of a power-trend market, and sitting through a seven-week range that looked like a top. The 2 July close of $20.91 was higher than the exit, so most of the gain was made in the first month. The rest of the hold was about letting the trend decide. Learn the pattern. Ride the trend. Keep the gains.
Related studies: BLNK base breakout, June 2020, another electric-vehicle theme name from the same month, and TSLA base breakout, November 2019, the leader the whole group traded around. For the trend-following side, see Nicolas Darvas trading lessons. A new winner study lands most evenings.
Prices and volumes are as traded at the time; WKHS later did a 1-for-20 (June 2024), 1-for-12.5 (March 2025) and 1-for-12 (December 2025) reverse split, so today’s charts show different levels. Chart images show split-adjusted prices. Company figures come from SEC filings where cited.
Educational content only. Not investment advice. Trading involves risk. You are responsible for your decisions.
Get the free Market Wisdom e-book
Join Trends and Breakouts — historical winners, breakout studies, and risk lessons. No spam, unsubscribe anytime.