
Two names come out of the same hypothetical 100-stock screen. Stock A sits at rank 10 and Stock B at rank 35, and on the weekly chart both benchmark-relative lines have climbed for the past month. If the relative strength rating were simply a reading of that recent slope, the two would look interchangeable, yet Stock A carries a score of 90 and Stock B a score of 65. The gap comes from the full evaluation window, the universe they were ranked against and the weight the screen gives to recent quarters. Those three inputs decide what the number can tell you and where it stops.
What a relative strength rating of 90 says
A relative strength rating is a cross-sectional rank. Every stock in a defined universe gets a performance figure over the same window, the list is sorted, and each stock’s position is turned into a score. In this example the score is the number of stocks ranked below it. Stock A at rank 10 has 90 names beneath it, so it scores 90. Stock B at rank 35 has 65 beneath it and scores 65. A third name, Stock C, ranks 3rd and scores 97.
In plain English, a score near 90 means the stock’s price performance over the measured window beat roughly nine in ten of the stocks it was compared with. That’s the whole statement. It doesn’t mean a 90% return, and it doesn’t mean a 90% chance of anything. A stock can score 90 in a falling market while losing money, because the rank only says it lost less than most of its peers.
The approach is closely associated with William O’Neil’s leadership research, where a high rank was one filter among several used to find stocks before their largest advances. In that framework the rating narrows the list, and the setup is judged separately on the chart.
Universe, lookback and weighting decide the score
Change any of the three inputs and the same price history can land at a different rank. The table sets out what each one controls in this screen.
| Input | Setting in this screen | What it changes |
|---|---|---|
| Eligible universe | 100 hypothetical stocks | Who the stock is measured against. A score of 90 among 100 small growth names says something different from a score of 90 across a full exchange. |
| Lookback | Four quarters | How much history counts. A 12-month window still credits a run that ended nine months ago. |
| Weighting | Latest quarter 40%, each earlier quarter 20% | How fast the rank reacts. Heavier recent weight lifts stocks that are improving now. |
Stock A’s quarterly returns, newest first, are 18%, 12%, 9% and 6%. With the latest quarter double-weighted, its weighted score is 12.60, which is the 10th best of the 100. Stock B’s quarters are 14%, 2%, 6% and minus 20%, for a weighted score of 3.20 and rank 35.
The weighting matters more than it looks. Compound Stock B’s four quarters into a plain 12-month return and it comes to minus 1.39%, which ranks 57th in the same universe. The 14% latest quarter carries it up 22 places once recent performance gets double weight. Stock A barely moves under the switch: its plain 12-month return of 52.70% ranks 11th against 10th weighted. A trader comparing ratings from two providers is often comparing two different formulas, so a 10-point disagreement between them may say more about the construction than about the stock.
How a rank moves when old quarters roll out
The window keeps sliding. Each new quarter enters, the oldest leaves, and a stock’s rank can change even when its own recent behaviour hasn’t.
Stock B shows this clearly. Its minus 20% quarter is the oldest in the window. Freeze every price in the universe for one quarter, so the new quarter is 0% for all 100 stocks, and recompute. Stock B’s weighted score rises from 3.20 to 4.40 and its rank improves from 35th to 26th. The stock traded flat like every other name in the test. A bad quarter simply dropped off the back of the calculation.
The same mechanism works in reverse. A stock whose best quarter is about to roll out can slip down the table during a quiet stretch, and a reader who sees the score fall might read it as selling pressure while the price has barely moved. Checking which quarter is about to leave puts a change of a few places in context.
Rank 10 and rank 35 on weekly relative strength lines
The rank compresses a year into one number. The relative strength line shows the path, week by week, as the stock’s close divided by the benchmark’s close. Figure 1 plots both lines over 26 weeks, each indexed to 100 at week 1.
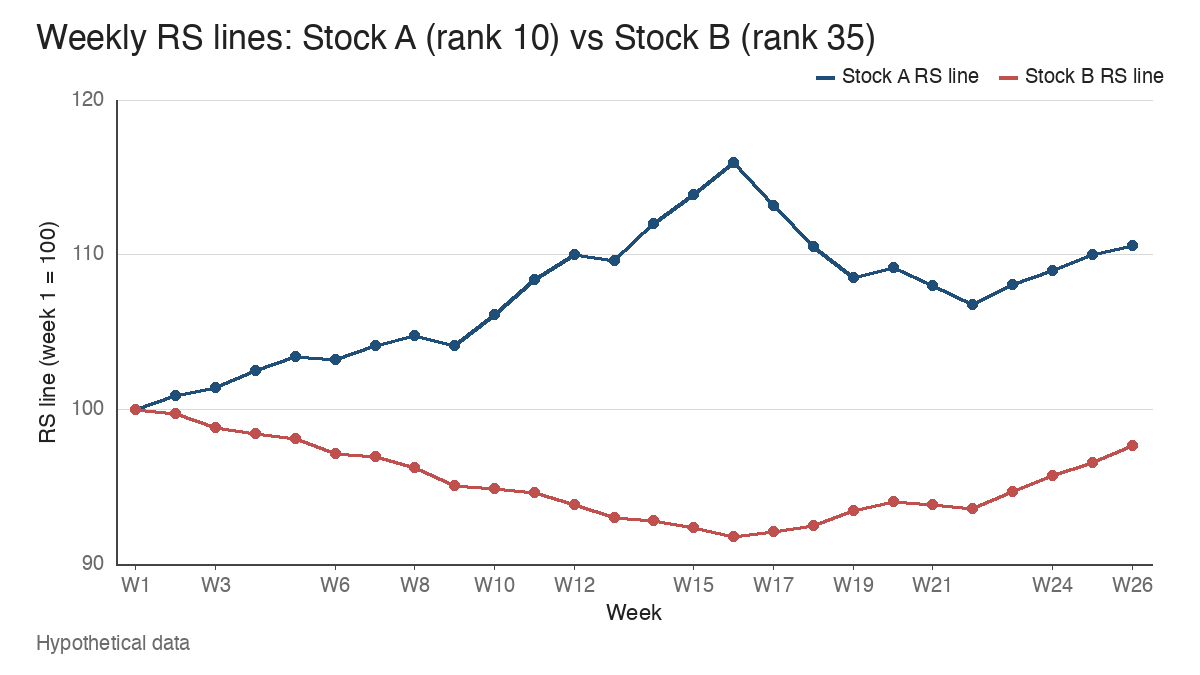
Over the latest month, from week 22 to week 26, both lines rise. Stock A’s line moves from 106.81 to 110.58, a gain of 3.53%. Stock B’s moves from 93.58 to 97.65, a gain of 4.35%. On that window alone, B is the stronger of the two.
The longer window tells the other story. Across all 26 weeks Stock A’s line is up 10.58% while Stock B’s is down 2.35%, with B’s low of 91.81 coming at week 16. The benchmark itself gained 4.77% over the same span. That difference, compounded over four quarters, is why A ranks 10th and B ranks 35th.
A common misread is to treat the latest slope as a promotion in waiting. On its own, B’s steeper month leaves its rank where it is. It would need to keep outperforming for long enough to replace weaker quarters in the window. The chart also flags something the score hides: Stock A’s line peaked at 115.94 in week 16 and still sits below that high at 110.58. A rank of 10 and an RS line under its own high can coexist, and the line is the one that shows it.
A falling stock with a rising relative strength line
Relative strength is a ratio, so it can rise while the price falls. Take a stock that drops 4% over a stretch in which the benchmark drops 10%. The ratio of stock to benchmark moves from 1.00 to 0.96 divided by 0.90, which is a 6.67% rise in the relative strength line.
That rising line is a fact about comparison. The holder still has a 4% loss. During a broad decline, the stocks that hold up best often build the highest ranks in the screen, and some of them go on to lead when the market turns. Others are simply defensive businesses falling more slowly. The rank can’t separate the two, and neither can the line on its own.
Peer context helps here. If the stock’s group is also outperforming, the strength has company. Industry group leadership asks whether several names in the same group are ranking well together, which makes a high score look less like one company’s accident.
From the rank table to chart review
Suppose the screen passes every stock ranked in the top 10 to chart review. Stock A, rank 10, and Stock C, rank 3, are two of the names that arrive. A rating describes how far a stock has run against the field, and it can’t tell you whether the chart has built a sound place to act.
Figure 2 is Stock A’s weekly chart for weeks 7 to 26, with a 10-week moving average.
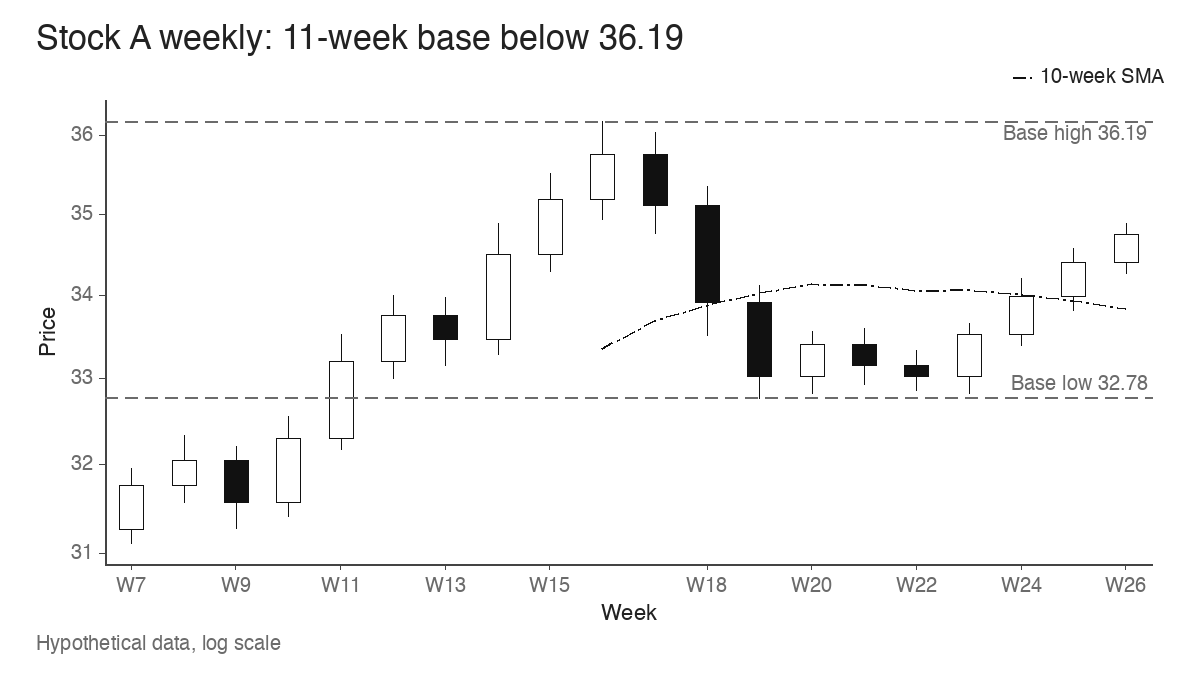
Stock A set its high of 36.19 in week 16 and has spent 11 weeks consolidating below it. The deepest low in the base is 32.78 in week 19, a correction of 9.42% from the high. The latest close is 34.76, which is 3.95% under the 36.19 high and 2.71% above the 10-week average at 33.84. The ranges tighten in the later weeks and the closes rise toward the top of the base. A trader using this approach might mark 36.19 as the potential pivot and wait to see whether price clears it, because the chart has defined a level and the rank hasn’t.
Stock C ranks higher and its chart is less useful at this moment. Its latest quarter returned 55%, which is what lifted it to 3rd. It cleared a hypothetical pivot of 42.00 and now closes at 61.20, which is 45.71% above that pivot. A widely used rule treats about 5% above the pivot as the outer edge of a reasonable entry area, here 44.10, and Stock C is far past it. A move back to the old pivot would be a fall of 31.37% from the latest close. The extension from the breakout pivot is the problem on this chart, and a score of 97 does nothing to fix it.
So the higher-ranked stock is the weaker candidate for now. The rank put both names on the list. The chart separates a stock that is still building a base from one that has already made its move and may need weeks or months to form a new one. Many traders run a structural check alongside the rank, such as the moving-average conditions in the trend template, before spending time on the base itself.
What the rank leaves for the chart to answer
A relative strength rating answers one question: how this stock’s price performance compares with a particular universe over a particular, weighted window. Change the universe, the lookback or the weights and the number moves. Let a few quarters roll out and it moves again with no new trading at all. Providers that use different formulas will publish different scores for the same name on the same day.
All of that makes the rating a filter. A score of 90 tells you where to look, and the weekly chart tells you whether there’s anything there yet: a base with a defined high, a line that confirms or lags, a group that moves with it. Stock A at rank 10 had a defined high at 36.19 with a 9.42% base beneath it. Stock C at rank 3 had a higher score and a chart already 45.71% past its pivot.
Learn the pattern. Ride the trend. Keep the gains.
Educational content only. Not investment advice. Trading involves risk. You are responsible for your decisions.
Get the free Market Wisdom e-book
Join Trends and Breakouts — historical winners, breakout studies, and risk lessons. No spam, unsubscribe anytime.