A stock clears a six-week base on heavy volume and the chart looks clean. Price closed at 142.30, comfortably above the 138.50 pivot, and the relative strength line...
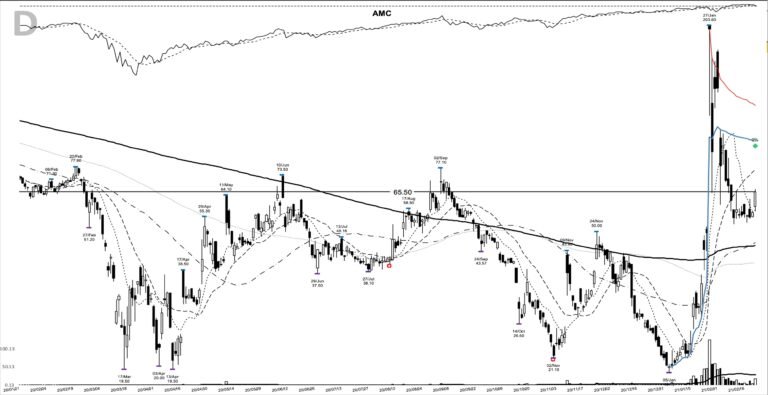
AMC is back on the retail trackers this month, and it’s worth pulling up the chart from the last time it ran rather than the headlines around it. In February 2021...
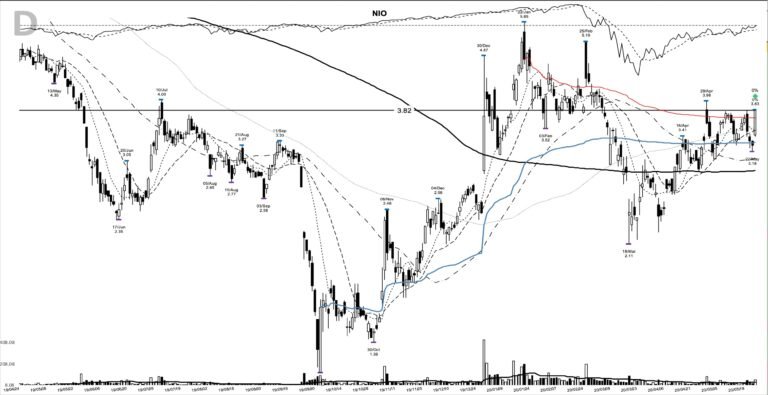
NIO’s back on the StockTwits trending list this week, and a mid-July 2026 upgrade to buy from Goldman Sachs is a big reason why. That makes now a good time to study...
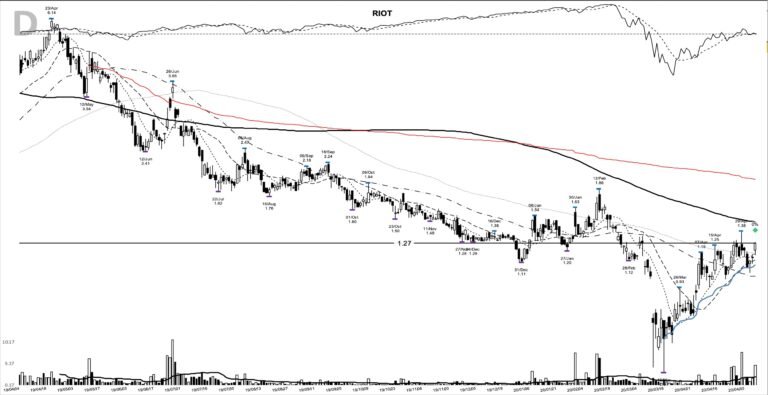
RIOT’s back on traders’ screens this week, ranked number 20 on the Stocktwits most-active list on 13 July 2026, and that’s reason enough to pull up the...
You mark a small-cap you’ve been watching, the last trade printed at 24.05, and you send a market order to get in. The fill comes back at 24.18. Nothing moved...
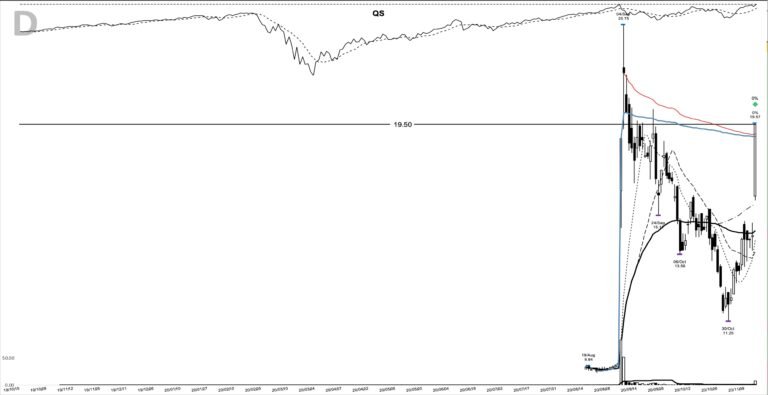
QS is back near the top of the StockTwits trending list this week, and the chart worth pulling up is one from late 2020, when the same ticker resolved a ten-week base and...
You take a breakout at 50.00 on a stock that spent six weeks coiling under resistance. The next morning it opens at 51.20 and holds. Your thesis is working, and now you...
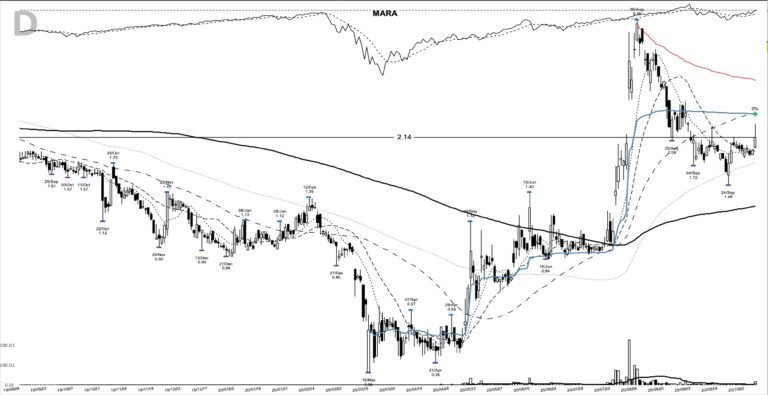
MARA is back near the top of the trending lists this week, and when a Bitcoin miner shows up on the movers again it’s worth pulling up the chart that made its name...
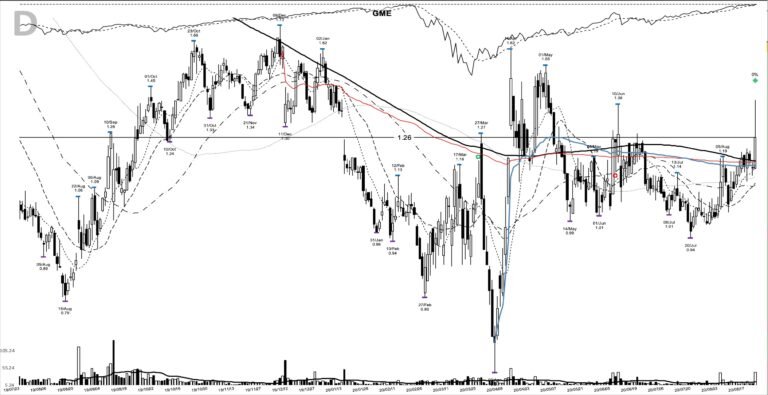
GameStop is back near the top of the StockTwits trending list today, which is as good a reason as any to pull the one GME chart worth keeping. Long before the January...
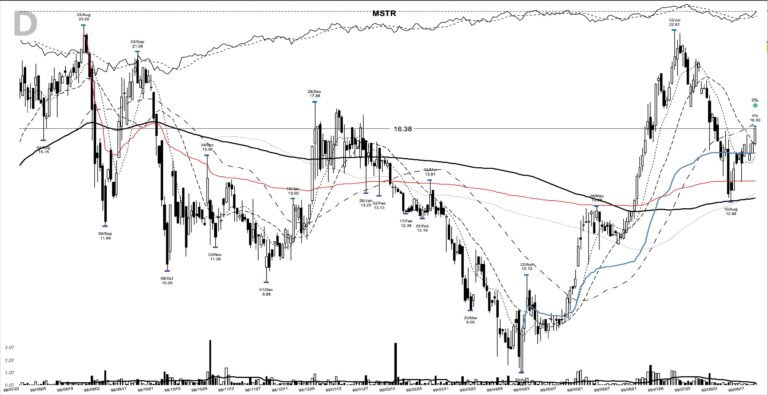
MSTR is one of those tickers that pulls a crowd every time it moves, so when it lights up the screens again it is worth pulling up the chart that started its most famous...
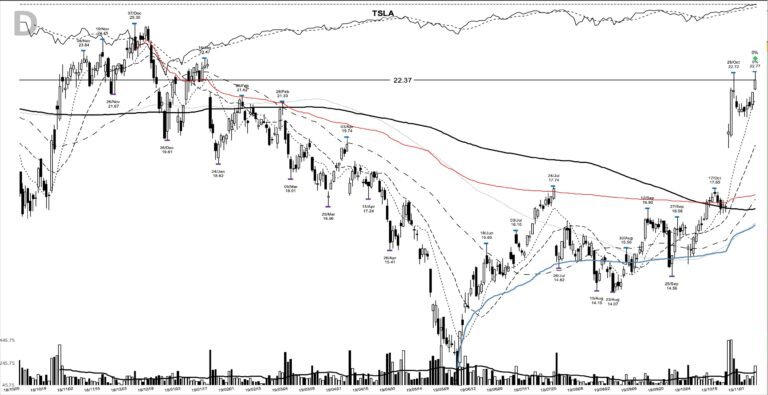
TSLA is back on traders’ screens, so the chart worth pulling up is the one from late 2019, well before today’s tape. On 7 November 2019, Tesla tagged a 22.72...
A trader can be right more often than wrong, collect two dollars on every winner for each dollar lost, and still drive the account to zero. It sounds impossible until...