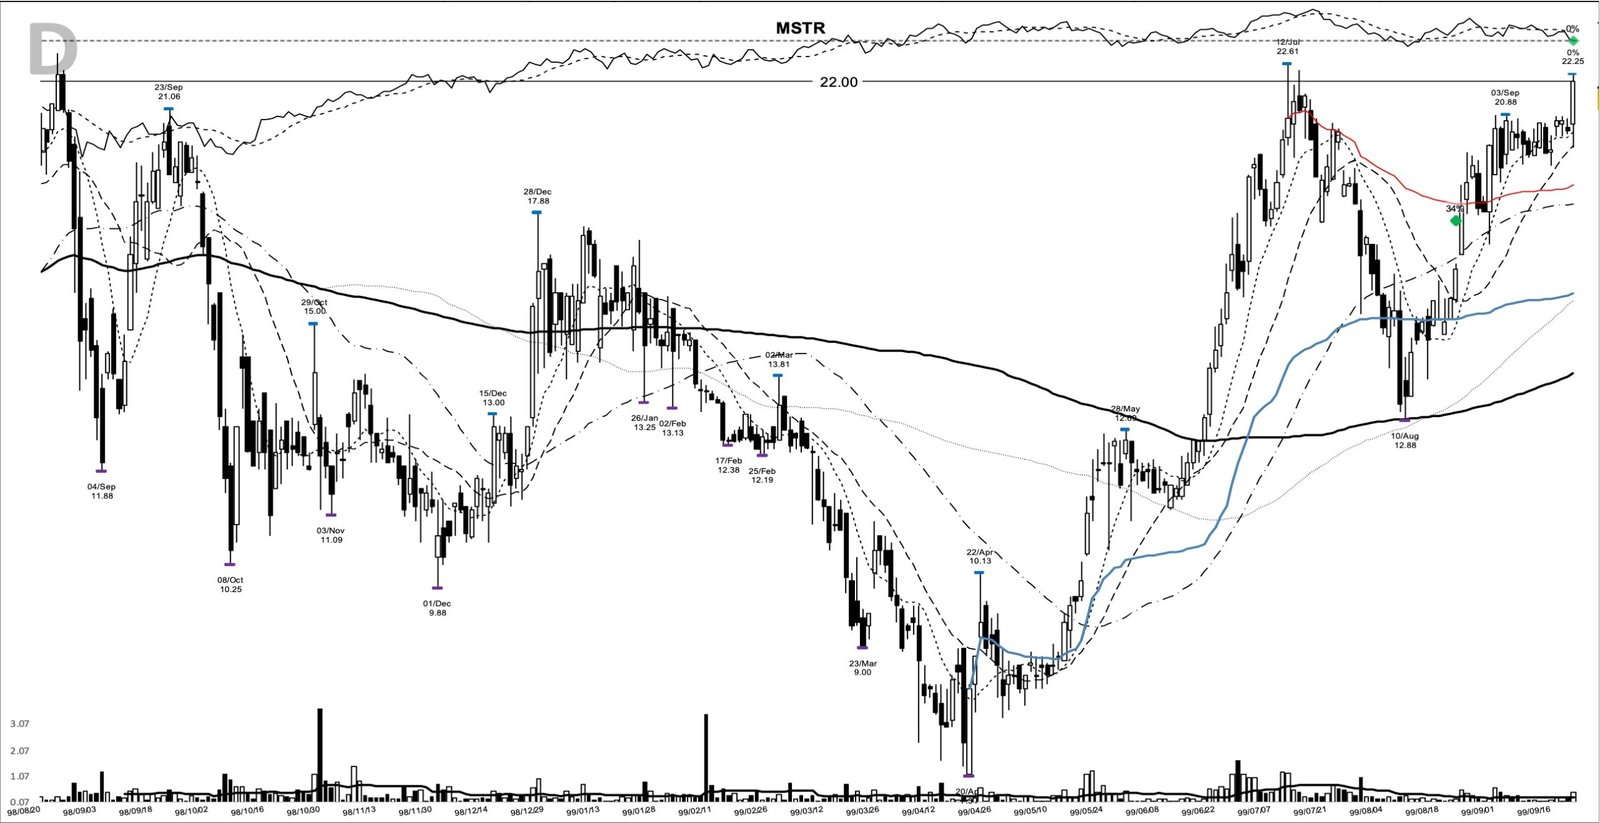
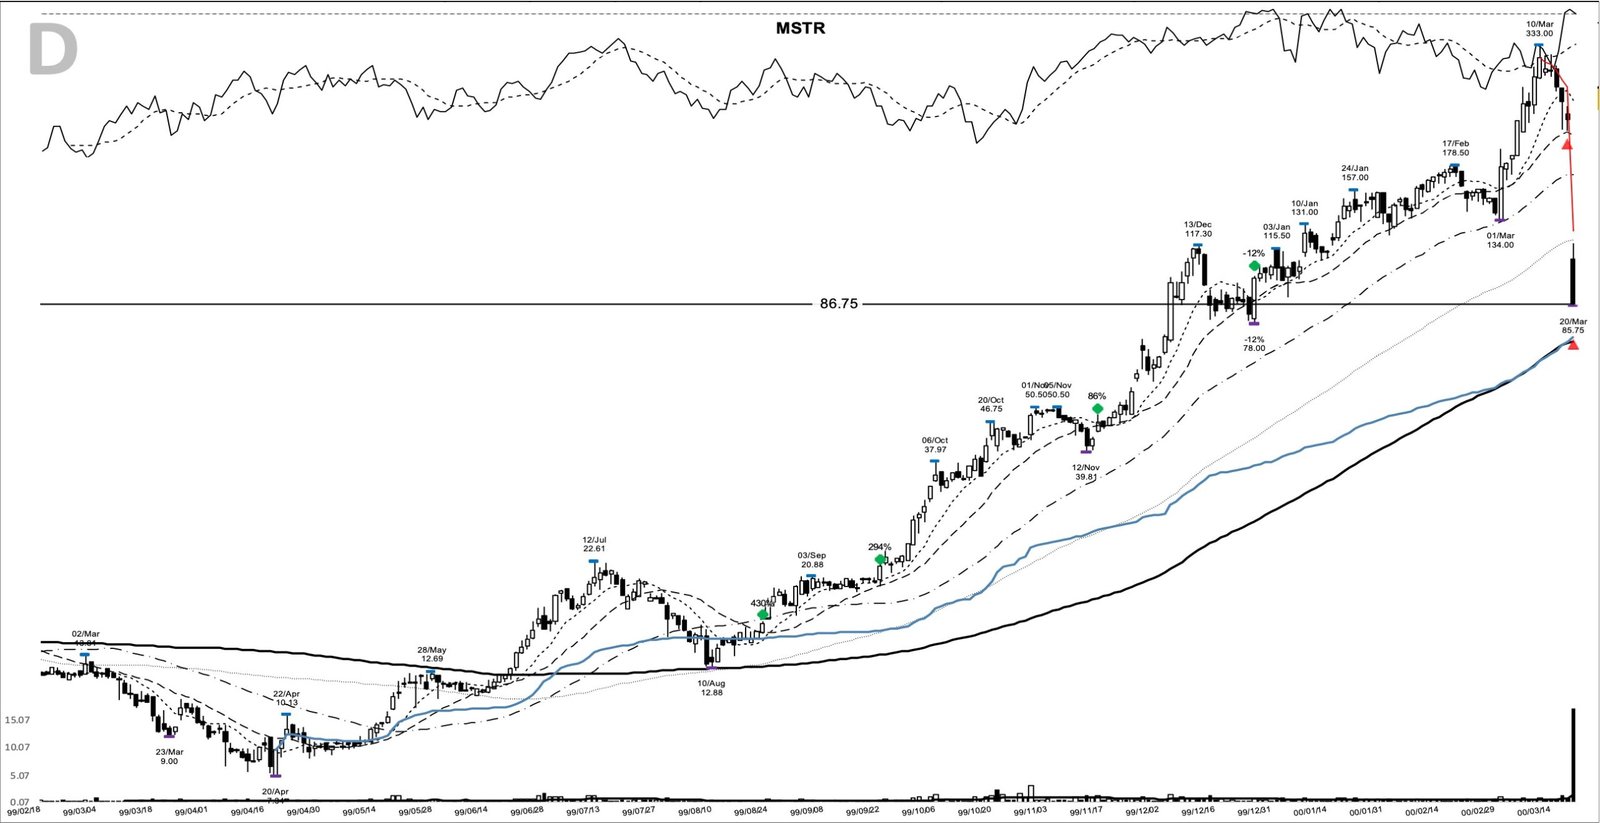
MSTR is one of those tickers that pulls a crowd every time it moves, so when it lights up the screens again it is worth pulling up the chart that started its most famous run. This MSTR base breakout is a trade from my study archive: an entry on 23 August 1999 as MicroStrategy turned up out of a deep base, a setup that went on to gain 430% over 210 calendar days before the exit closed on the March 2000 crash.
The interesting part is where the entry sat. The marked buy printed at a close of 16.38, still under the resistance that had capped the prior month, on a day when volume was below average. What made it a textbook base breakout showed up in the sessions that followed, not on the entry bar itself.
The MSTR base breakout in five key takeaways
- The pattern was a base breakout off a deep 1999 base, with the marked entry on 23 August 1999 at a close of 16.38.
- The realized move ran +429.8% from that entry to an exit close of 86.75 on 20 March 2000, a hold of 210 calendar days.
- The 19.19 pivot from late July was the overhead level to clear; it gave way within a week of the entry, on 26 August.
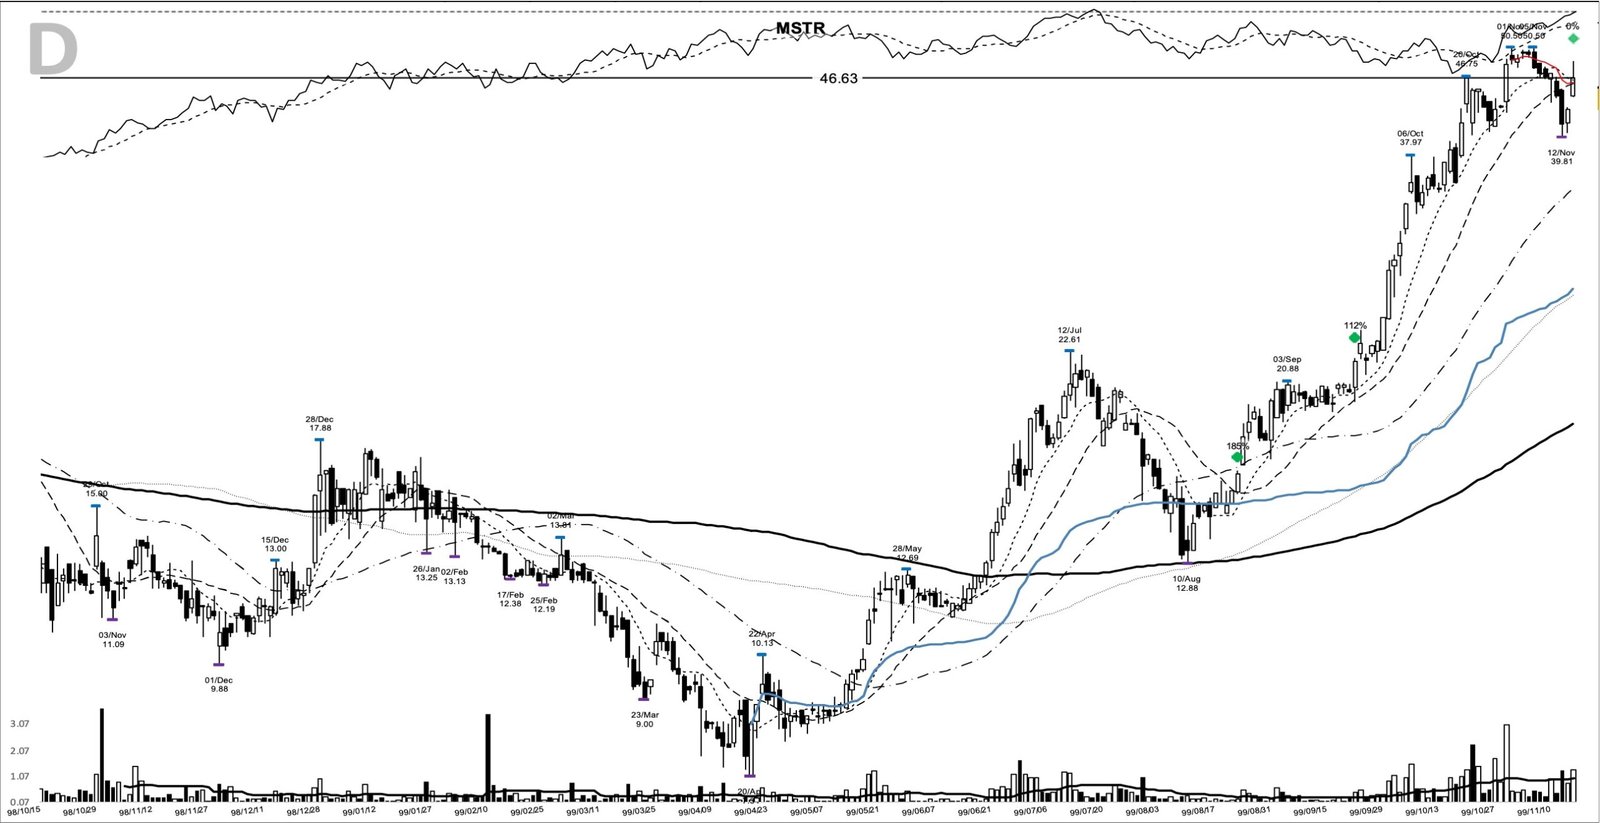
- The study marks three add points as the trend extended, from 22.00 in September to 46.62 in November and 98.75 in late December.
- The run peaked at 333.00 on 10 March 2000, then an accounting restatement collapsed the stock into the exit ten sessions later.
The MSTR trade at a glance
| Field | Value |
|---|---|
| Ticker | MSTR |
| Study entry date (anticipatory) | 23 August 1999 |
| Entry close | 16.38 |
| Pivot | 19.19 |
| Pivot cleared | 26 August 1999 at a close of 19.25 |
| Volume vs 20-day average | 0.6x |
| Exit date | 20 March 2000 |
| Exit close | 86.75 |
| Gain | +429.8% |
| Calendar days | 210 |
| Peak before exit | 333.00 (10 March 2000) |
How the base built under the 19.19 pivot
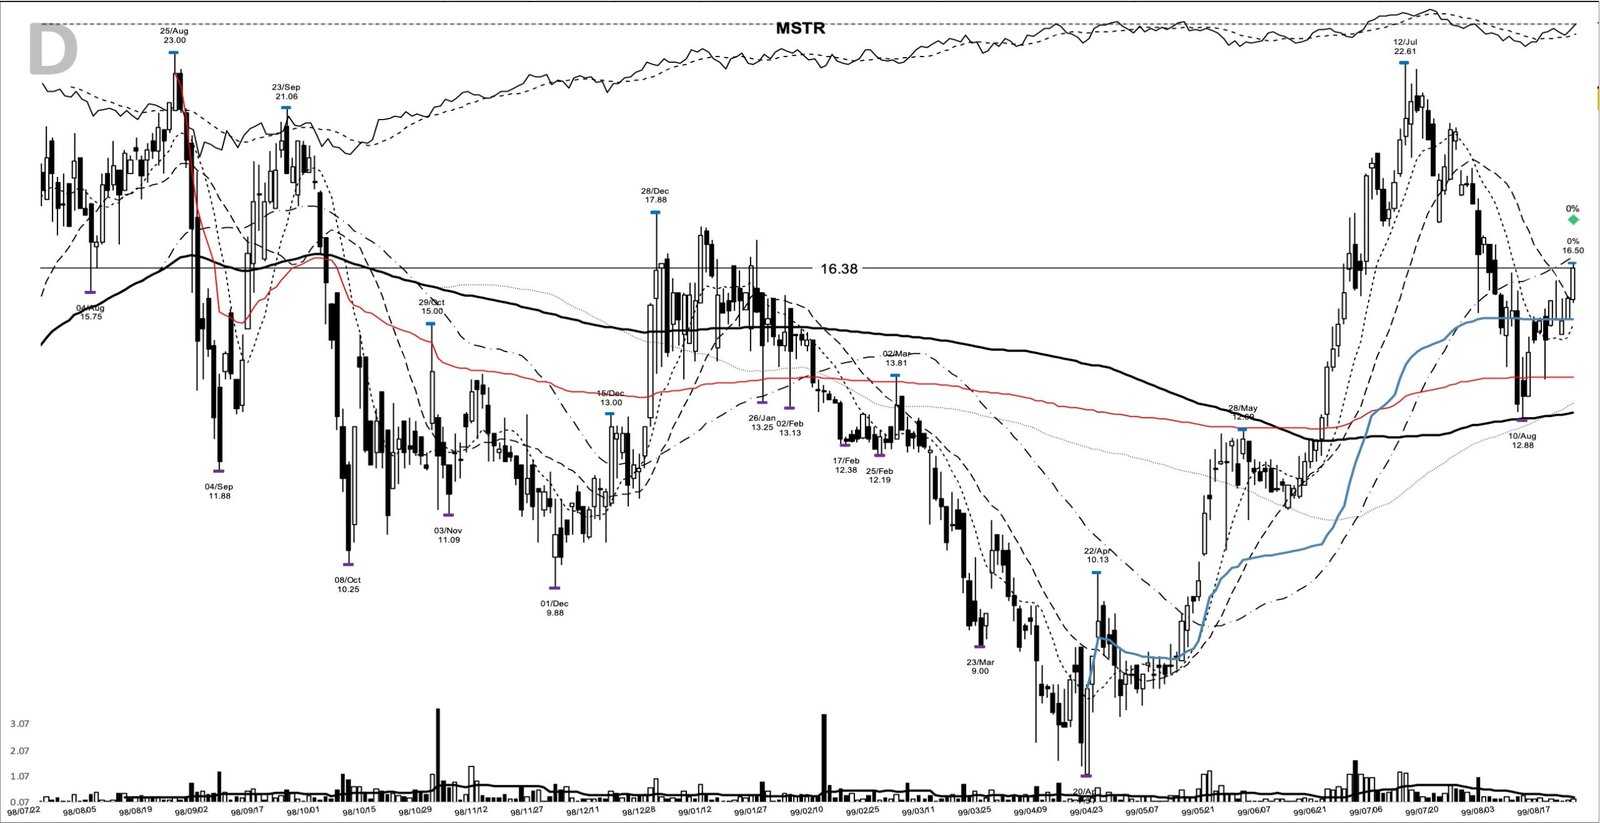
Walk the base from the bottom. The stock had bottomed at 7.34 on 20 April 1999, then tripled into a base high of 22.61 by 12 July. That kind of recovery off a washed-out low is the right side of a base, and it left a clear line overhead at the 19.19 pivot printed on 28 July.
From that July high the stock pulled back and carved a shelf. It dropped to a 20-day low of 12.88 on 10 August, then held a tighter five-day low of 13.75 on 16 August. The entry came on 23 August, an up day that closed at 16.38 near the session high of 16.50, lifting off the shelf and back above its shorter moving averages.
Here is the twist that makes this a useful teaching chart. By the study’s own labeling this was an anticipatory entry: the 16.38 close sat below the 19.19 pivot, so the marked buy came ahead of the pivot clearance. The entry-day bar traded only about 176,000 shares against a 20-day average near 280,700, roughly 0.6 times normal. The textbook wants a base breakout to arrive on expanding volume, and this one did not, on the day itself. The confirming volume showed up the next session, when price jumped above 18 on turnover near 515,000 shares. The 19.19 pivot then gave way on 26 August, when price closed at 19.25, and the base breakout was confirmed. Reading the volume signature of a breakout candle is what separates the entry bar from the follow-through here.
MicroStrategy in 1999: the data-mining darling
The business behind the chart was MicroStrategy, a business-intelligence and data-mining software company that Michael Saylor had founded in 1989 and taken public in June 1998. By 1999 it was one of the market’s favorite technology growth stories, and its reported revenue growth was the fuel investors were pricing in as the shares tripled off the spring low.
That story is also a warning label. On 20 March 2000 the company announced it would restate its 1998 and 1999 financial results, and the SEC later brought charges over how those results had been reported. The restated figures cut previously reported revenue by tens of millions, and the growth the market had paid such a premium for turned out smaller than the headline numbers claimed. The chart ran on the reported story; the exit came when that story broke. The fundamental-growth frame here fits the classic CANSLIM system read of a leader, right up until the accounting gave way.
The tape behind the run: the late dot-com bull
No leader runs 400% in a vacuum. The backdrop was the final leg of the dot-com bull, a tape that rewarded technology momentum aggressively into early 2000. A name with accelerating growth and fresh relative strength was exactly what that market wanted.
The timing at the end was almost poetic. MSTR peaked on 10 March 2000, the same window the broad technology rally rolled over. When that tape turned, the names that had run the hardest fell the hardest, and MicroStrategy had its own catalyst waiting to make the fall worse.
Spotting MSTR before the 19.19 pivot gave way
The repeatable part of this setup was visible before the breakout confirmed. Into the 23 August entry, price had closed above its 10-day moving average for five straight sessions and sat about 9.3% above that line, which stood near 14.98. It had reclaimed the 20-day average near 15.57 and was pressing up into the 50-day near 16.67. The short-term trend had already turned up while the stock was still under its pivot.
The structural anchors were just as clear: the 6-month base low at 7.34, the base high at 22.61, the 19.19 pivot from 28 July as the overhead line, and the 13.75 shelf as the recent floor. A stock recovering the right side of a deep base and holding a higher low above that shelf, with one clean line to clear overhead, is a watchlist candidate before it moves.
From there a disciplined trader could have written a plan that morning. A trend follower might have entered on a move up through the 19.19 pivot, set the initial stop below the 13.75 shelf, or wider, below the 7.34 base low where the whole structure fails, then trailed the 10-day moving average, widening to the 20-day once the move was well advanced. That is a mechanical trend-following template, and the difference from the marked study entry is worth spelling out: the buy at 16.38 was an aggressive early entry off the shelf, ahead of the pivot, while the more conservative plan waited for the 19.19 pivot to clear, which it did within the week.
How MSTR ran to 333 and back
Once the pivot gave way the trend did the work. A trader using this pattern might have watched the higher lows and the widening distance above the moving averages as the tell to keep holding, and there was an opportunity to add as the base breakout extended. The study marks three of those add points: 22.00 on 22 September, 46.62 on 16 November, and 98.75 on 28 December, each a continuation higher rather than a fresh base.
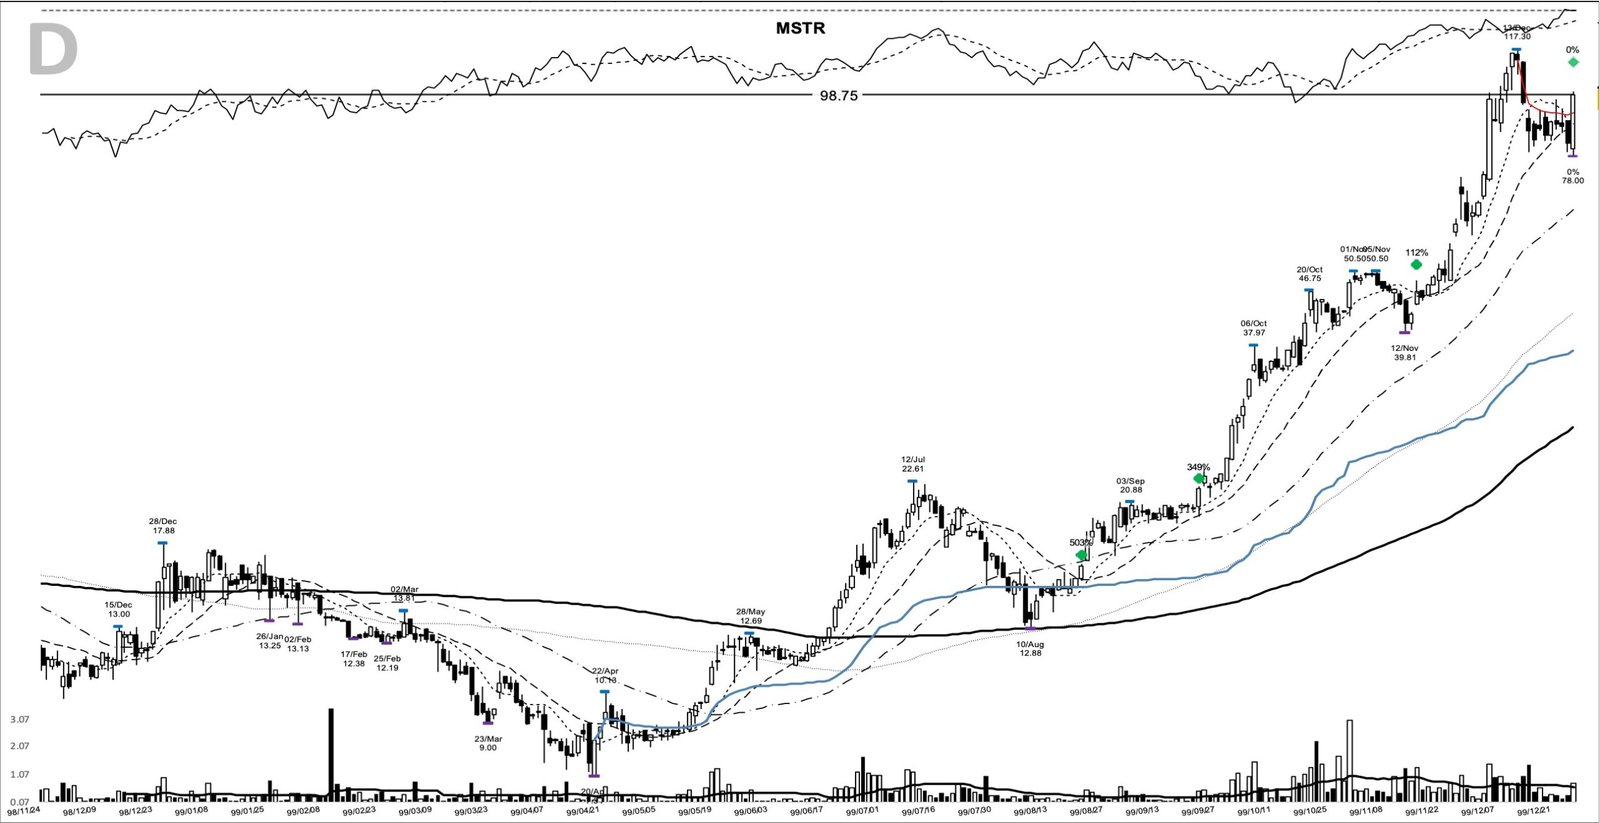
The move went parabolic into 2000 and peaked at 333.00 on 10 March. Then the accounting news hit. The study marks two exit points, and the sequence is the lesson. The first sell marker on 17 March came near 226.75 as the stock broke down from its peak, an exit around 1284% above the 16.38 entry. Three sessions later, on 20 March, the restatement announcement crashed the stock roughly 62% in one session, and the exit closed the move at 86.75.
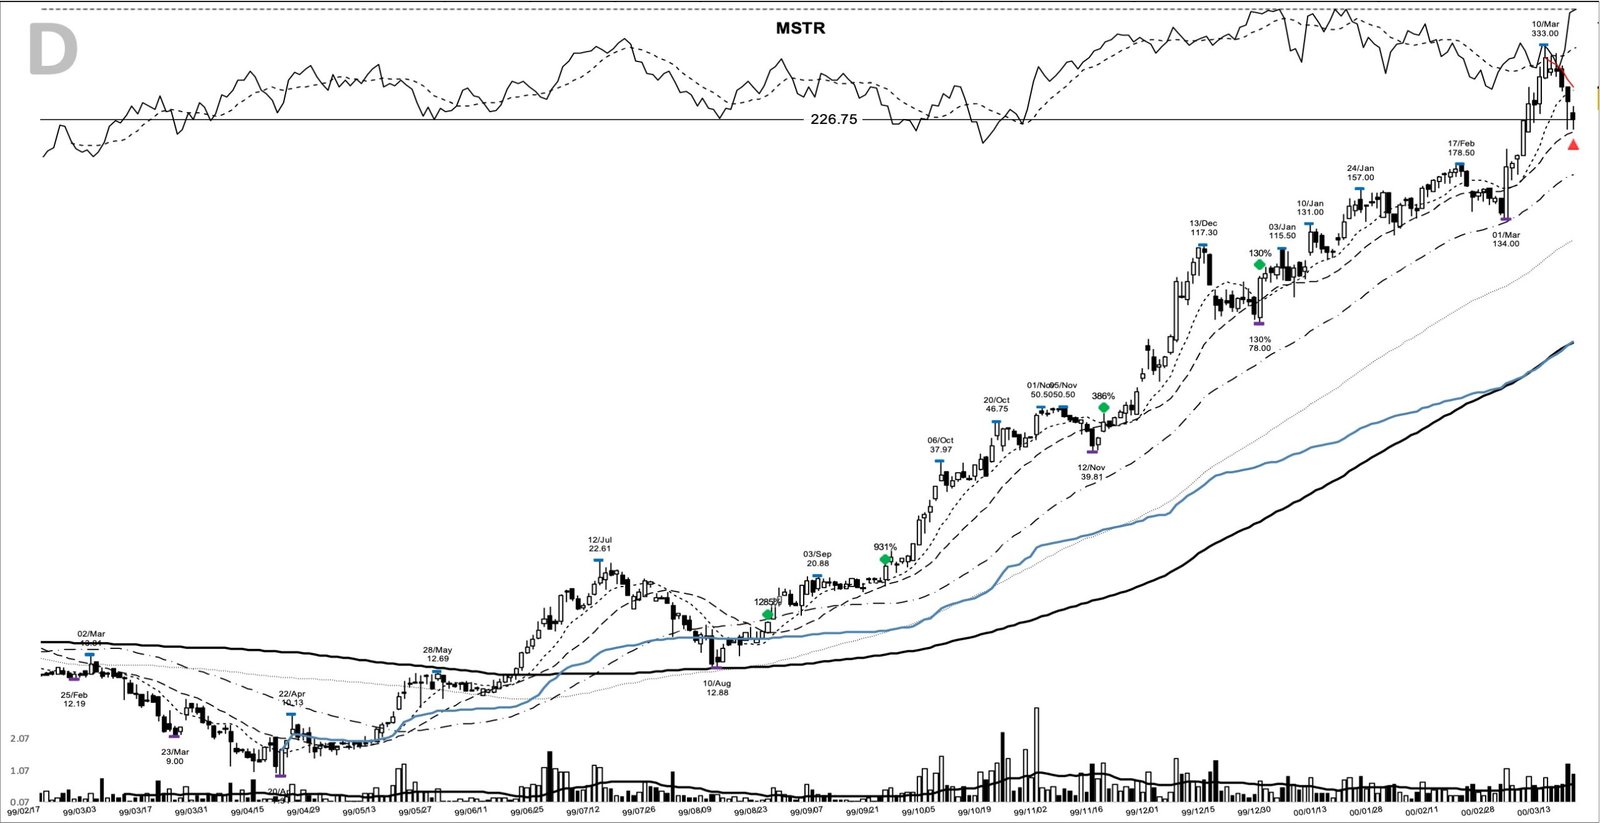
Even the conservative exit on the crash day preserved a +429.8% gain from the entry. A thousand dollars tracking the full move from the 16.38 close to the 86.75 close would have become about 5,300 by 20 March. The earlier marker at 226.75 shows why reacting to the first clean break of a trend matters, because waiting through the crash gave back a large slice of the paper gain.
Where this base breakout could have fooled you
The first trap is the volume reading. The entry bar was quiet, only 0.6 times its 20-day average, so a trader demanding a big-volume breakout candle on the entry day itself would have passed on the 23 August turn. The volume confirmation arrived a session later. Insisting on textbook volume on the exact entry bar would have skipped this base breakout.
The second trap is confusing the early entry with a confirmed breakout. The 16.38 buy sat well below the 19.19 pivot, which means holding through the gap up to that overhead line before the base breakout was actually confirmed on 26 August. An entry off the shelf carries more risk than an entry on the pivot break, and treating the two as the same thing understates that risk.
The third trap is the ending. The pattern promised nothing about the top. The stock ran to 333.00 and then lost most of it in days on the restatement. Buying extended, far above the base and near the March 2000 peak, put a trader directly in front of that collapse. The base breakout was an entry signal down at 16.38, not a reason to hold forever.
Reading the next base the way MSTR set up
Strip out the dot-com drama and the mechanics are ordinary. A deep base, a recovery up the right side, one clean pivot overhead, an early turn off a tight shelf, and volume that confirmed a day late rather than on cue. The move that followed was extraordinary, but the read that got a watchlist to the entry was plain chart structure. Learn the pattern. Ride the trend. Keep the gains.
Related studies: the base-and-breakout playbook runs through William O’Neil’s market-leader work, Weinstein stage analysis, and the CANSLIM system. A new winner study lands here most evenings.
Price and volume figures are computed from split-adjusted daily OHLCV data; company figures come from SEC filings where cited.
Educational content only. Not investment advice. Trading involves risk. You are responsible for your decisions.
Get the free Market Wisdom e-book
Join Trends and Breakouts — historical winners, breakout studies, and risk lessons. No spam, unsubscribe anytime.