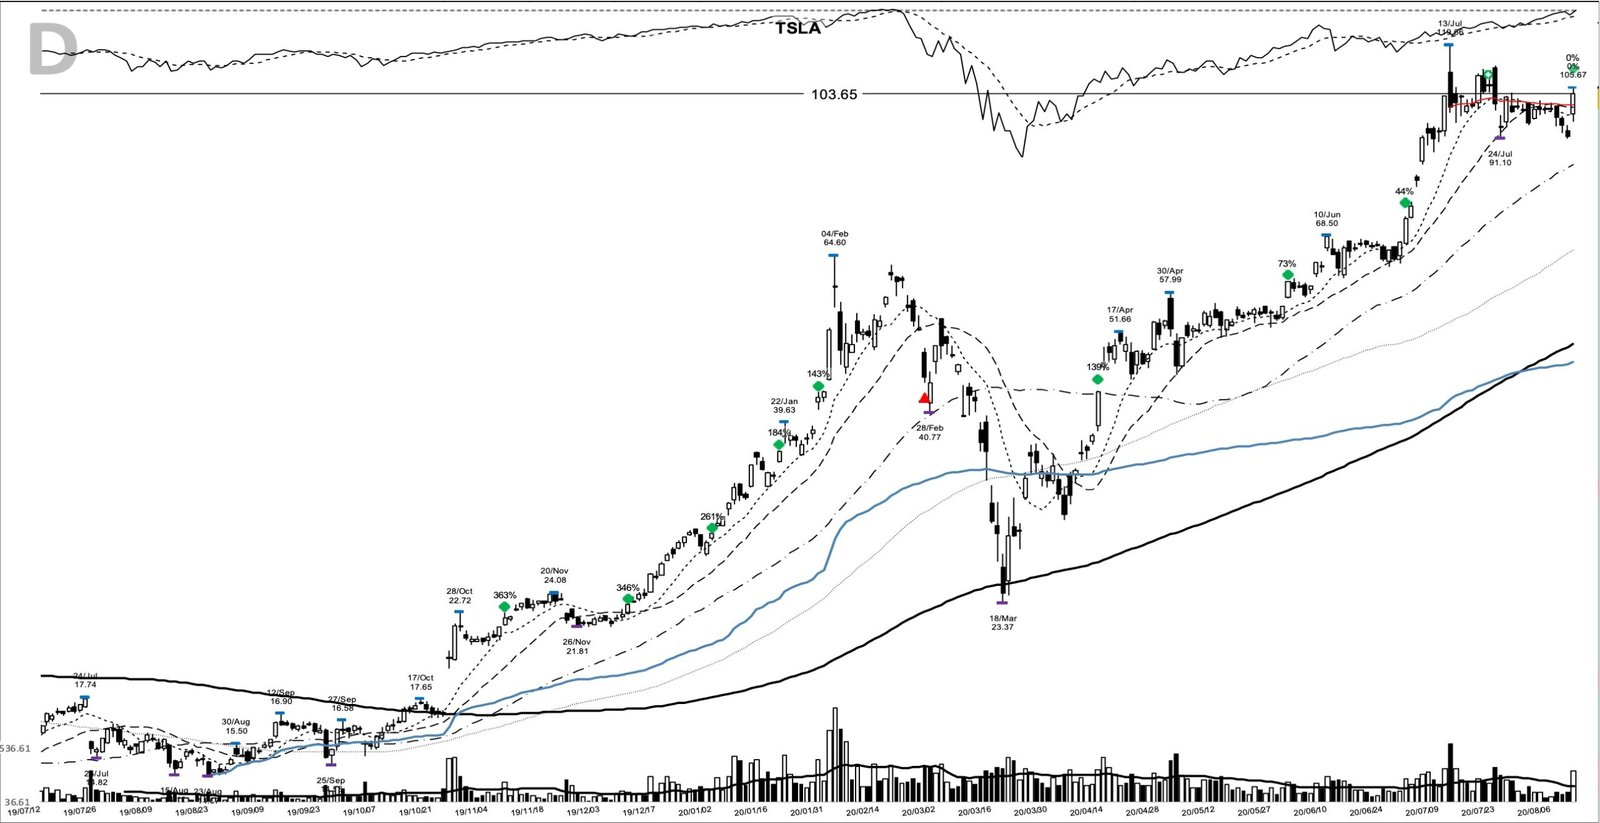
TSLA is back on traders’ screens, so the chart worth pulling up is the one from late 2019, well before today’s tape. On 7 November 2019, Tesla tagged the 22.72 pivot intraday, closed just below it at 22.37, and marked the entry from a base that had roughly halved the stock over six months. That ordinary-looking bar started a clean trend. The TSLA base breakout of November 2019 ran for 473 calendar days, and the exit closed the move up 965%, at 238.16, off a 300.13 peak reached along the way.
Key takeaways from the TSLA base breakout
- A six-month base bottomed at 11.80 in June 2019; the marked entry came on 7 November at a 22.37 close, an intraday tag of the 22.72 pivot that cleared on a closing basis two sessions later at 23.01.
- The entry bar traded on volume near 1.4 times the 20-day average, with the 10, 20, and 50-day moving averages stacked and turning up underneath.
- The exit landed 473 days later at 238.16, a 964.7% move from the 22.37 entry close, with a 300.13 peak in January 2021.
- More than a dozen controlled pullbacks gave a trend follower chances to add, from a 28.68 close in January 2020 to 147.20 after Tesla’s S&P 500 news.
- The entry was one decision; the trailing stop and the add discipline did the heavier work over the fifteen months that followed.
The TSLA trade at a glance: 22.37 to 238.16
| Metric | Value |
|---|---|
| Ticker | TSLA |
| Study entry date (intraday pivot test) | 7 November 2019 |
| Entry close | 22.37 |
| Pivot | 22.72 |
| Pivot cleared | 11 November 2019 at a close of 23.01 |
| Volume vs 20-day average | 1.4x |
| Exit date | 22 February 2021 |
| Exit close | 238.16 |
| Gain | 964.7% |
| Calendar days held | 473 |
| Peak before exit | 300.13 (25 January 2021) |
The charts here come from my study archive, each marked as of the day in its caption.
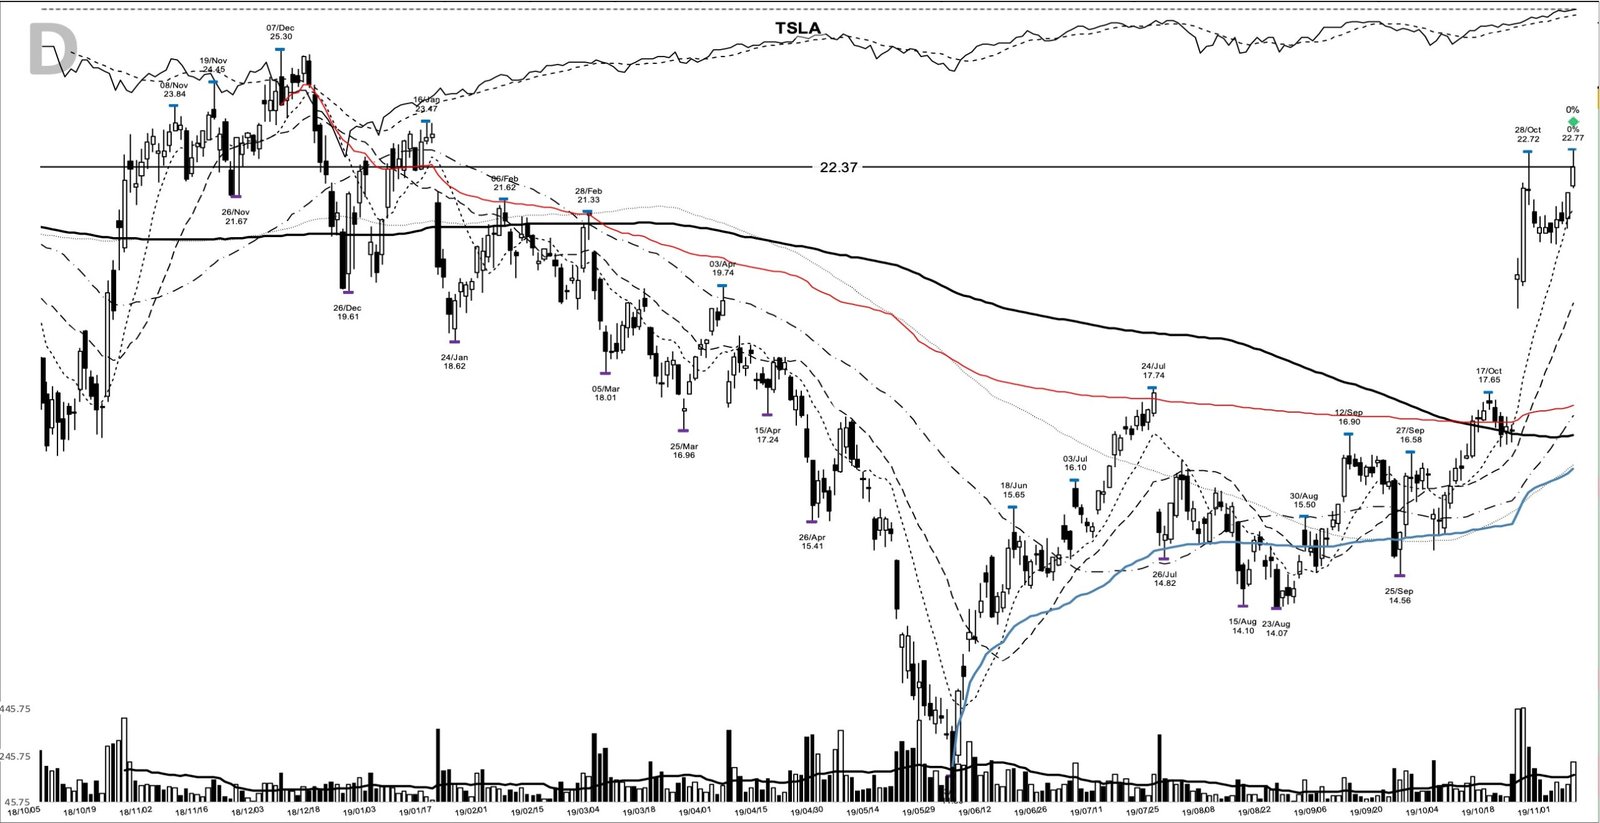
How the base built under the 22.72 pivot
Tesla topped at 25.30 in December 2018, then ground lower for six months to an 11.80 low on 3 June 2019. Measured against the 22.72 pivot that later capped its right side, the base was 48% deep. A drop that size warns as much as it tempts: deep bases fail more often than shallow ones, so the repair had to earn belief before the pivot mattered.
The turn showed up in volume before it showed up in the pivot. The two heaviest buying sessions of the whole base arrived on 24 and 25 October: the stock gapped from a 16.98 close into the 19s, closed at 19.98 on volume near 447 million shares, and followed through the next day on even heavier trade. That gap set the right edge of the base and printed the 22.72 pivot high two sessions later, on 28 October.
The entry two weeks on looked tame. On 7 November the bar opened at 21.94, pushed to a 22.77 high that tagged the 22.72 pivot, and closed at 22.37, its highest close since mid-January. By the strict reading the entry was an intraday pivot test that preceded the pivot clearance: the bar traded through 22.72 intraday but finished beneath it at 22.37, and the pivot cleared on a closing basis two sessions later, on 11 November at 23.01. Volume ran about 1.4 times the 20-day average, above the recent norm without being decisive, the kind of participation the work on volume-confirmation breakout candles weighs on a pivot day.
Tesla’s swing to profit into the 7 November entry
The base did not resolve in a vacuum. After the close on 23 October 2019, Tesla reported third-quarter results and surprised almost everyone with a return to profit and positive free cash flow, per the company’s release and CNBC’s coverage. The stock jumped roughly 20% after hours, which is the gap on 24 October.
The earnings path into that report is the frame a base breakout wants underneath it. On the SEC filing basis, Tesla lost 4.10 per share in the first quarter of 2019 and 2.31 in the second, then swung to a 0.16 per-share profit in the third. Revenue had already scaled through 2018 as Model 3 volume ramped, from 3.41 billion in that year’s first quarter to 6.82 billion by the third. A leader leaving a deep base on an earnings turn is the classic profile behind the CANSLIM trading system and the base-breakout studies of William O’Neil.
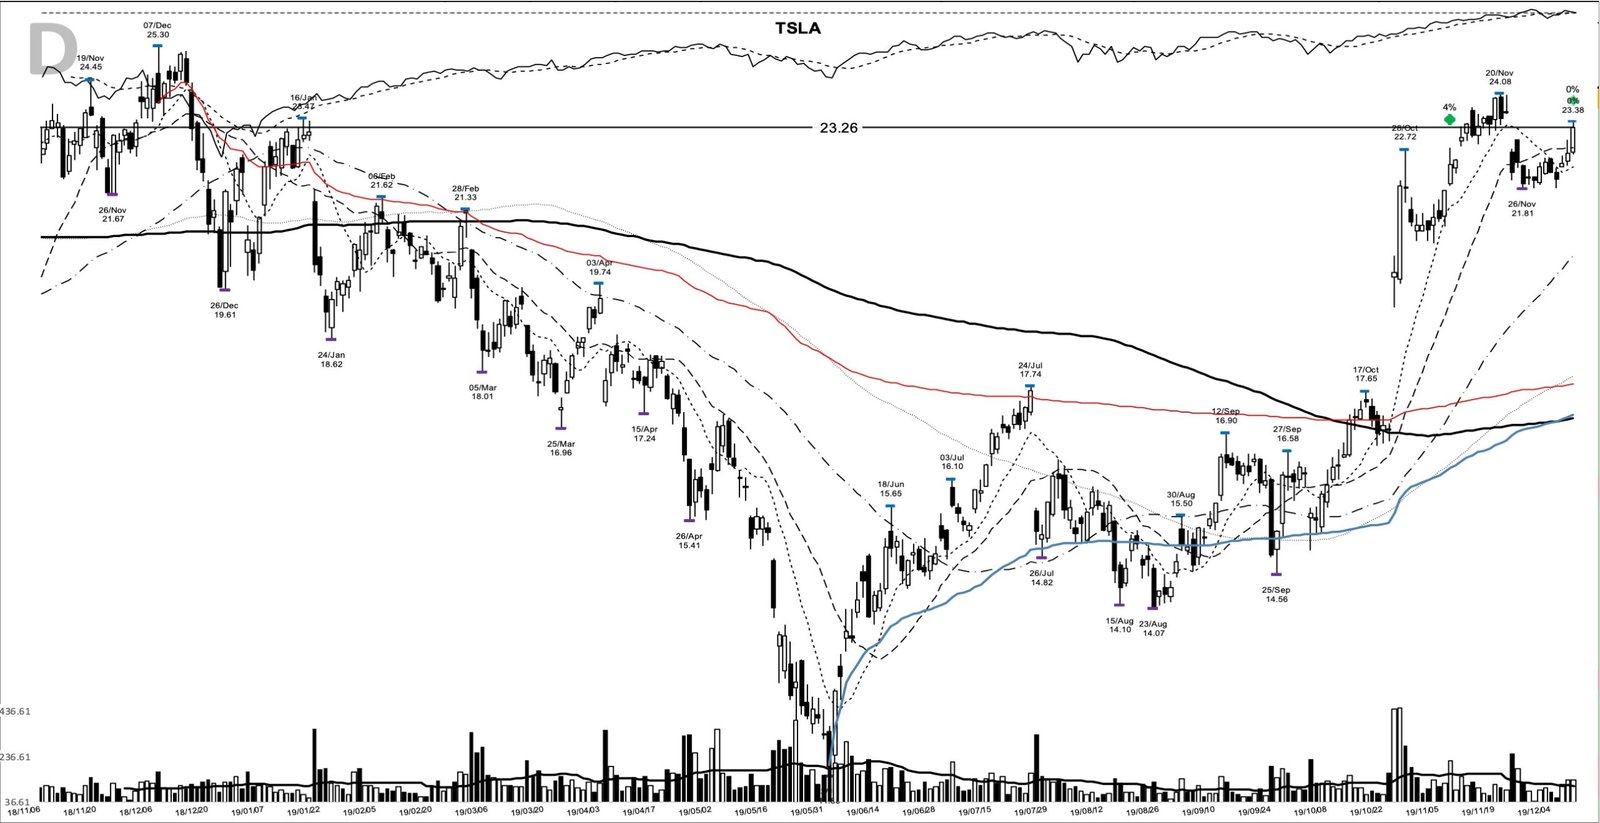
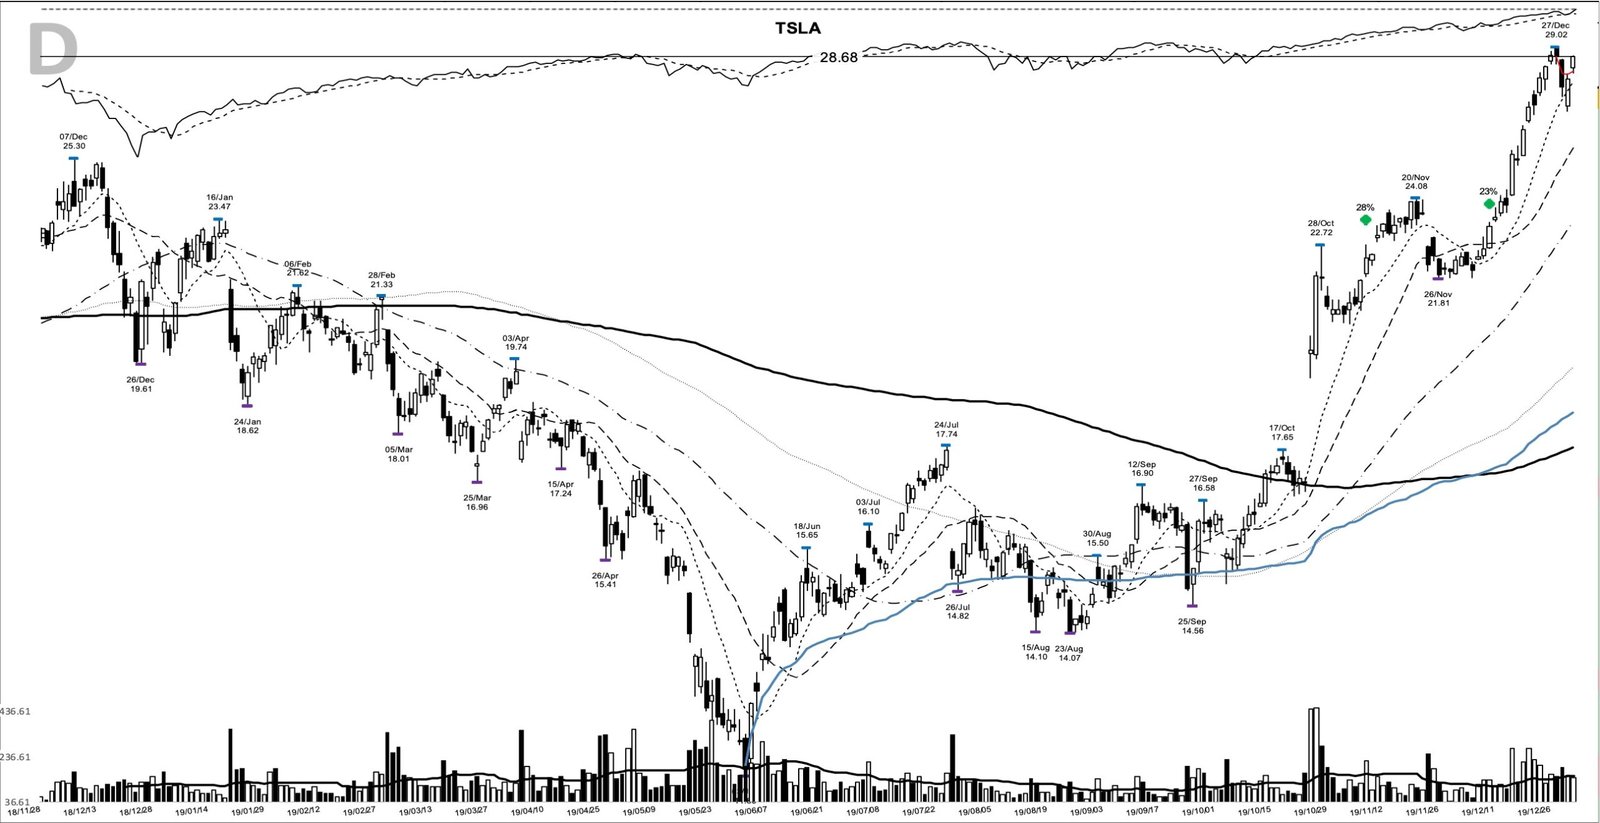
What investors argued about was execution. The Shanghai plant had broken ground only that January and was already running ahead of schedule, with the first China-built Model 3 deliveries due in December. The chart offered its first add on 10 December at a 23.26 close, up 4% and holding its rising averages, then another on 2 January 2020 at 28.68 as the advance widened out.
The tape in late 2019 rewarded fresh breakouts
Context helped. Through late October and November 2019 the S&P 500 and Nasdaq were printing record closes, the Federal Reserve had cut rates three times that year, and optimism about a phase-one US-China trade deal was lifting the broad market. A fresh breakout has an easier job when the index behind it makes new highs, and this one did.
Breadth was widening as the indexes climbed, with more stocks reaching new highs alongside them. That participation is what keeps a trend follower offensive until an actual sell signal shows up, and it is why a stock just clearing a long base had the odds with it that week. The caution that crept in over the following weeks was aimed at positions already extended, not at fresh breakouts out of long bases. That is the group the 7 November bar belonged to.
Reading the setup before the 22.72 pivot gave way
The setup was watchable well before it triggered. Into the pivot, Tesla had closed above its 10-day moving average for eleven straight sessions. On the entry day the 22.37 close sat about 4.5% above that 10-day line, itself at 21.41, above the 20-day at 19.39, above the 50-day at 17.24. Short over medium over long, all turning up, is a base that has flipped into an uptrend.
From there the plan writes itself in the levels. A trader could have set the trigger just above the 22.72 pivot, placed the initial stop below the 20.62 shelf low of 4 November, and treated a close back under the 11.80 base low as proof the idea had failed. Once price was clearly advancing, the working stop trails the 10-day line, then widens to the 20-day when the move is well extended, so a normal pullback does not shake you out while a real trend change still does. That two-layer trail is the mechanical heart of trend following.
From the breakout to the February 2020 top
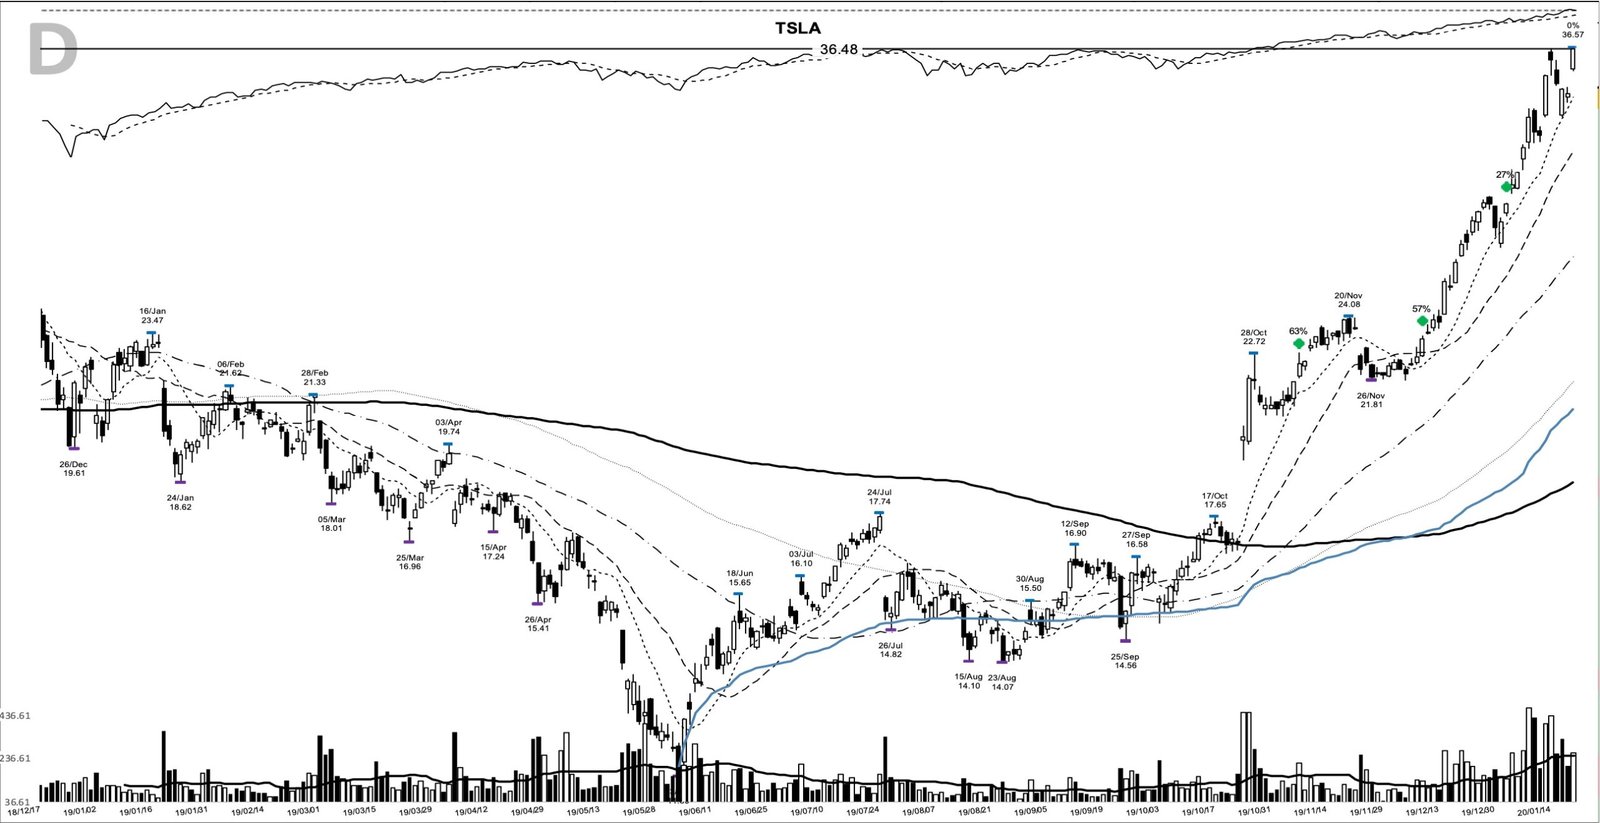
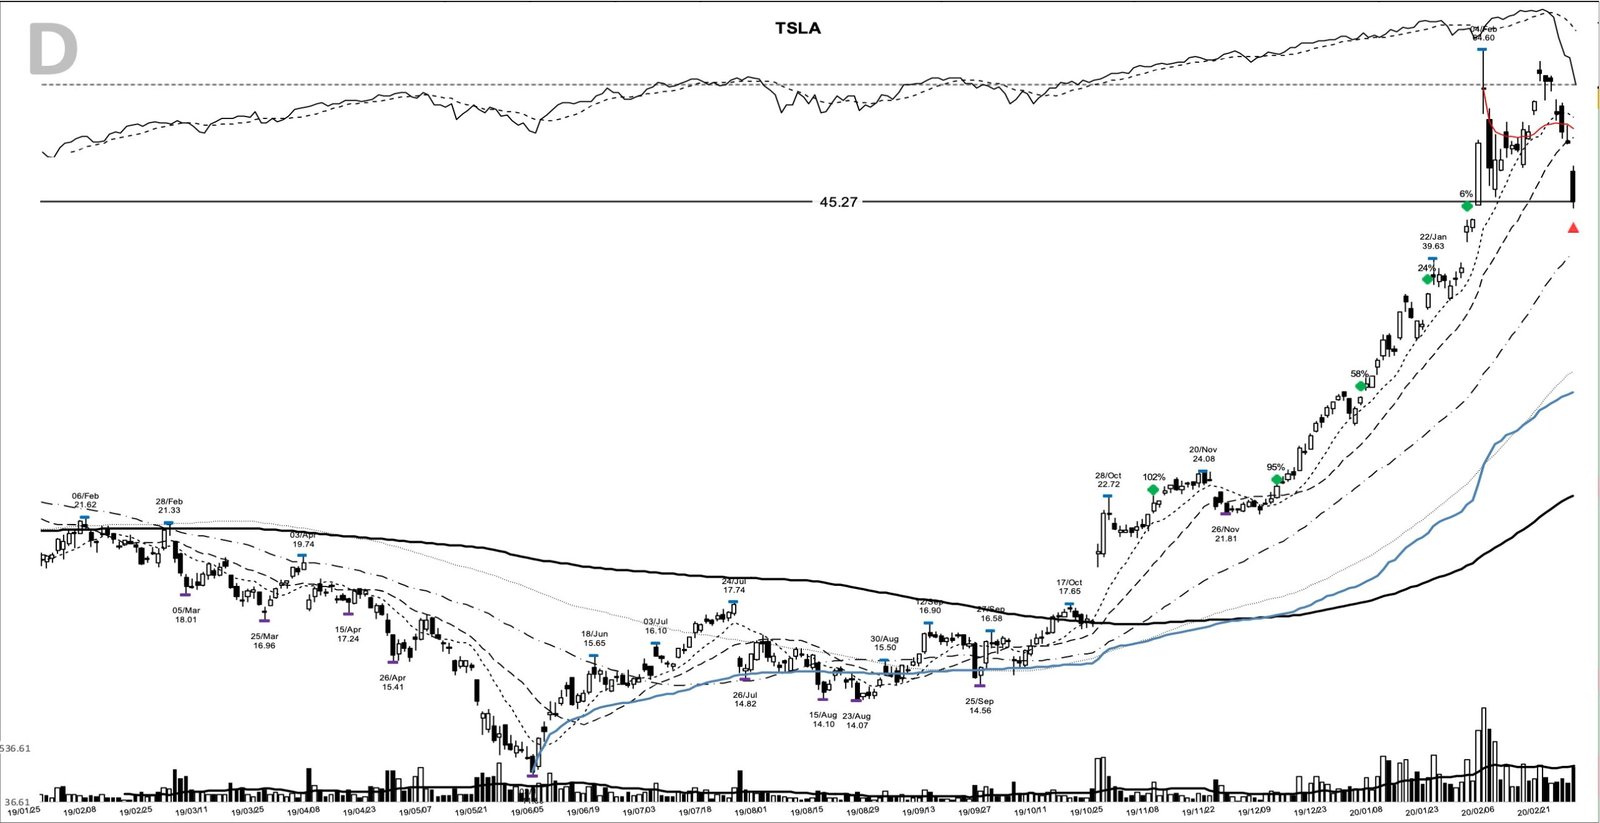
Through January 2020 each higher shelf offered a fresh add point rather than a reason to sell, and by 30 January the close was 42.72, up 91% from the entry in under three months.
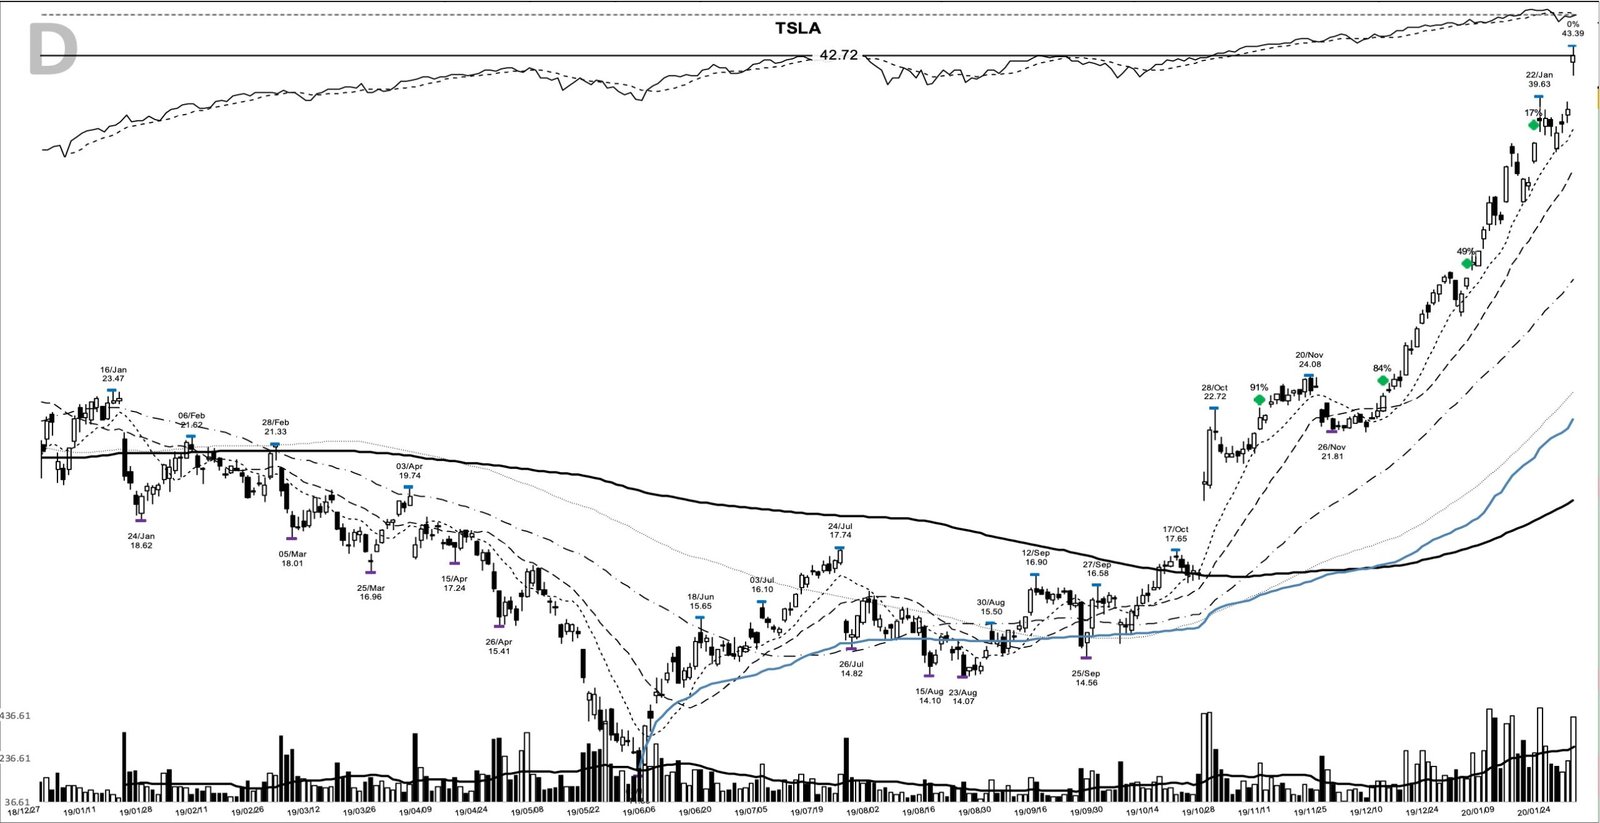
The archive marks a sell on 27 February 2020 at 45.27, up 102% from the 22.37 entry close, right as the pre-COVID top rolled over. That is a study in taking money off a vertical move into obvious weakness, just before one of the fastest crashes on record.
The COVID reset and the trend’s second leg
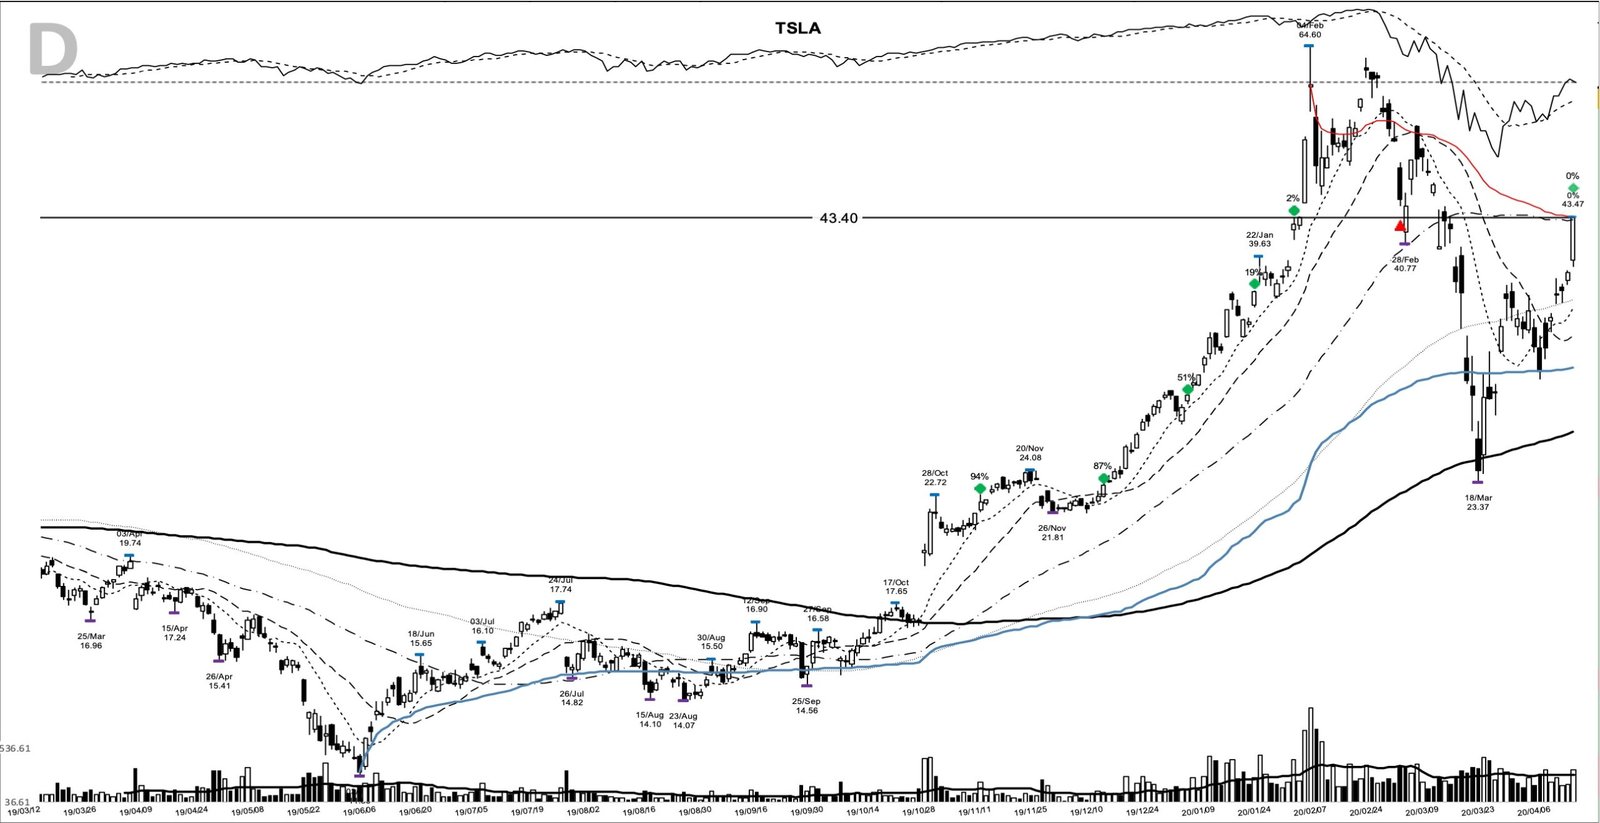
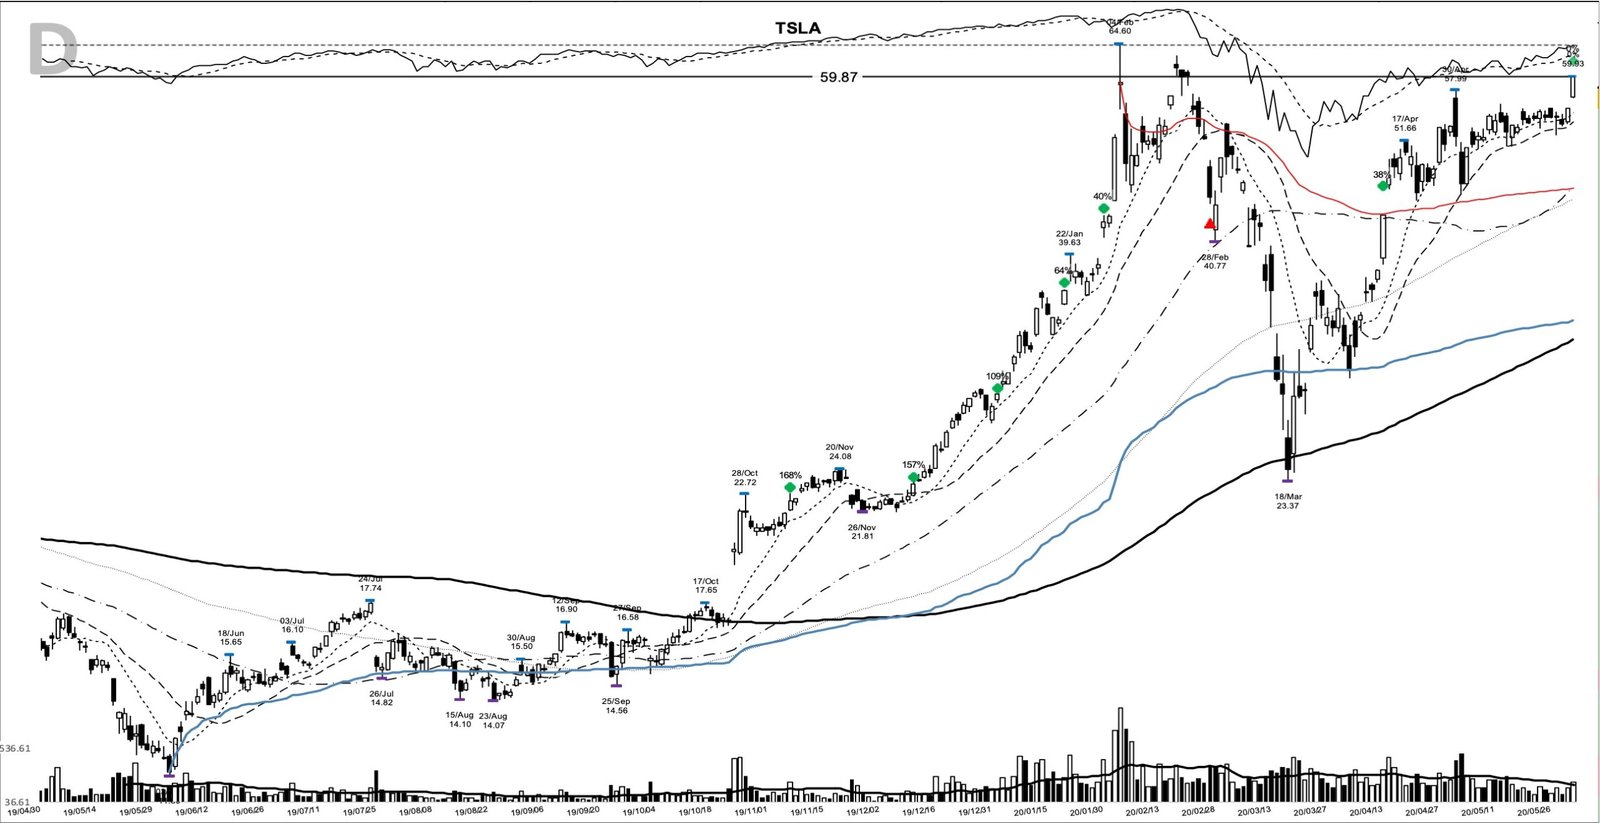
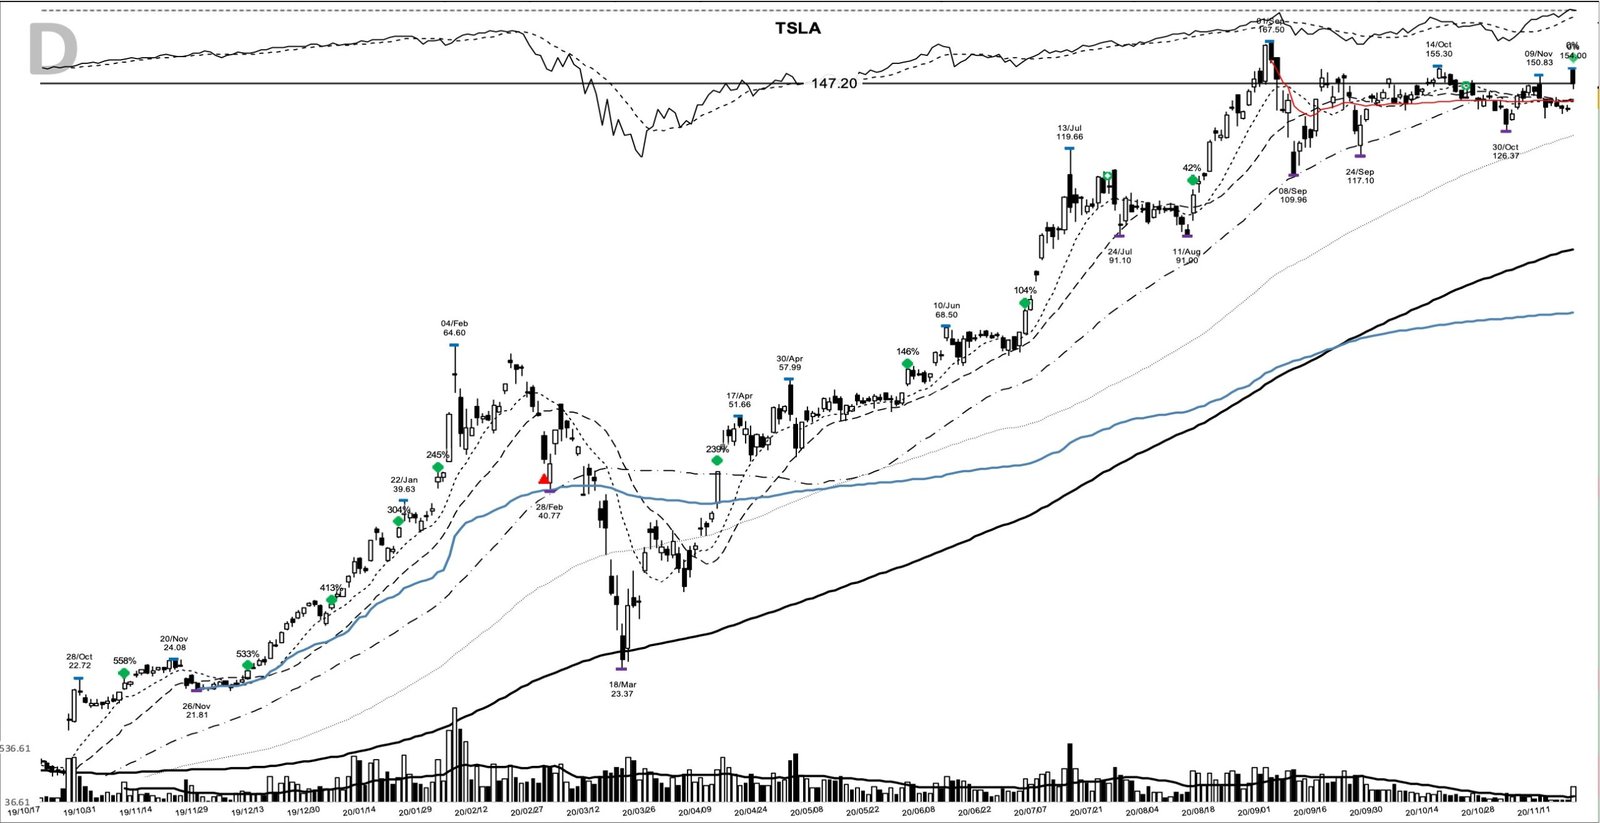
The crash did not spare the leader. From a 64.60 high on 4 February, Tesla fell to a 23.37 low on 18 March, a drawdown near 64% in six weeks. Anyone who bought the February top and held straight through learned what a leading stock does in a panic: it falls about as hard as everything else. The trend then reasserted itself almost as fast as it had broken. By 13 April price had reclaimed its rising averages near a 43.40 close, with a follow-on on 1 June at 59.87 as it cleared the pre-crash range.
The run into the S&P 500 and the exit
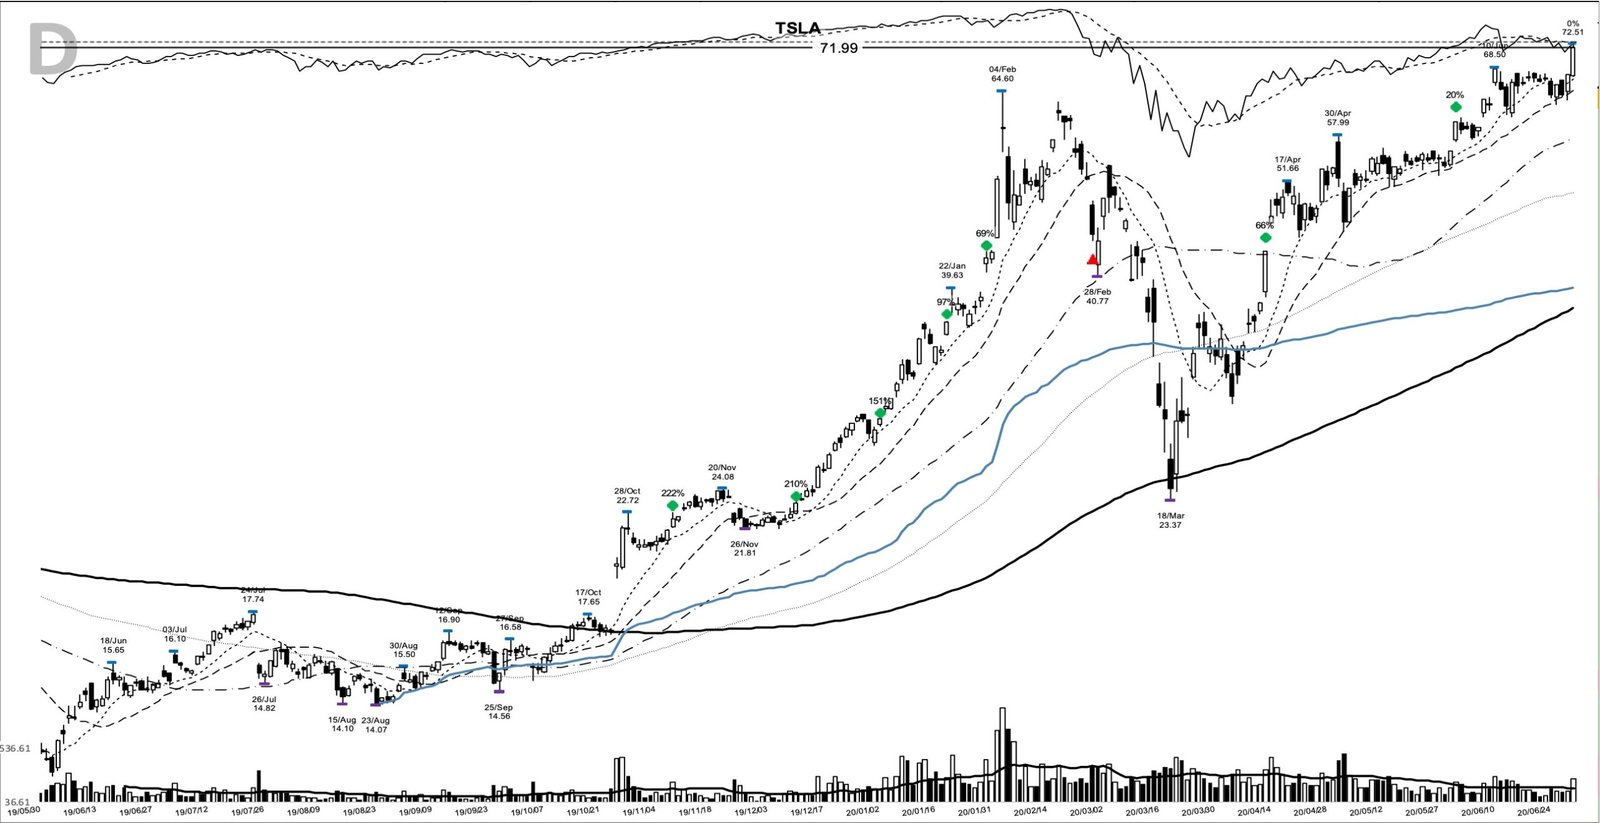
The second half of 2020 is where earlier size turned into real money. By 12 August the close was 103.65, up 363% from the entry. After the close on 16 November, S&P Dow Jones Indices announced Tesla would join the S&P 500 as the largest addition the index had ever made, effective before the open on 21 December. There was an opportunity to add near 147.20 the very next session, and a final one at 231.59 on 30 December as index funds prepared to buy.
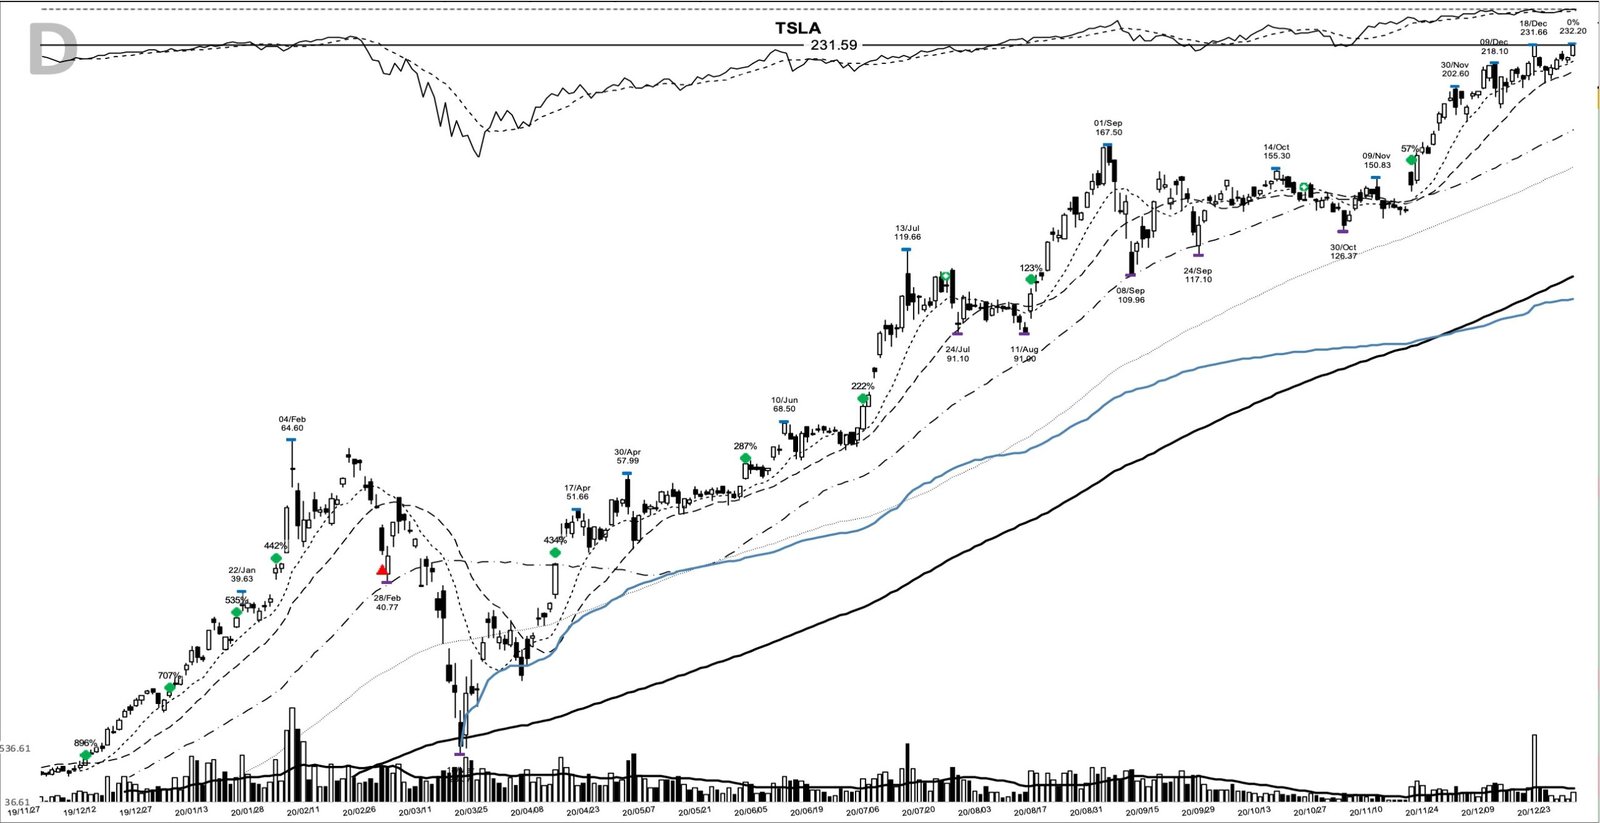
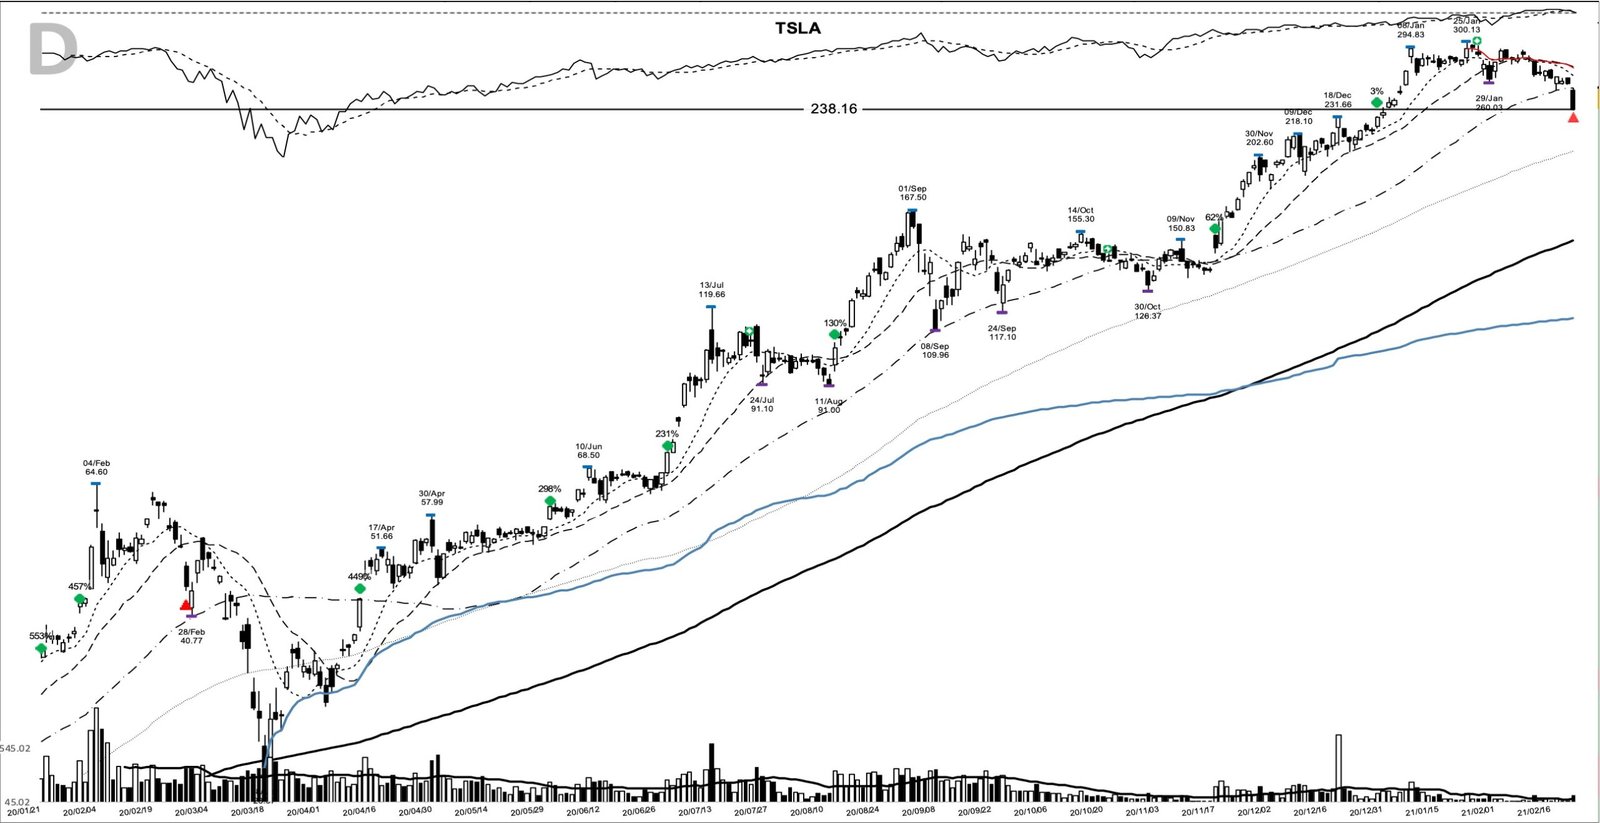
Price peaked at 300.13 on 25 January 2021, over thirteen times the entry at its intraday high. The exit came on 22 February 2021 at 238.16, closing the studied move 964.7% above the 22.37 entry close over 473 calendar days. On that arithmetic, 1,000 dollars riding the full move would have become about 10,600 dollars.
The tape the exit printed into is the other half of why selling made sense. By late February 2021 the leadership that had carried the advance was cracking: growth stocks took a sharp, violent selloff and bounced, former leaders gapped down hard even as the broad indexes held their ground, and distribution was piling up beneath a calm-looking surface. Selling a winner of this size into that is the trailing stop earning its keep, because a trend tends to break first in its leaders, well before the index itself rolls over.
What the TSLA base breakout never promised
The clean summary hides how uncomfortable the trade was to hold, and that discomfort is the part worth studying. Within three weeks of the pivot, price ran to a 24.08 high on 20 November, then pulled straight back to close at 21.93 on 26 November, briefly under the 22.37 entry. A trader anchored to the entry close would have felt stopped out; one anchored to the 20.62 shelf had no reason to move.
The pattern never promised a straight line or a tagged top. The 64% COVID drawdown sat right in the middle of the hold, and the 300.13 peak was 26% above where the exit actually printed at 238.16. Chasing the exact high is a losing game, and a trailing-stop trend follower gives back that last leg by design while keeping the far larger gain before it. The other trap is buying extended: every add above worked because it came on a controlled pullback to a rising average, not on a vertical spike.
Learn the setup, then let the trend do the work
The number that gets attention is the 965%. The number that teaches is the 1.4 times average volume on an otherwise ordinary bar at 22.37, because that is the day the decision got made and the risk got defined. Everything after was the trend doing its work while a stop rode up behind it. Learn the pattern. Ride the trend. Keep the gains.
Related studies: the base-to-uptrend transition that set this up is the subject of Weinstein stage analysis, and the participation clues that show up before a pivot fails are covered in reading volume. A new winner study lands here most evenings.
Price and volume figures are computed from split-adjusted daily OHLCV data; company figures come from SEC filings where cited.
Educational content only. Not investment advice. Trading involves risk. You are responsible for your decisions.
Get the free Market Wisdom e-book
Join Trends and Breakouts — historical winners, breakout studies, and risk lessons. No spam, unsubscribe anytime.