MARA is back near the top of the trending lists this week, and when a Bitcoin miner shows up on the movers again it’s worth pulling up the chart that made its name. This MARA base breakout is a trade from my study archive: an entry on 8 October 2020, as Marathon turned up out of a long base right as Bitcoin began its Q4 2020 run, a setup that went on to gain 1561% over 193 calendar days before the exit closed in April 2021.
The detail worth studying is the entry bar itself. The entry printed a close of 2.14 on 8 October 2020, still under the 2.33 pivot that had capped the prior month, but on volume running 4.6 times the 20-day average.
The MARA base breakout in five key takeaways
- The pattern was a base breakout off a long 2020 base, with the entry on 8 October 2020 at a close of 2.14, on volume 4.6 times the 20-day average.
- The realized move ran +1561.2% from that entry to an exit close of 35.55 on 19 April 2021, a hold of 193 calendar days.
- The 2.33 pivot from 16 September was the overhead level to clear; it gave way on a closing basis two sessions after the entry.
- The study marks four add points as the trend extended, from 3.10 in November to 5.54 in December and 13.59 and 19.90 in January.
- The run peaked at 57.75 on 6 April 2021 as Bitcoin’s rally stalled, then rolled back into the exit within two weeks.
The MARA trade at a glance
| Field | Value |
|---|---|
| Ticker | MARA |
| Study entry date (intraday pivot test) | 8 October 2020 |
| Entry close | 2.14 |
| Pivot | 2.33 |
| Pivot cleared | 12 October 2020 at a close of 2.42 |
| Volume vs 20-day average | 4.6x |
| Exit date | 19 April 2021 |
| Exit close | 35.55 |
| Gain | +1561.2% |
| Calendar days | 193 |
| Peak before exit | 57.75 (6 April 2021) |
How MARA tested the 2.33 pivot on 4.6x volume
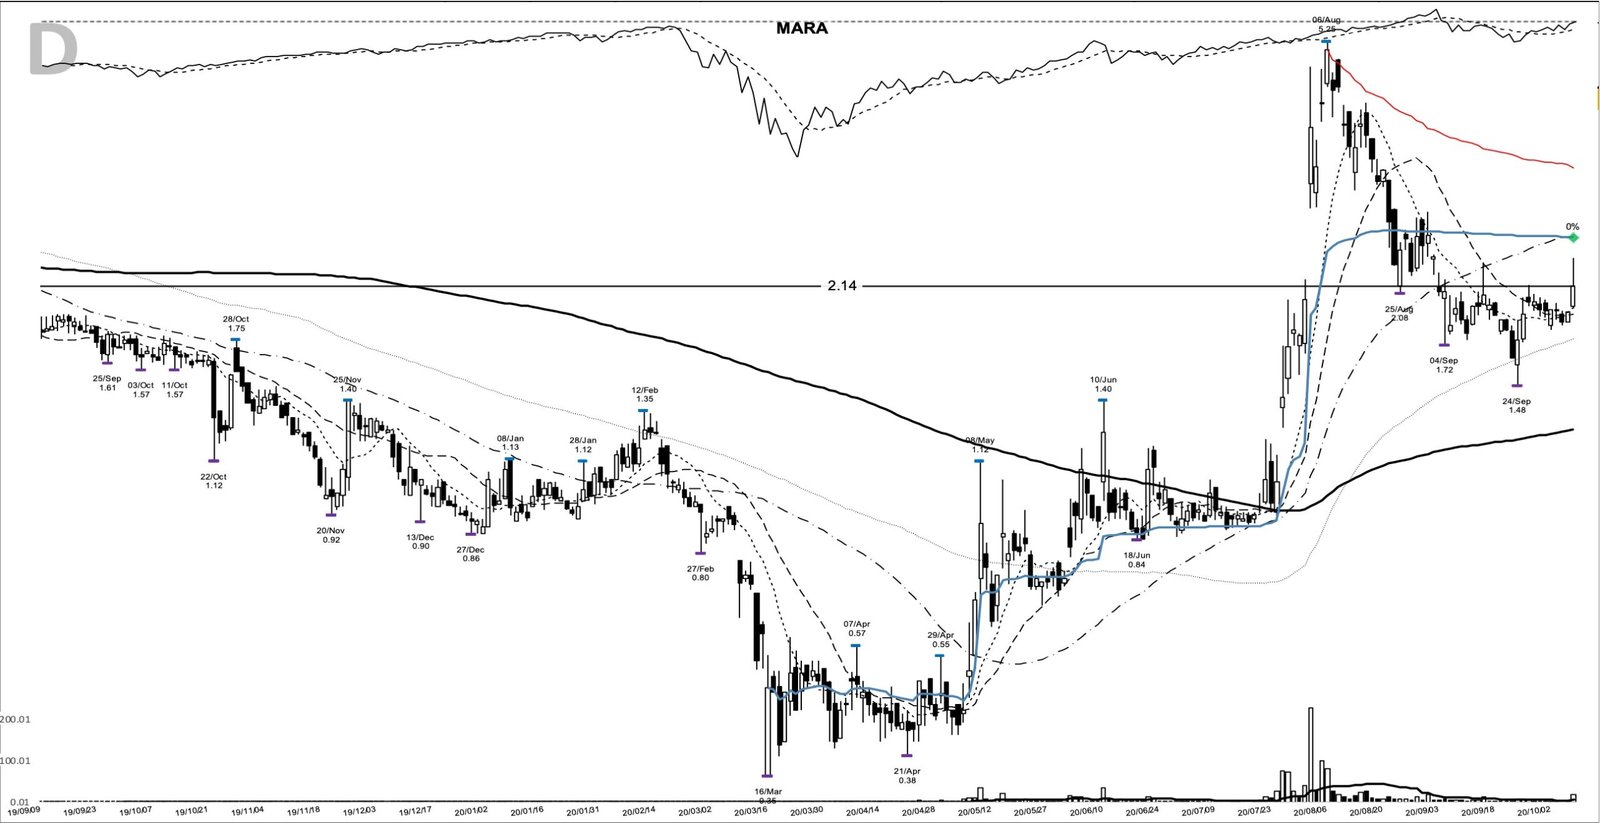
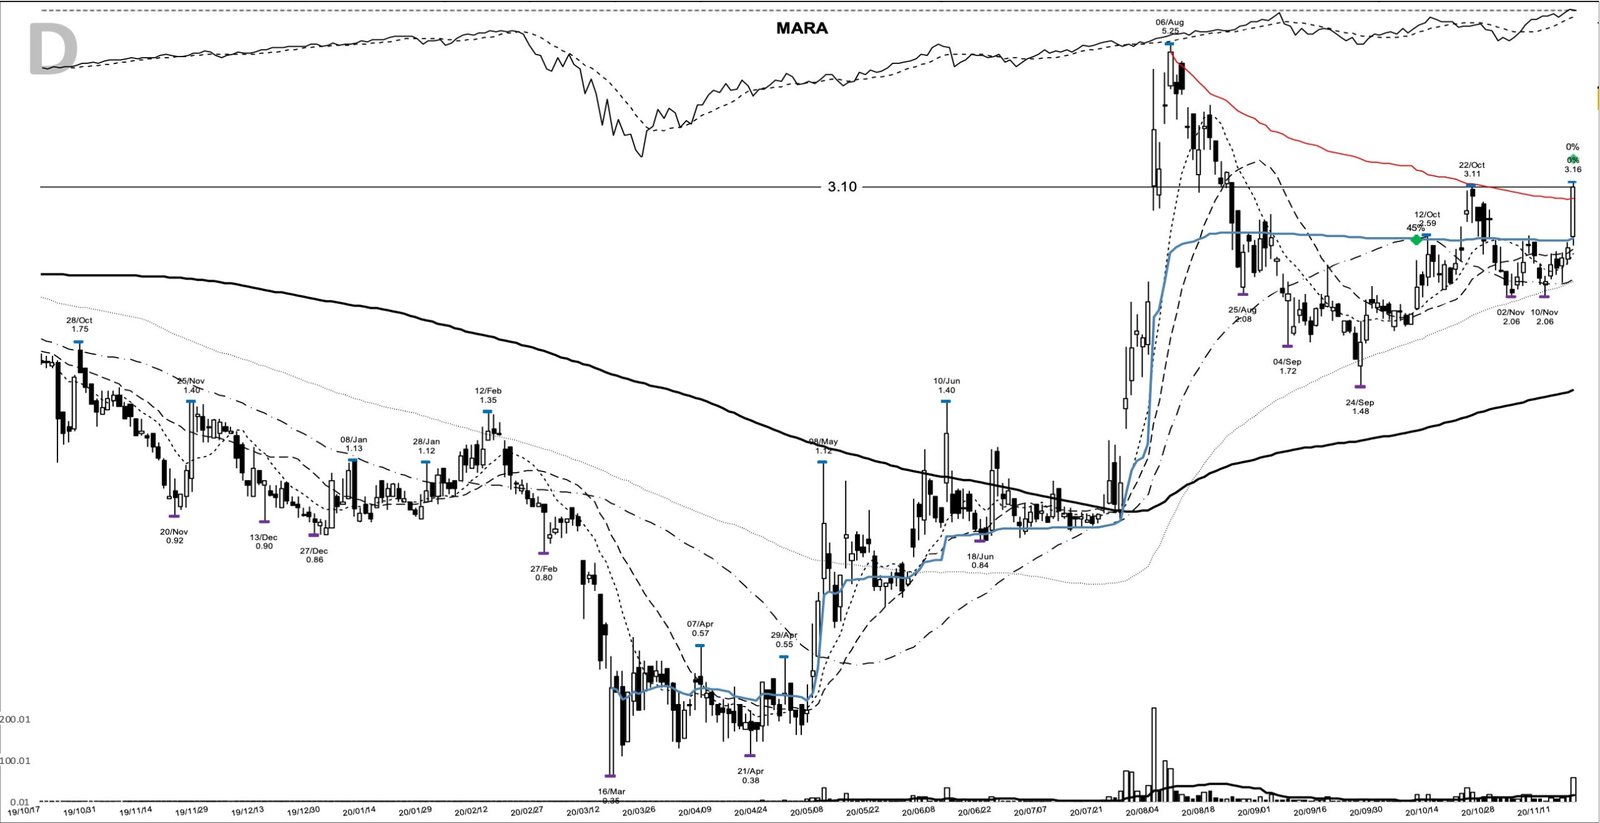
Start with the base. MARA had bottomed at a 52-week low of 0.35 in March 2020, then spiked to 5.25 by 6 August as the first wave of Bitcoin-miner interest hit the tape. It pulled back and spent September building a shelf between a 1.48 low on 24 September and the 2.81 high from the start of the month. The most recent swing high in that range, 2.33 on 16 September, became the pivot to clear.
The entry came on 8 October, an up day that opened at 1.98, ran to a high of 2.37, and closed at 2.14, up more than 10% on the session. The tell was turnover: 18.8 million shares against a 20-day average near 4.08 million, about 4.6 times normal. Buyers pushed price through the 2.33 pivot intraday, then let it settle back under the line.
That close under the pivot is the honest detail. By the study’s own classification this was an intraday pivot test: the 8 October bar tagged the 2.33 pivot intraday, then closed at 2.14 back below it, an early turn off the 1.82 shelf on heavy volume, so the marked entry preceded the pivot clearance. The pivot gave way on a closing basis two sessions later, at 2.42 on 12 October, and by 21 October the stock had expanded to a close of 2.84 on rising turnover. That is the volume signature worth reading: the volume of the breakout candle showed buyers had arrived before the pivot was formally taken.
Marathon in October 2020: a patent shell becoming a Bitcoin miner
The business behind the chart is the part that surprises people. Marathon Patent Group, as it was still called in October 2020, was a small company remaking itself from a patent-licensing shell into a Bitcoin mining operation. Reported quarterly revenue was tiny, in the hundreds of thousands of dollars, and the company was posting losses. There was no earnings acceleration to point to, which separates this chart from a classic CANSLIM leader.
What Marathon had instead was a theme and a build-out. Through the second half of 2020 it ordered Bitcoin miners in bulk: an additional 10,000 Antminer S-19 Pro machines from Bitmain announced on 26 October 2020, a joint venture with Beowulf Energy for a low-cost data center in Hardin, Montana, and by late December an order for 70,000 more miners for about 170 million dollars. It renamed itself Marathon Digital Holdings, effective 1 March 2021. The chart ran on the Bitcoin thesis and the mining-capacity story, not on the income statement.
The backdrop: Bitcoin’s Q4 2020 bull run
No miner runs fifteen-fold on its own, and the fuel here was Bitcoin. The coin traded near 10,600 dollars at the start of October 2020 and closed the month near 13,800, the first leg of a run that reached roughly 29,000 by year-end and past 64,000 by mid-April 2021. A miner is a geared bet on that price, and MARA ran far harder than the coin itself.
The stock market’s own posture in early October was more tentative than the coin’s. The averages had just returned to an uptrend on a borderline signal, the kind that says put some money to work and let the trades themselves prove whether exposure deserves to grow. An entry risking a few percent to a nearby shelf fit that tape far better than any extended chase.
The timing at the top rhymed too. MARA topped on 6 April at 57.75, about a week before Bitcoin’s own mid-April high, the week Coinbase listed. The proxy turned first.
Spotting MARA before the 2.33 pivot gave way
The repeatable part was visible before the breakout confirmed. Into the 8 October entry, the short-term trend had turned up: price had closed above its 10-day moving average, near 1.98, for a second straight session, about 8.1% above the line, and reclaimed the 20-day near 1.93. The 50-day near 2.56 was still overhead, so this was an early-stage turn, not a stock already trending cleanly.
The structural anchors were clean: the 6-month base low at 0.38 from 21 April, the base high at 5.25 from 6 August, the 2.33 pivot from 16 September as the overhead line, and the 1.82 shelf from 2 October as the recent floor. A washed-out micro-cap recovering the right side of a deep base, holding a higher low above a shelf, with one line to take overhead and a live theme behind it, is a watchlist candidate before it moves. That early turn up off the base is the Weinstein stage-two setup in miniature.
From there a disciplined plan could have been written that morning. A trend follower might have entered on a move up through the 2.33 pivot, set the initial stop below the 1.82 shelf, or wider, below the 0.38 base low where the structure fails, then trailed the 10-day moving average, widening to the 20-day once the move was well advanced. That is a mechanical trend-following template. The buy at 2.14 was an aggressive early entry off the shelf, ahead of the pivot, while the patient plan waited for the 2.33 pivot to close green, which it did on 12 October.
How MARA ran from 2.14 toward 58
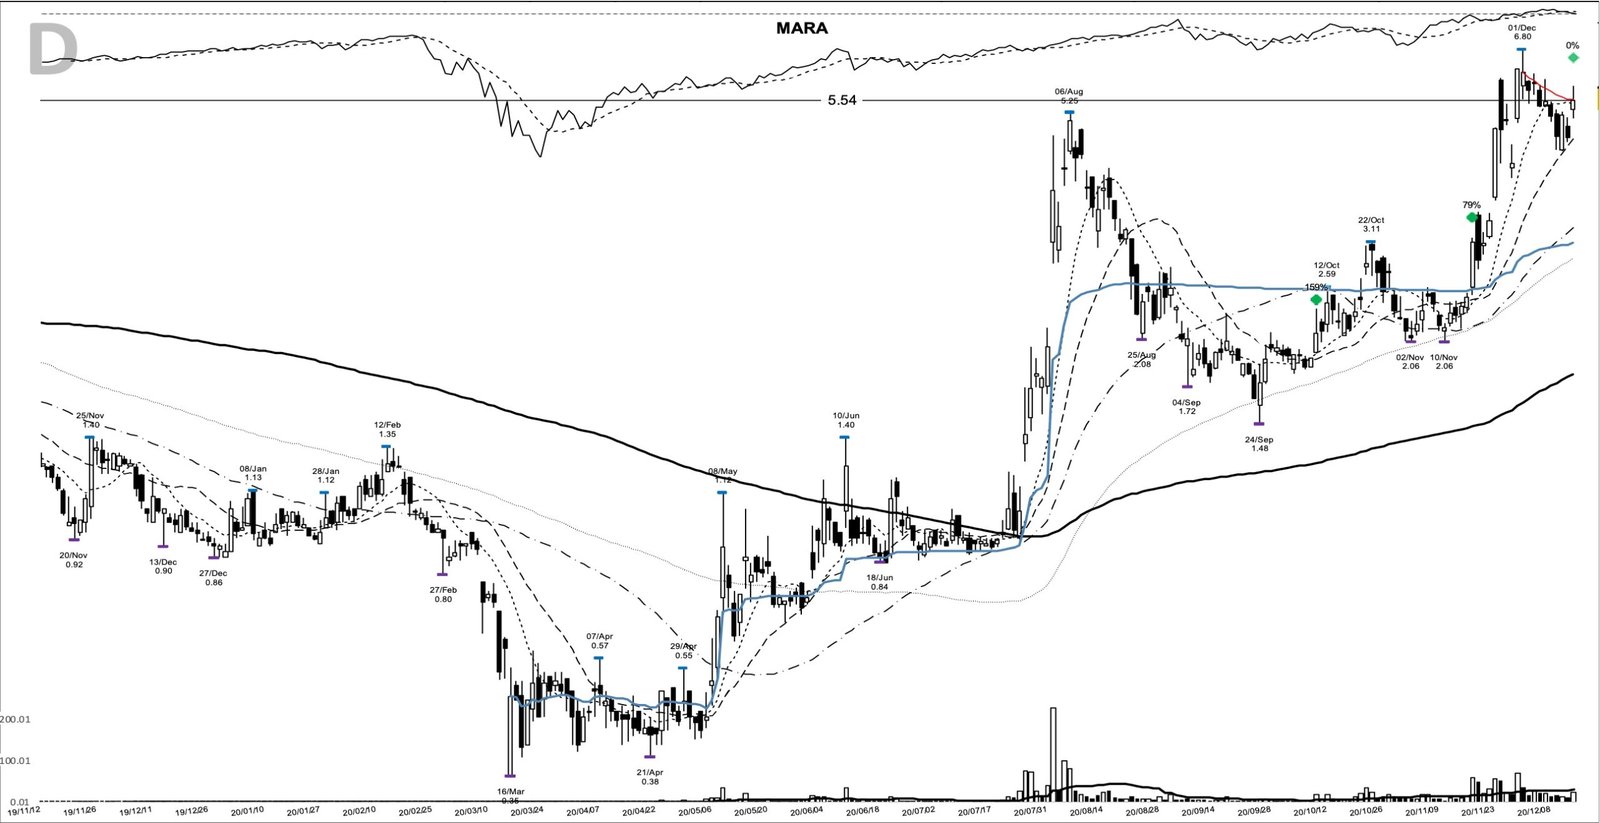
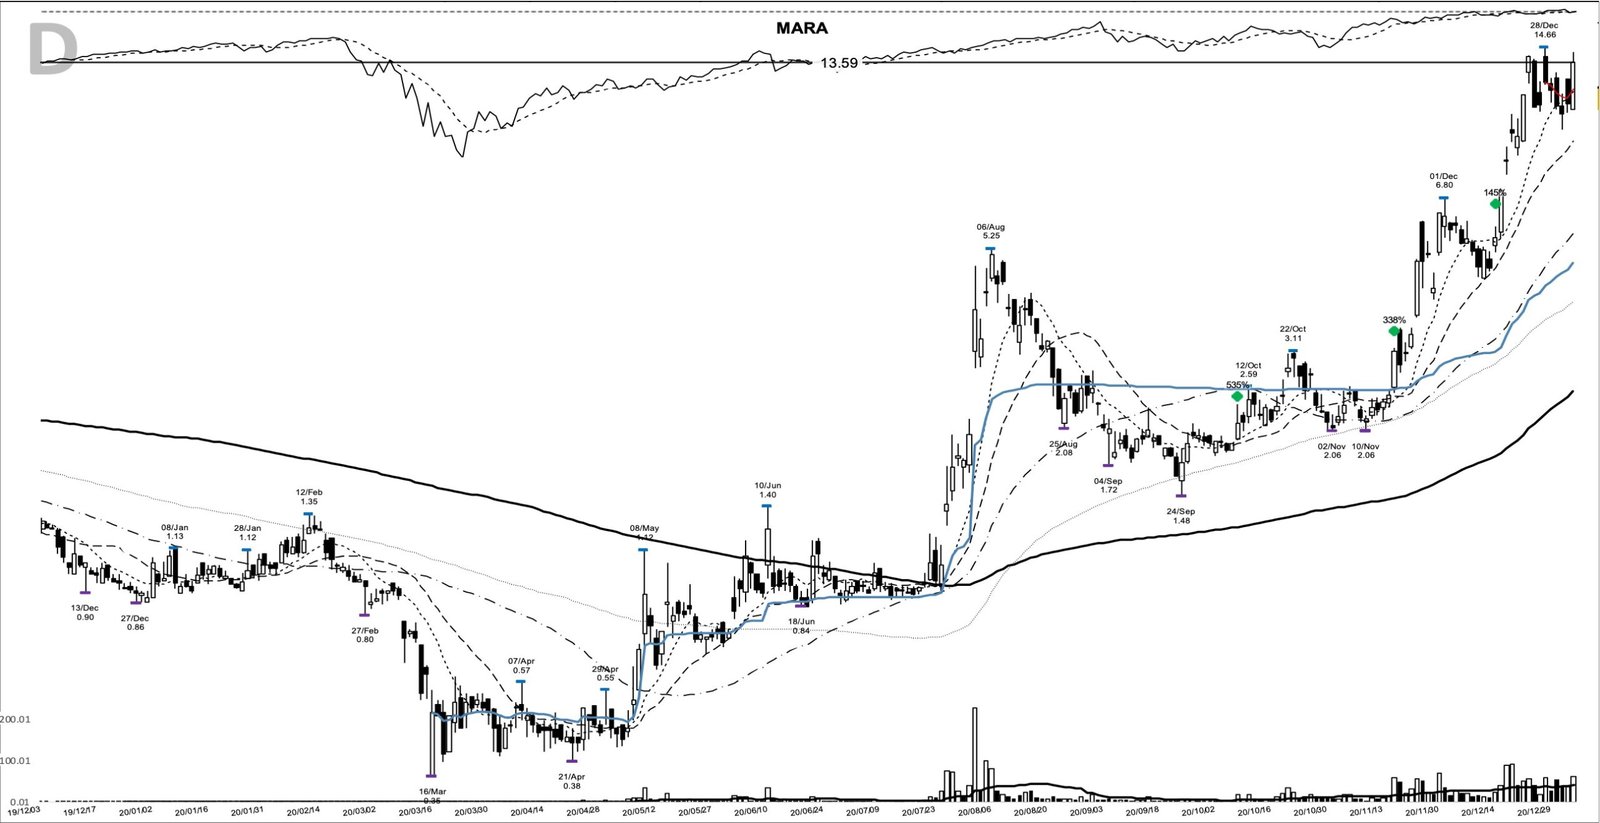
Once the pivot cleared, the trend did the work. A trader using this pattern might have watched the higher lows and the widening gap above the moving averages as the signal to keep holding, and there was an opportunity to add as the base breakout extended. The study marks four such points: a close of 3.10 on 17 November, up about 45% from the entry, then 5.54 on 14 December, 13.59 on 5 January, and 19.90 on 28 January, each a continuation higher rather than a fresh base.
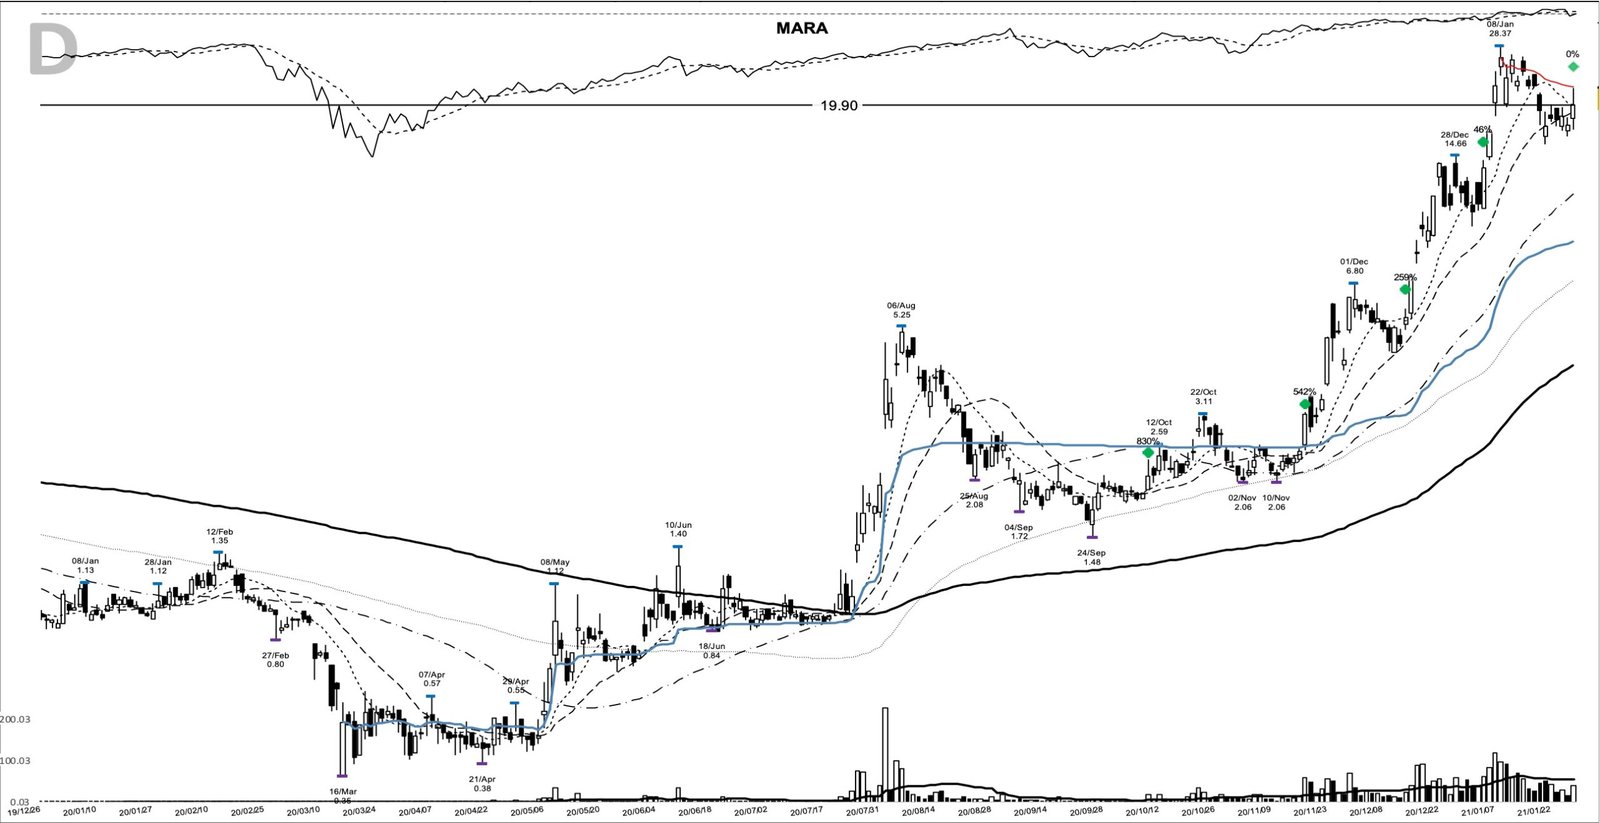
The move went vertical into 2021 and peaked at 57.75 on 6 April, a maximum gain of about 2599% from the entry. Then Bitcoin’s rally stalled and the stock rolled over. The exit marker closed the move at 35.55 on 19 April, still up 1561.2% from the 2.14 entry across 193 calendar days.
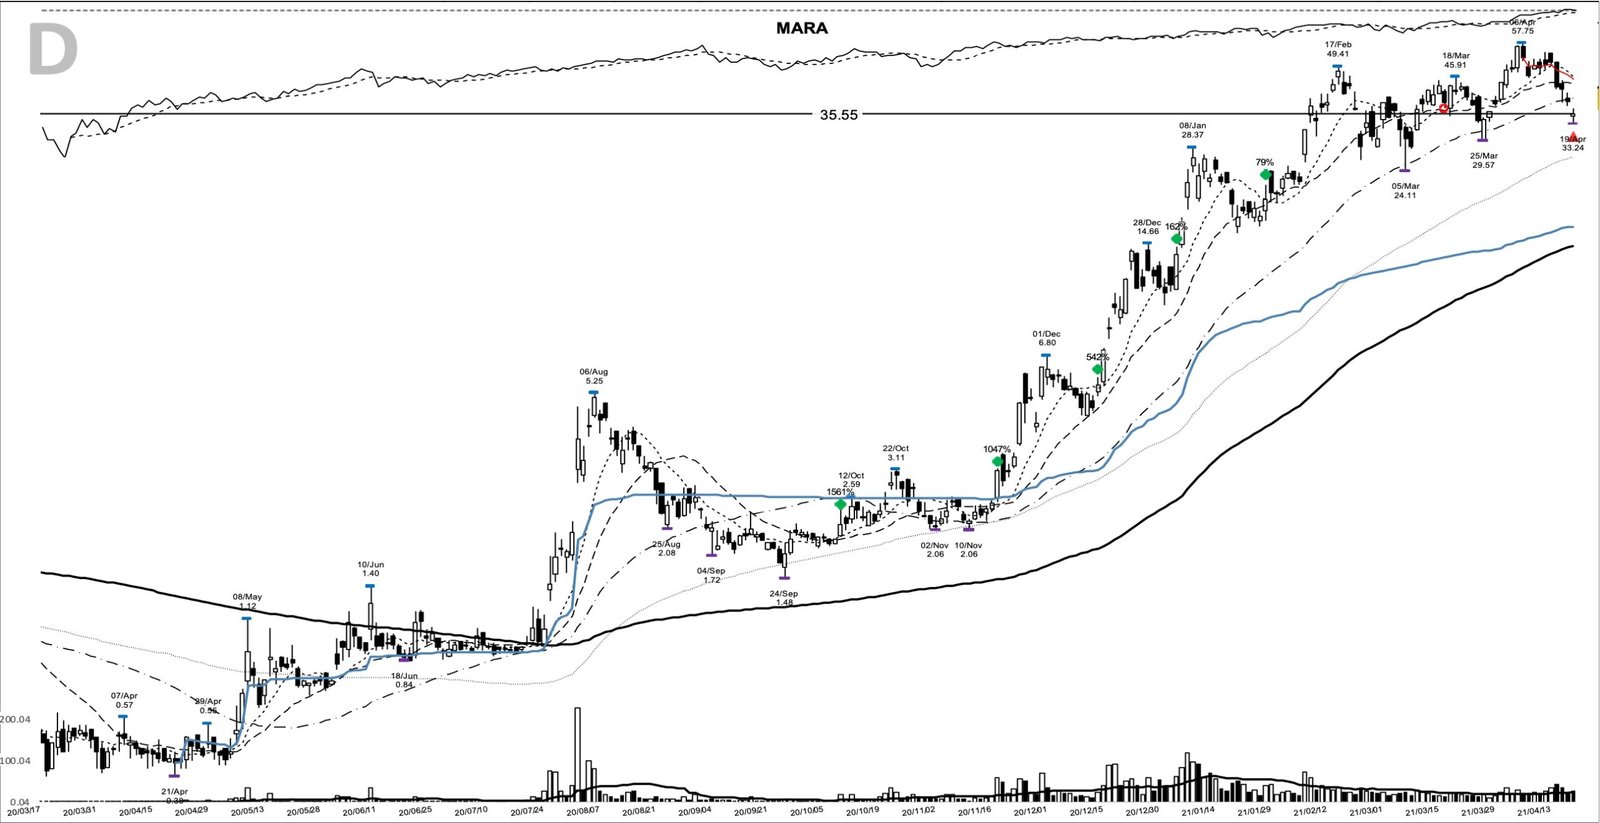
A thousand dollars riding the full move from the 2.14 close to the 35.55 close would have become about 16,600. The 57.75 peak to the 35.55 exit is the lesson: the exit sat roughly 38% below the high because it came after the top broke, not at it. Reacting to the first clean break rather than the exact high is what keeps a slice of a parabolic run.
The broader tape in mid-April 2021 made the same argument from the other side. The indexes still read as an uptrend, yet rotation had been chewing through growth names for weeks, and calm index charts were masking sell signals at the stock level. Exiting on MARA’s own break, rather than waiting for the averages to agree, is what that environment demanded.
Where this MARA breakout could have fooled you
The first trap is the pivot. The entry closed at 2.14, below the 2.33 pivot, so a trader who required a close above the pivot would have waited for 12 October, correctly. Reading the 2.14 close as a confirmed pivot-clear overstates the signal: it was an early turn off the 1.82 shelf, and the pivot didn’t close green until two sessions later.
The second trap is the screen. In October 2020 this looked like a broken micro-cap: price under its 50-day line, about 59% below its 52-week high of 5.25, sub-million-dollar quarterly revenue, and losses on the books. A trader screening for clean earnings leadership would have thrown it out. The driver here was an external theme, Bitcoin, and the pattern promised nothing about that theme lasting.
The third trap is the ending. The base breakout was an entry signal at 2.14, not a reason to hold forever. MARA ran to 57.75, then gave back nearly 40% into the exit within two weeks. Buying extended near 50 in early April, as Bitcoin’s rally was already stalling, put a trader in front of that reversal. And this was a proven violent mover: it had spiked to 5.25 and collapsed once before, in August 2020.
Reading the next base the way MARA set up
Strip out the Bitcoin drama and the mechanics are ordinary: a deep base off a washed-out low, a recovery up the right side, one clean pivot overhead, an early turn off a tight shelf, and a volume bar that announced the buyers before the pivot was formally taken. The move that followed was extraordinary and the fundamentals never justified it, yet the read that got a watchlist to the entry was plain chart structure. Learn the pattern. Ride the trend. Keep the gains.
Related studies: the base-and-breakout playbook runs through William O’Neil’s market-leader work, Weinstein stage analysis, and the volume signature of a breakout candle. A new winner study lands here most evenings.
Price and volume figures are computed from split-adjusted daily OHLCV data; company figures come from SEC filings where cited.
Educational content only. Not investment advice. Trading involves risk. You are responsible for your decisions.
Get the free Market Wisdom e-book
Join Trends and Breakouts — historical winners, breakout studies, and risk lessons. No spam, unsubscribe anytime.