GameStop is back near the top of the StockTwits trending list today, which is as good a reason as any to pull the one GME chart worth keeping. Long before the January 2021 headlines, GME printed a textbook GME base breakout at a split-adjusted 1.26 close on 21 August 2020, clearing a 1.22 pivot on more than three times its average volume. The business behind the ticker was shrinking, quarter after quarter. The chart did not care.
From that quiet breakout close, GME climbed to an intraday peak of 120.75 and the sell marker still closed the move 2292% above the entry, a 22-bagger held for 215 calendar days. These marked-up daily charts come from my study archive, and the point of the study is simple: a clean base breakout can hand you a life-changing trend even when earnings are going the wrong way, provided you add into strength and trail the position instead of guessing the top.
Key takeaways
- GME broke out of a long, deep base on 21 August 2020 at a 1.26 close, clearing the 1.22 pivot on volume 3.2 times its 20-day average.
- The breakout fired a week before the public catalyst: Ryan Cohen’s RC Ventures 13D landed on 28 August 2020, and the stock gapped to a 1.67 close on 31 August.
- Revenue was falling 26.7% year over year and quarterly EPS was negative, so this was a price, volume, and sentiment setup, not an earnings-growth story.
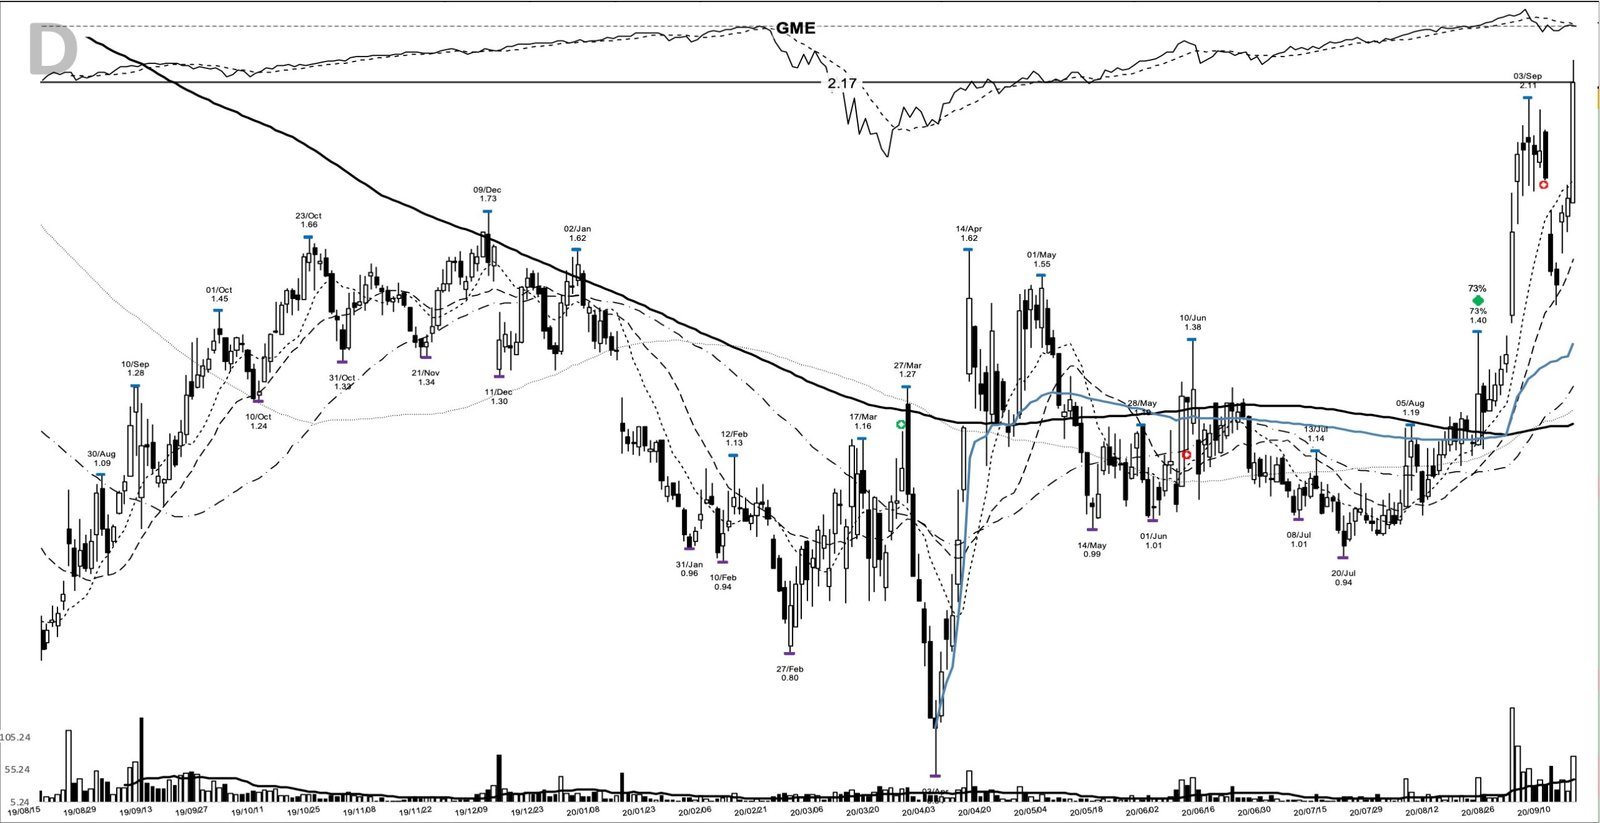
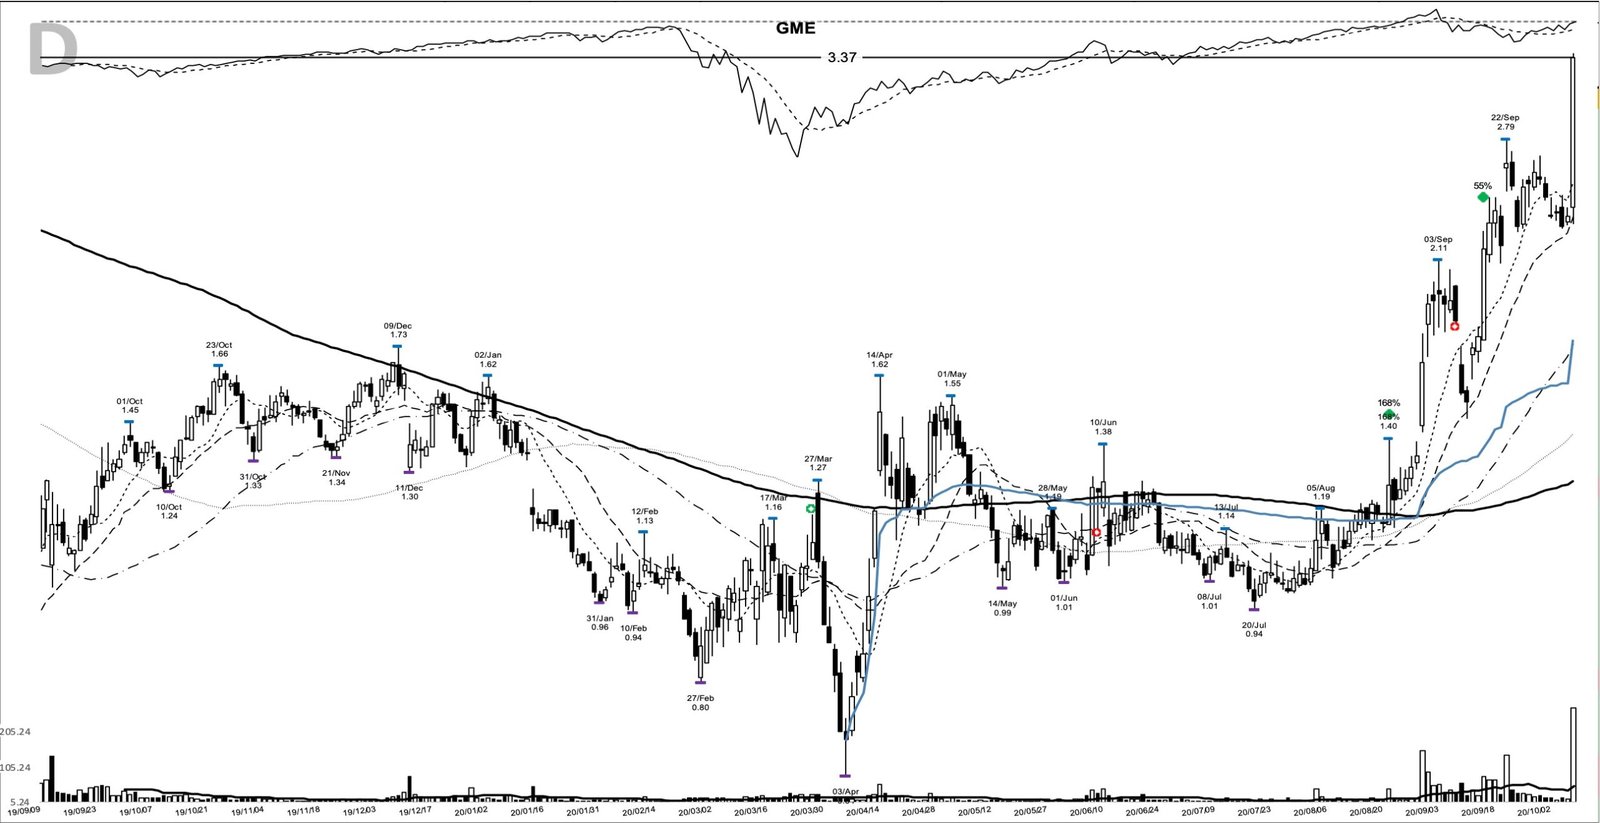
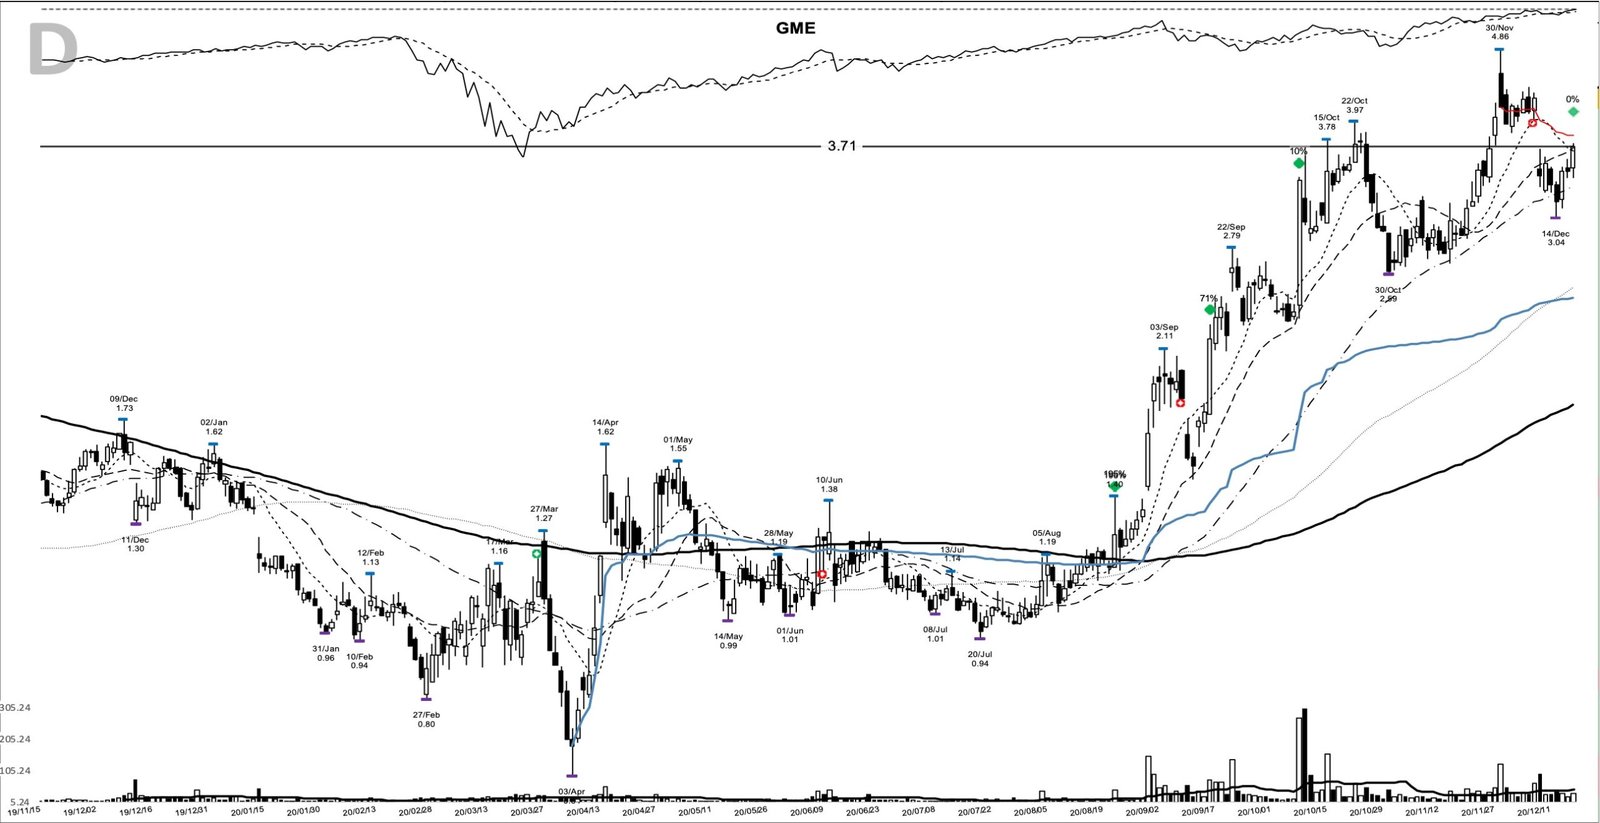
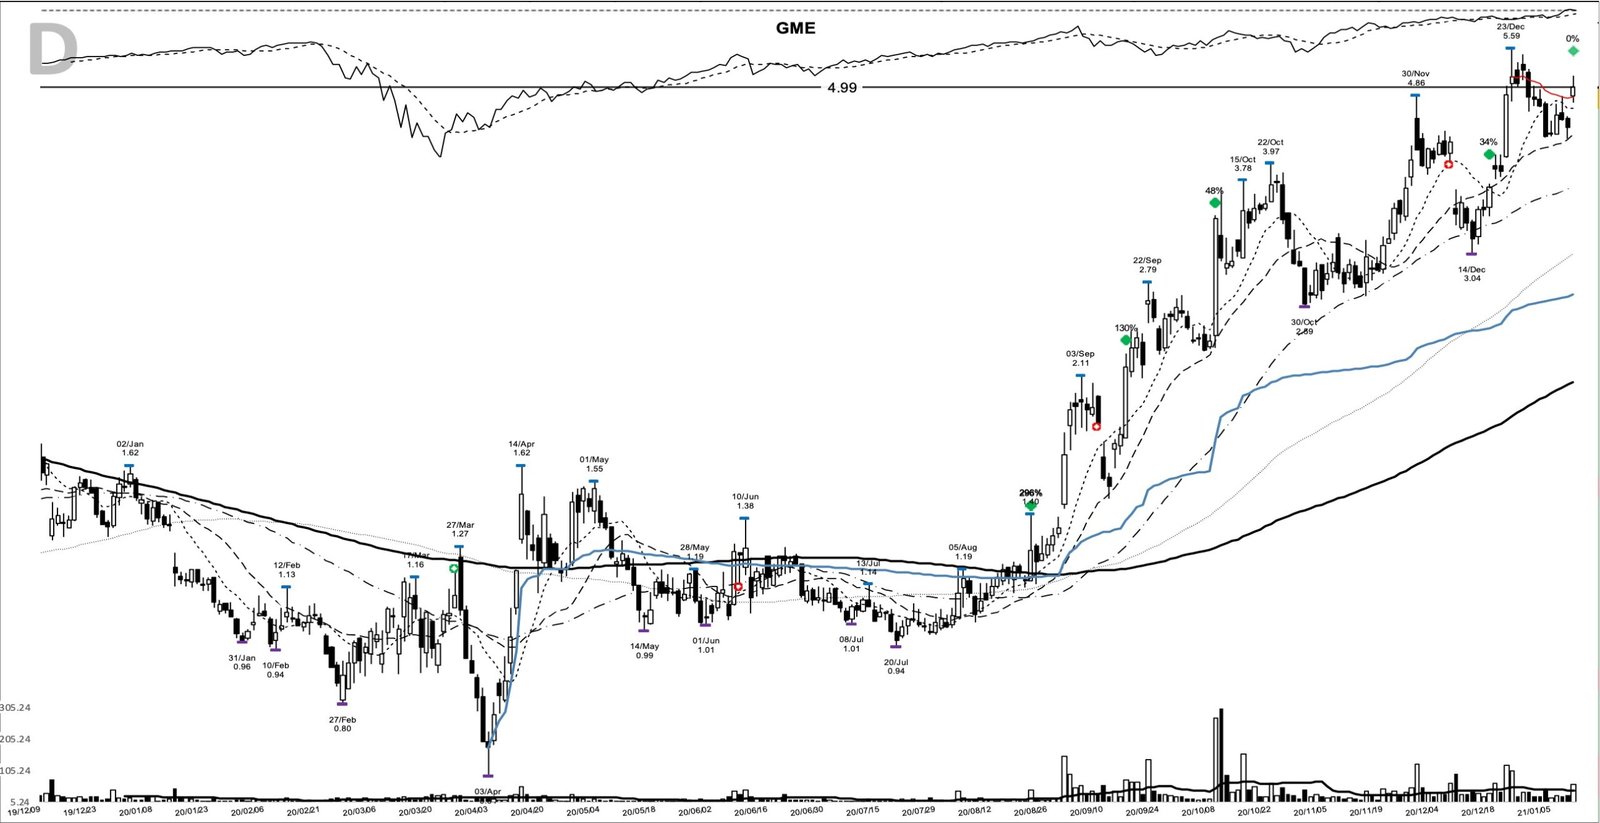
- Strength kept offering places to add, at 2.17, 3.37, 3.71, 4.99, and 22.93, each higher than the last.
- The exit at 30.09 on 24 March 2021 booked +2292%; across the full move, 1,000 dollars would have grown to about 23,924 dollars.
The GME trade at a glance
| Field | Value |
|---|---|
| Ticker | GME |
| Breakout date | 2020-08-21 |
| Breakout close = entry reference | 1.26 |
| Volume vs 20-day average | 3.2x |
| Exit date | 2021-03-24 |
| Exit close | 30.09 |
| Gain | 2292.4% |
| Calendar days held | 215 |
| Peak before exit | 120.75 (2021-01-28) |
How the GME base breakout formed on the chart
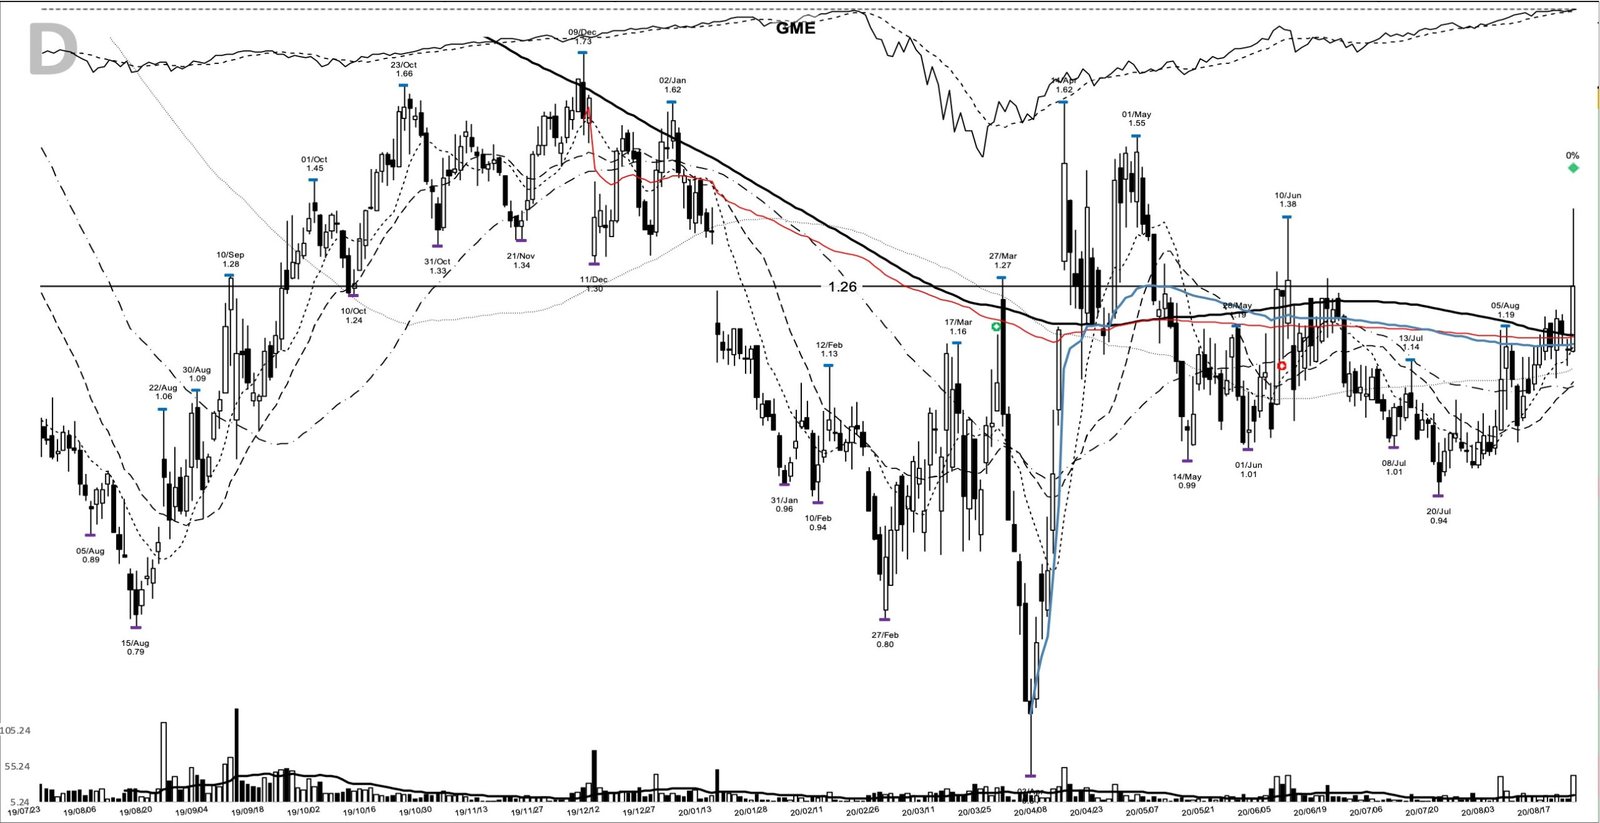
Read the base first. GME topped at 1.73 in December 2019, then ground lower for months and cracked to a 0.64 low on 3 April 2020 in the COVID washout. That is a 60% base, deep and ugly, the kind most traders stop watching.
Through the summer the stock stopped going down. Price coiled between roughly 0.94 and 1.22, and the moving averages flattened and turned up under it. Into the breakout, GME had closed above its 10-day line for ten straight sessions and sat 8.4% above that line, with the 10-day at 1.16 and the 20-day and 50-day both near 1.10. Tightness over a rising short-term average is the tell that supply has dried up.
The 21 August bar did the work. Price opened at 1.15, ran to a 1.40 high, and closed at 1.26, pushing clean through the 1.22 pivot set three days earlier. Volume came in at 42.5 million shares against a 20-day average near 13.3 million, a 3.2x expansion. A breakout you can trust shows range and volume together, and this volume confirmation on the breakout candle is exactly what you want to see. The relative strength line in the top panel was already pressing new highs, so the stock was leading its own recovery, not lagging it.
A shrinking business behind a 60% base
Here is the uncomfortable part of the setup. GameStop was a struggling mall retailer, hurt for years by the shift to digital game downloads. The SEC filings tell the story: revenue in the quarter ending 1 August 2020 was 942 million dollars, down 26.7% year over year, the latest in an unbroken run of double-digit revenue declines. Quarterly EPS was negative 1.71. Nothing in the fundamentals said “new leader.”
What the chart was pricing was a change in ownership and narrative. On 28 August 2020, Chewy co-founder Ryan Cohen’s RC Ventures disclosed a 9% stake in a 13D filing, arguing the shares were undervalued and the console cycle and a digital pivot could turn the business. The stock jumped to a 1.67 close on 31 August, then kept working higher. The base breakout on 21 August had front-run that news by a week, which is the recurring lesson of accumulation: price often moves before the reason is public.
Traders who follow the William O’Neil style of buying leaders as they break out of bases live with this tension constantly. The screen flagged GME on price, volume, and relative strength, not on its income statement. That is a feature of momentum work, and it is also where the risk hides.
Breaking out into a record-high tape
Context helped. GME broke out into one of the strongest tapes in years. The S&P 500 closed at a fresh record high on 18 August 2020, its first new high since the February crash, completing a full round-trip in under six months, and the Nasdaq was notching record close after record close. A rising market forgives breakouts that a hostile tape would punish, and this one broke out three sessions after the index printed that new high. A stock leading a leading market is the environment trend following is built to exploit.
The recovery behind those records was unusually fast, a V-shaped rebound that was pulling demand for digital life forward, and the aggressive end of the growth market was exactly where the leadership sat. Speed like that breeds complacency as easily as it rewards breakouts; respecting the stop under the 1.11 shelf was what separated participating in the trend from betting on it.
Spotting the setup before it moved
Nothing here needed a crystal ball. The watchlist logic was mechanical, and a trader could have built it from the structure on the chart.
The base low at 0.64 (3 April 2020) marked where the whole structure would fail. The five-day shelf low at 1.11 (18 August 2020) marked the immediate floor under the coil. The 1.22 pivot was the line that, once cleared on volume, said the coil had resolved up. Add the ten straight closes above a rising 10-day line, and you had a stock quietly setting up under an obvious trigger.
From those anchors, the plan writes itself. A trend follower could have entered on the move through the 1.22 pivot, set the initial stop just below the 1.11 shelf (or, for a wider structural stop, below the 0.64 base low where the thesis breaks), then trailed the 10-day moving average and widened to the 20-day once the trade was well advanced. Entry, invalidation, and a trailing exit, all defined before the first share moved. If you want a template for that pre-work, the pre-trade checklist covers the same ground.
From 1.26 to a 22-bagger: how the trend paid
A trader using this pattern might then have watched for strength to hand out add points, and it did, repeatedly. There was an opportunity to add on 16 September at a 2.17 close (up 72%), again on 8 October at 3.37 on enormous volume (up 168%), then on 17 December at 3.71 (up 194%), on 11 January 2021 at 4.99 (up 296%) as Cohen and two allies joined the board, and one more time on 24 February at 22.93 as the second squeeze wave built. Each add came higher than the one before, which is how a real trend rewards patience.
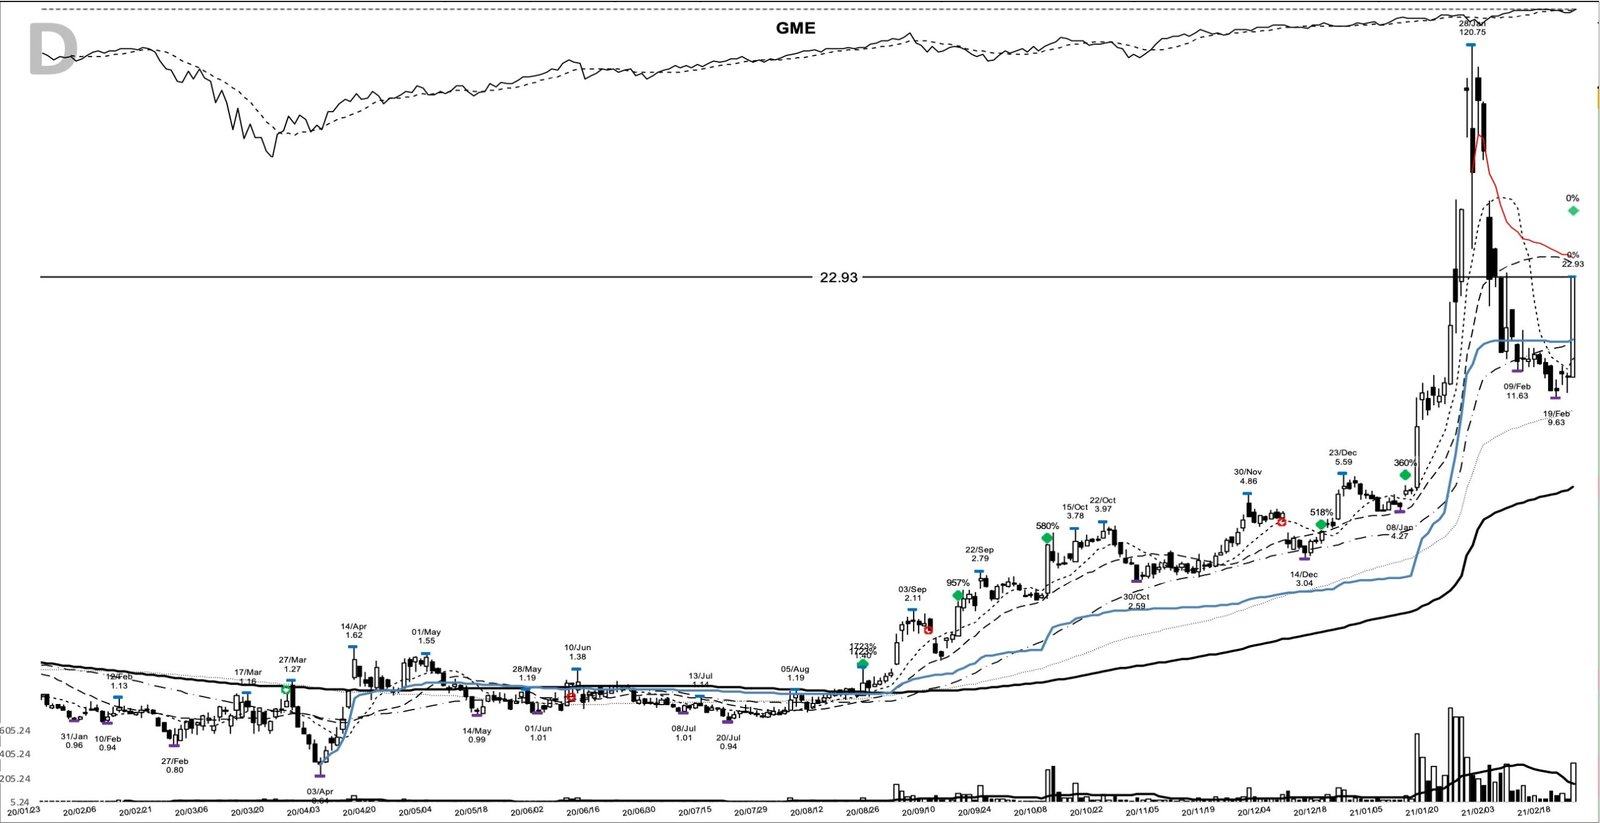
Then came the parabola. On 28 January 2021 GME spiked to an intraday high of 120.75, more than 9500% above the breakout, before slamming shut the same day. No trend method exits the exact top of a move like that, and chasing it was never the plan. The trade was managed by the trend, and the exit marker printed at a 30.09 close on 24 March 2021, closing the study at +2292% over 215 calendar days. On that math, 1,000 dollars riding the full move would have become about 23,924 dollars. The gap between the 9500% peak and the +2292% exit is the honest price of trailing a stop through violence like this. Adding into strength and letting a trailing exit do its work, the lesson Jesse Livermore preached a century ago, is what turned a 1.26 breakout into a 22-bagger.
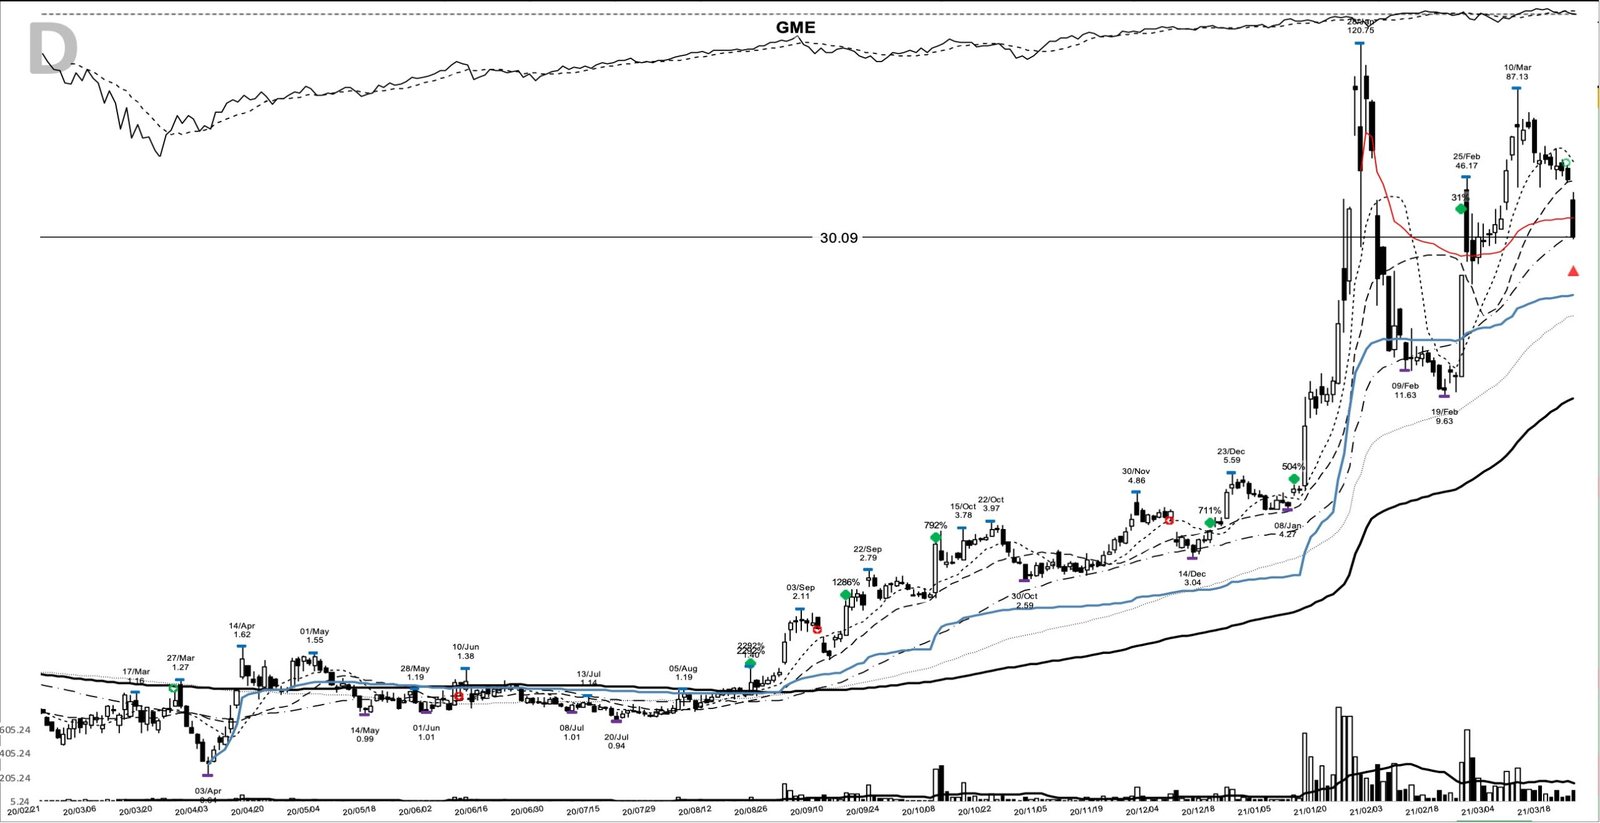
The tape at the exit says why the marker printed where it did. By late March 2021 the indexes still stood in an uptrend, while the action underneath had turned choppy and heavy and the growth names that led the prior year were breaking down one by one. Booking a parabolic winner into that kind of deterioration, on the stock’s own trailing stop, beat waiting for the index to make the damage official.
Where this GME chart fools people
The obvious trap is buying extended. By the 8 October add at 3.37, price was already 168% above the pivot and far from any low-risk entry; a late buyer there had no logical stop and would have been shaken out in the next pullback. Adds belong on strength, but only where the risk to a nearby stop is still small.
The second trap is treating the January 2021 spike as the signal. A vertical, headline-driven blow-off is a distribution event, and reading it as “the move” invites you to buy the top of a chart that fell more than 90% within weeks. The disciplined read was the exact opposite of the crowd’s.
The last trap is survivorship. This is one saved winner, and the vast majority of deep-base breakouts never compound into a 22-bagger; most stall or fail near the pivot. A base breakout does not promise a trend, and treating one exemplar as a template ignores survivorship bias. The setup only earns its keep across many attempts with stops that keep the losers small.
Learn the pattern behind GME’s run
Strip away the meme and GME in 2020 was a clean base breakout in a rising market, bought on a pivot and a volume surge, then held and added to as the trend proved itself. The fundamentals were poor and the exit gave back most of the paper peak, and it was still a 22-bagger, because the process protected the downside and let the upside run. Learn the pattern. Ride the trend. Keep the gains.
Related studies: Weinstein stage analysis for the stage-two logic behind this base, reading volume for the breakout-bar signature, and position sizing methods for handling the adds. A fresh winner study lands here most evenings.
Price and volume figures are computed from split-adjusted daily OHLCV data; company figures come from SEC filings where cited.
Educational content only. Not investment advice. Trading involves risk. You are responsible for your decisions.
Get the free Market Wisdom e-book
Join Trends and Breakouts — historical winners, breakout studies, and risk lessons. No spam, unsubscribe anytime.