
A momentum scan returns two names on the same evening. Stock A closed at 61.38 after a steady climb from a low of 27.94. Stock B closed at 43.92, up 46.79% in 30 sessions from its own low of 29.92. Both look strong on a one-month view. The trend template is a fixed checklist for telling them apart: it asks whether a stock’s price and its long moving averages already describe an established uptrend, and it answers with a set of pass or fail conditions instead of an impression.
Every stock and price in this article is hypothetical, built from a simple synthetic price series so that each moving average and threshold can be calculated exactly.
The eight trend template conditions
The checklist comes from Mark Minervini’s SEPA approach, published as a list of eight conditions in his 2013 book Trade Like a Stock Market Wizard. Versions circulating online differ in small ways, so this article uses the book’s list and states its own measurement rules next to it. Five conditions deal with moving averages, two with the 52-week range and one with relative strength.
| # | Condition | How this article measures it |
|---|---|---|
| 1 | Price above the 150-day and 200-day moving averages | Daily close above both simple moving averages |
| 2 | 150-day average above the 200-day average | Compared on the same session |
| 3 | 200-day average trending up for at least one month | Today’s 200-day value above its value 22 sessions earlier |
| 4 | 50-day average above the 150-day and 200-day averages | Compared on the same session |
| 5 | Price above the 50-day average | Daily close above it |
| 6 | Price at least 30% above the 52-week low | Close at least 1.30 times the lowest close of the last 252 sessions |
| 7 | Price within 25% of the 52-week high | Close at least 0.75 times the highest close of the last 252 sessions |
| 8 | Relative strength ranking of at least 70, preferably 80 or higher | A percentile rating against other stocks, taken as given |
All averages are simple averages of daily closes. Some screens use intraday highs and lows for the 52-week range, which shifts conditions 6 and 7 slightly, so whichever source you use, don’t switch it between scans.
Condition 7 has a second reading worth spotting. “Within 25% of the high” can mean the price is no more than 25% below the high (0.75 times the high, used here) or that the high is no more than 25% above the price, which works out to 0.80 times the high. On a stock with a 52-week high of 50.00, the first reading passes anything closing at 37.50 or higher and the second needs 40.00. Pick one and write it into the scan.
How the 200-day slope is judged
Condition 3 is the one most often loosened in practice. The book asks for a 200-day average rising for at least one month and says four to five months is preferable in most cases. A month is roughly 22 trading sessions, so the test here compares today’s 200-day value with the value 22 sessions back.
Stock A shows why the observation period matters. Its 200-day average bottomed at 32.10 at session 272. By session 275 it had barely turned up at 32.11, yet it still sat below the 32.43 it read twenty-two sessions earlier, so the one-month test failed. The test first passed at session 284, with 32.22 against 32.19, twelve sessions after the low. The stock as a whole waited longer. Session 304 was the first on which all eight conditions held, 32 sessions after the average’s low point, about six and a half weeks, because the 150-day needed that long to clear the 200-day. A trader preferring the four-to-five-month version would wait a good deal longer, and that preference is a real design choice: the longer window rejects more young turns and also arrives later.
Relative strength rating versus the RS line
Condition 8 refers to a relative strength ranking, the 1 to 99 percentile rating published by Investor’s Business Daily, the paper founded by William O’Neil. It ranks a stock’s price performance over the past year against all other stocks in the database. A rating of 88 means the stock has outperformed roughly 88% of that universe.
The relative strength line is a different measurement. It divides the stock’s price by an index, so it compares the stock with one benchmark instead of with every other stock. A stock up 40% while the index rises 10% has an RS line up 27.27% over the period (1.40 divided by 1.10, minus one). That same stock could still carry a modest rating if the broad list of stocks did even better, which happens in strong speculative phases. A rising line alone doesn’t satisfy condition 8, and a rating of 70 doesn’t tell you the line is making new highs.
One stock, two dates: a condition-by-condition table
The clearest way to read the trend template is condition by condition. Here is Stock A at two points: session 275, early in its advance, and session 379, after a second base and breakout. Stock B at session 379 is added for comparison, with the relative strength ratings assumed.
| Measure | A, session 275 | A, session 379 | B, session 379 |
|---|---|---|---|
| Close | 39.16 | 61.38 | 43.92 |
| 50-day average | 33.08 | 54.64 | 35.02 |
| 150-day average | 30.85 | 45.12 | 39.63 |
| 200-day average | 32.11 | 41.01 | 43.44 |
| 200-day, 22 sessions earlier | 32.43 | 37.77 | 45.86 |
| 52-week low / high (closes) | 27.94 / 41.63 | 27.94 / 61.61 | 29.92 / 68.80 |
| Above low / below high | 40.16% / 5.93% | 119.69% / 0.37% | 46.79% / 36.16% |
| RS rating (assumed) | 81 | 88 | 74 |
| Condition | A, 275 | A, 379 | B, 379 |
|---|---|---|---|
| 1 Price above 150-day and 200-day | Pass | Pass | Pass |
| 2 150-day above 200-day | Fail | Pass | Fail |
| 3 200-day rising over 22 sessions | Fail | Pass | Fail |
| 4 50-day above 150-day and 200-day | Pass | Pass | Fail |
| 5 Price above 50-day | Pass | Pass | Pass |
| 6 At least 30% above 52-week low | Pass | Pass | Pass |
| 7 Within 25% of 52-week high | Pass | Pass | Fail |
| 8 RS rating at least 70 | Pass | Pass | Pass |
| Total | 6 of 8 | 8 of 8 | 4 of 8 |
At session 275, Stock A has done most of the visible work. It’s 40.16% off its low, above every average and 5.93% from its high. The two failures both sit in the long end: the 150-day at 30.85 is still under the 200-day at 32.11, and the 200-day still reads lower than it did 22 sessions earlier. Those two conditions describe the last seven to nine months of price history, and that history still contains the decline.
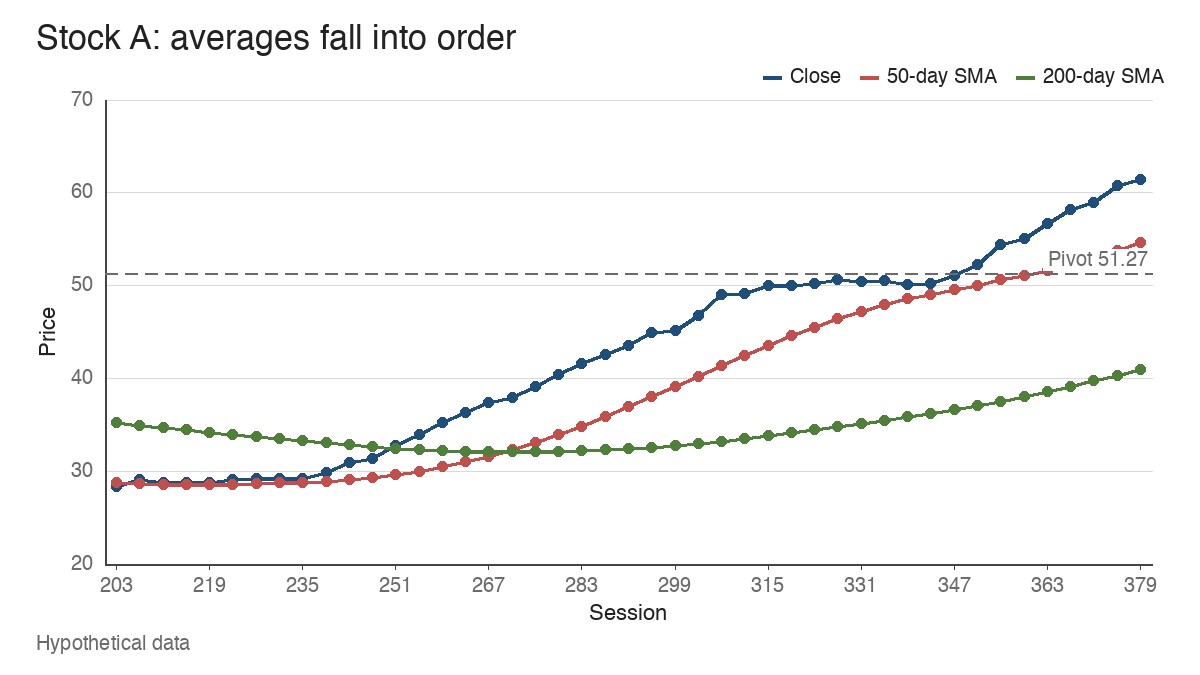
A score of 6 of 8 can tempt a reader to treat the stock as nearly qualified. The template is a gate, though, and the failures here are structural ones. A partial count is better read as a description of which part of the trend is missing.
A sharp rebound against a falling 200-day average
Stock B’s last 30 sessions look like strength. It closed at 43.92, just above its 200-day average of 43.44, and well above its 50-day at 35.02. A screen built only on “price above the 200-day” would include it.
The order of the averages tells a different story. B’s 50-day (35.02) sits below the 150-day (39.63), which sits below the 200-day (43.44): the stack is inverted. The 200-day fell from 45.86 to 43.44 over the 22-session test window. And the close is 36.16% below the 52-week high of 68.80, outside the 25% limit. Condition 1 passes only because the price has rebounded into a falling average.
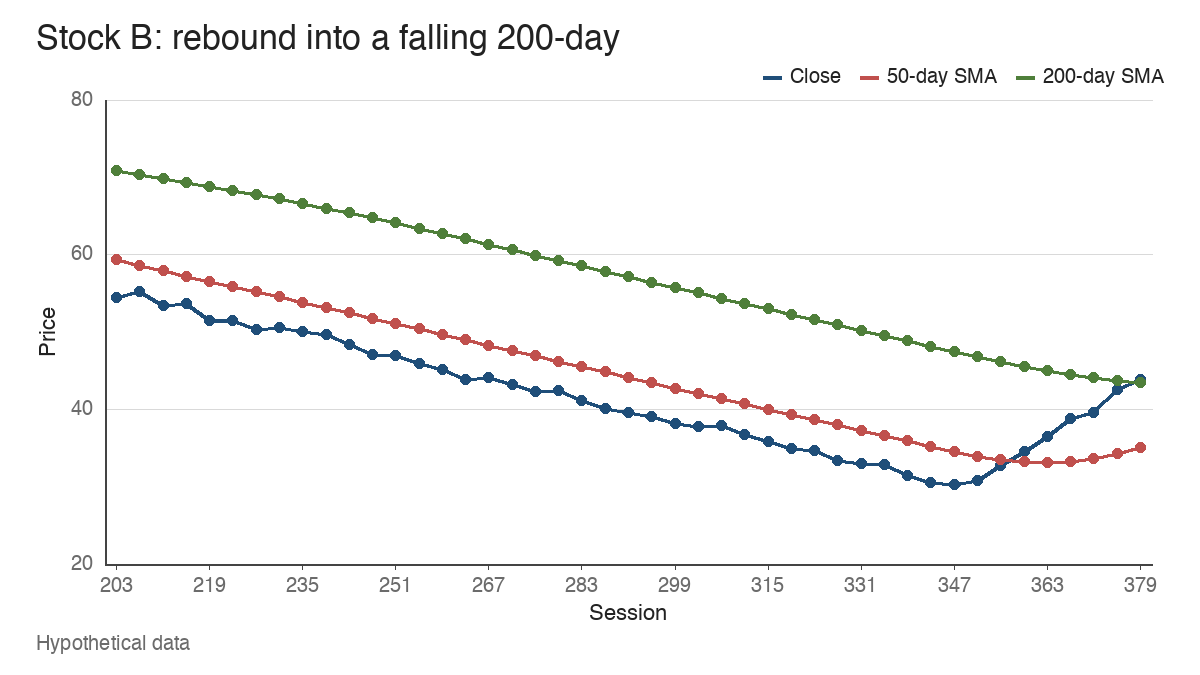
The mechanism is arithmetic. B’s rebound occupies the last 30 sessions, which is 60% of the 50-day window but only 15% of the 200-day window. The other 85% of the 200-day average is still made of declining prices. The 50-day has started to turn, from a trough of 33.13 at session 362 to 35.02 at session 379, while the longer averages keep falling. A rebound like this might become a new uptrend, and in stage analysis terms it may be an early attempt to leave a decline. The template simply doesn’t treat it as an established one yet.
Why aligned averages describe strength late
Each moving average summarizes a different stretch of history. The 50-day covers roughly ten weeks, the 150-day about seven months and the 200-day a little over nine months. When price is above the 50-day, the 50-day above the 150-day and the 150-day above the 200-day, each newer stretch of the past has traded higher than the older one. That’s what an established uptrend looks like in summary form.
The same property makes it slow. Stock A’s lowest close was 27.94. It first passed all eight conditions at session 304, closing at 48.00, which is 71.80% above that low. At that session the 150-day (33.06) cleared the 200-day (33.04) by just 0.02. The template confirmed the trend after most of the move from the low had already happened, and that’s by design. It’s asking whether the trend exists, which can only be answered from data that’s already in.
Passing the screen versus finding an entry
Qualification answers one question: does this stock’s chart show an established uptrend? It doesn’t say whether there’s a completed base, where the pivot is, or whether the market is supportive. Those are separate checks within SEPA, and the template feeds them a shorter list to work through.
Stock A after session 304 shows the gap. It spent sessions 315 to 344 in a narrow base, with closes between 49.21 and 51.27, a depth of 4.02%. The highest close, 51.27, serves as the pivot here. The first close above it came at session 348, at 52.69, 2.77% above the pivot. Thirty-one sessions later the stock closes at 61.38, 19.72% above the pivot and 12.34% above its 50-day average. On session 379 it passes all eight conditions with room to spare, and it’s also far outside the zone that the breakout pivot price extension lesson treats as close enough to the pivot to define risk.
I’d read session 379 as the strongest trend reading in this article and the weakest entry structure. A trader using this framework might keep A on a watchlist and wait for a new base, such as a volatility contraction pattern with its own pivot, while separately checking the index and breadth. The template sorts candidates. Entries come from the base.
Sideways trading and qualification churn
The template behaves well in a trending stock and less well when the trend pauses. Stock C, a third hypothetical series, rose into the qualifying zone and then traded sideways between 46.42 and 50.22 for 90 sessions (290 to 379). Its longer averages stayed in order and kept rising throughout. Even so, C passed on 65 of those 90 sessions and changed status 26 times.
Every one of its 25 failing days came from a single condition, the close dipping under a flattening 50-day average. A daily scan would add and drop C roughly once every three to four sessions while nothing important changed on the chart. Two habits reduce the noise: reading the failures by condition instead of by total, and treating a condition 5 failure during a base differently from a failure in the long averages.
Where the trend template stops
The limits follow from the construction. Moving averages lag, so the template qualifies trends after a large part of the move from the low, and it’ll keep qualifying a stock for some time after its trend has begun to fail. Sideways ranges produce repeated changes in status around the 50-day, as Stock C shows. And every condition is historical: a stock can satisfy all eight on a Friday and then break down, because nothing in the list measures what happens next. There’s no published success rate attached to passing it, and this article doesn’t suggest one.
What it does well is narrower and still useful. It fixes, in writing, what an established uptrend has to look like before a stock gets further attention. Stock A at session 379 and Stock B at session 379 both closed higher than they were a month earlier. Only one of them had the history to back it.
Learn the pattern. Ride the trend. Keep the gains.
Educational content only. Not investment advice. Trading involves risk. You are responsible for your decisions.
Get the free Market Wisdom e-book
Join Trends and Breakouts — historical winners, breakout studies, and risk lessons. No spam, unsubscribe anytime.