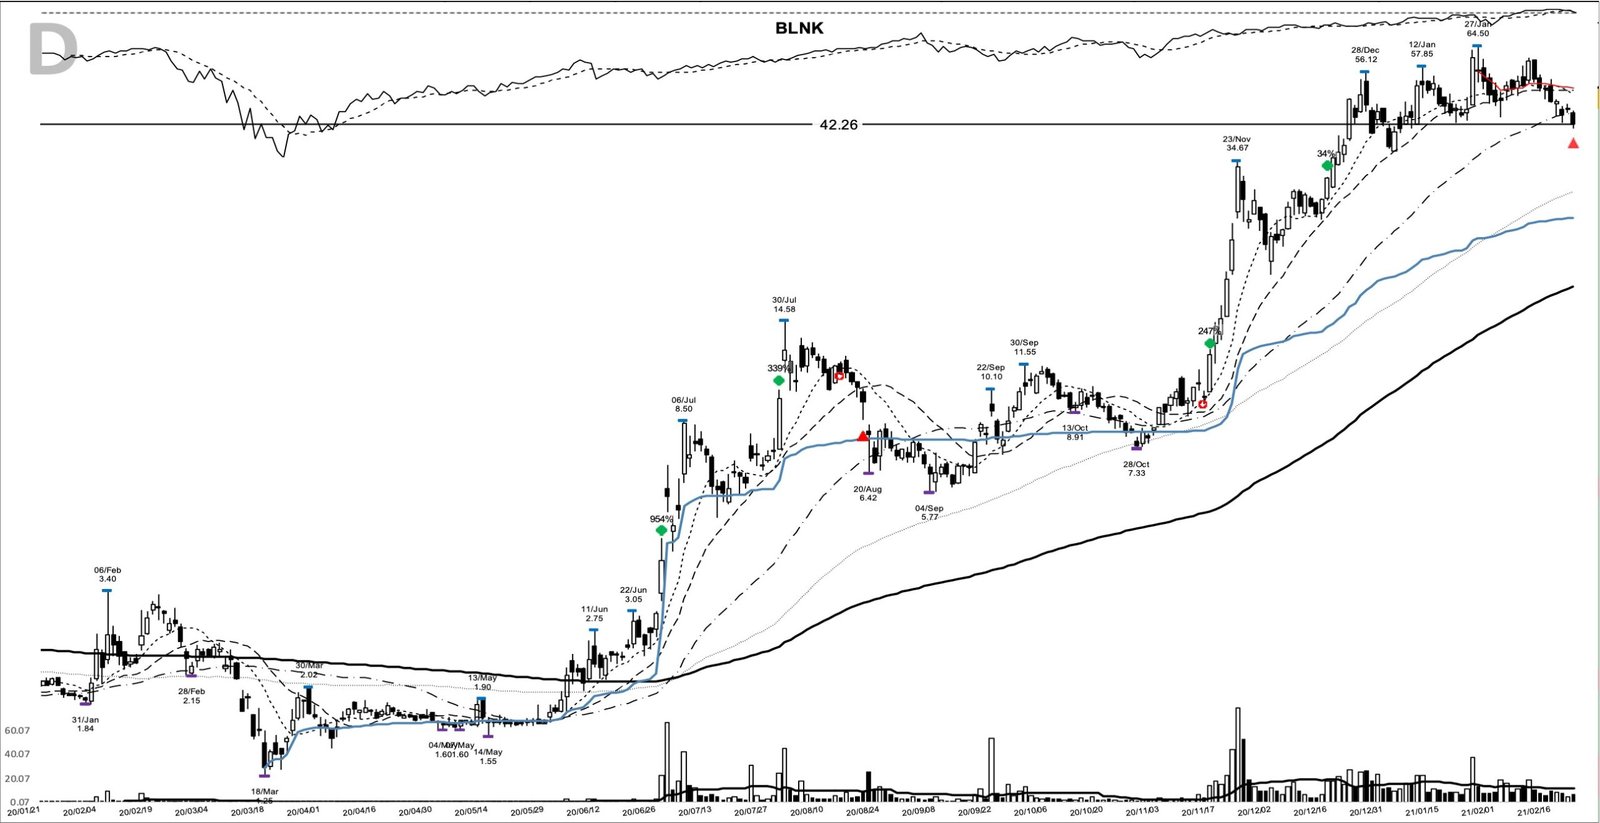
On 29 June 2020 Blink Charging opened at 3.36, above a 3.05 high it had tested twice in the previous week, and traded 22,253,993 shares by the close. That was 19.4 times its 20-day average. When BLNK shows up on traders’ screens again, this is the chart worth studying. The blnk base breakout in one line: a June 2020 close at 4.01 out of a 20-week base, followed by a +953.9% price change to the exit 238 calendar days later.
Key takeaways from the BLNK run, June 2020 to February 2021
- The pattern: a wide base from the 3.40 high of 6 February 2020, 63.2 percent deep at the 1.25 low of 18 March, with a 3.05 pivot set on 22 June.
- The move: from the 4.01 entry close to a 42.26 exit close on 22 February 2021, +953.9% in 238 calendar days, with a 64.50 peak on 27 January.
- The two legs: a first close under the 20-day moving average on 19 August, a three-month reset, and a second leg that started with the 16 November session.
- The add-ons: 29 July, 16 November and 16 December 2020 each offered a way to add, the first two on closes above prior highs.
- The lesson: the 20-day line ended the first leg, and on the second the 50-day line was the one that finally broke.
The BLNK trade at a glance
| Field | Value |
|---|---|
| Ticker | BLNK |
| Breakout date | 29 June 2020 |
| Breakout close | $4.01 |
| Volume vs 20-day average | 19.4x |
| Exit date | 22 February 2021 |
| Exit close | $42.26 |
| Price change, entry close to exit close | +953.9% |
| Calendar days | 238 |
| Peak before exit | $64.50 (27 January 2021) |
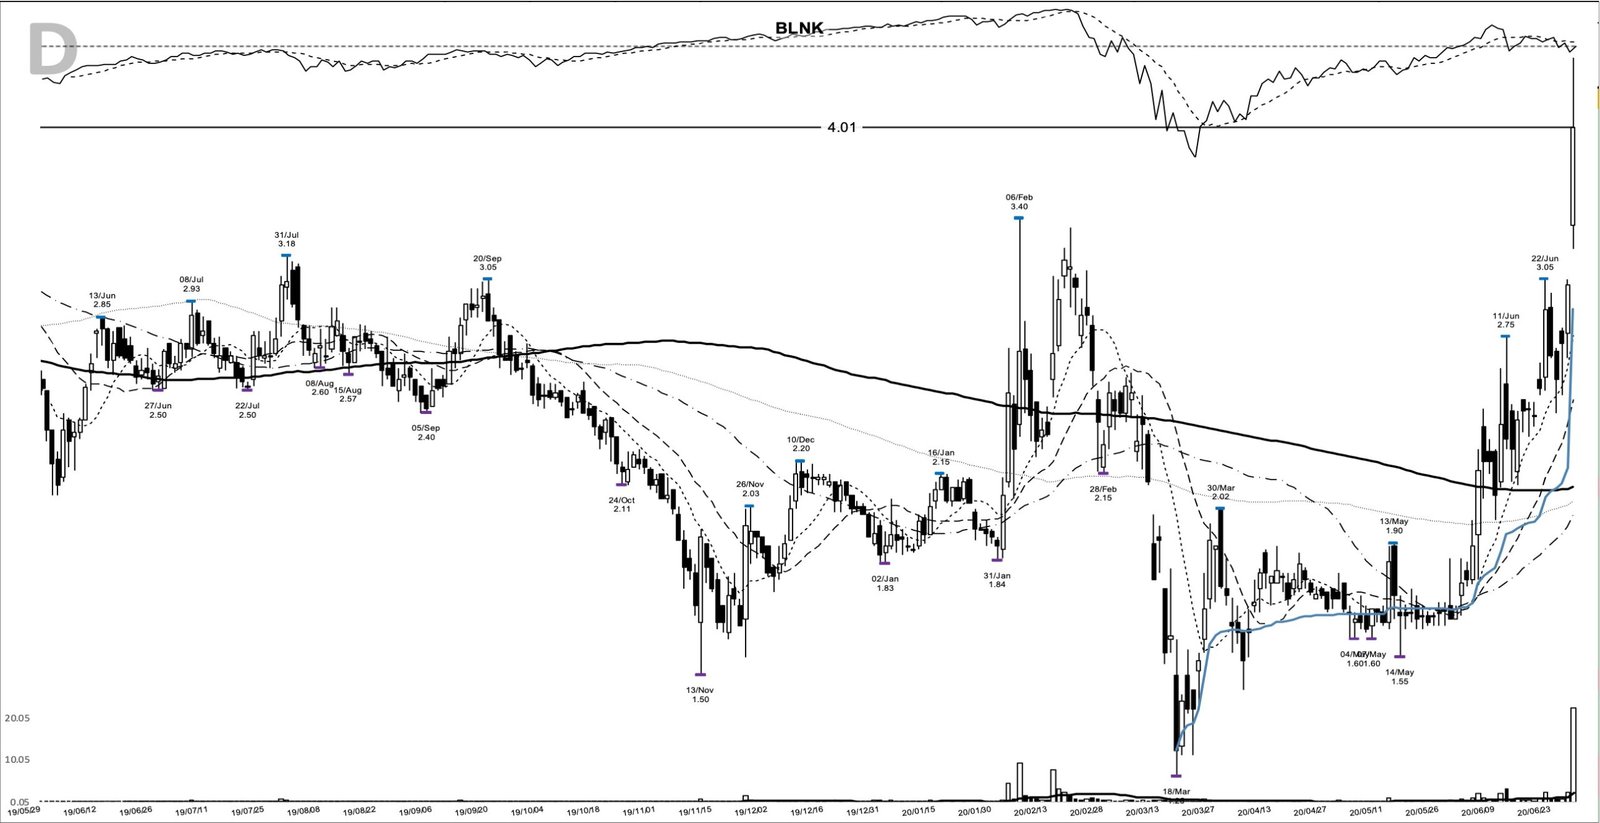
Inside the BLNK base breakout: 20 weeks and a 3.05 pivot
The base began with a spike. On 6 February 2020 BLNK traded up to 3.40 and closed at 2.68, and the March crash then took it to a 1.25 low on 18 March. That’s a 63.2 percent drop from high to low, which puts this in wide and loose base territory by any textbook measure.
The repair was slow and quiet, and it’s the quiet part that mattered. Through May the stock held a narrow band: lows of 1.60 on 4 and 7 May, a 1.90 high on 13 May and a 1.55 low the next day, on volume that fell to 106,089 shares on 4 May. Then June woke it up. A 2.75 high on 11 June came on 3,267,337 shares, and on 22 June it reached 3.05 and closed at 2.89. On 26 June it pushed to 3.05 again and closed at 3.02, just under the line.
The next session opened at 3.36, already 10.2 percent above that pivot, ran to 4.54 and closed at 4.01. That close cleared the pivot by 31.5 percent, a confirmed breakout on a closing basis, and it sat 17.9 percent above the 3.40 February high, so the stock closed at a new 52-week high the same day. The volume backed the move: 22,253,993 shares against a 20-day average of 1,146,614.
Blink Charging in mid-2020: revenue growing, losses widening
Blink built and ran electric-vehicle charging stations and sold chargers to site owners. The SEC filings show a tiny business that had started to grow fast. Quarterly revenue went from 577,390 dollars in the March 2019 quarter to 1,298,864 dollars in the March 2020 quarter, up 125.0 percent. The year-over-year rate had risen from 14.6 percent in the June 2019 quarter to 39.8 percent in September 2019, then 125.0 percent. That’s real sales acceleration, from a base small enough that one good quarter could move the percentage a lot.
Earnings didn’t follow. Loss per share was -0.07 in the March 2019 quarter and -0.11 a year later, with -0.09 and -0.10 in between. The company’s 13 May release credited the revenue jump to sales of its IQ 200 chargers and DC fast chargers. A growth investor in the William O’Neil mould would have seen one strong line and one weak one.
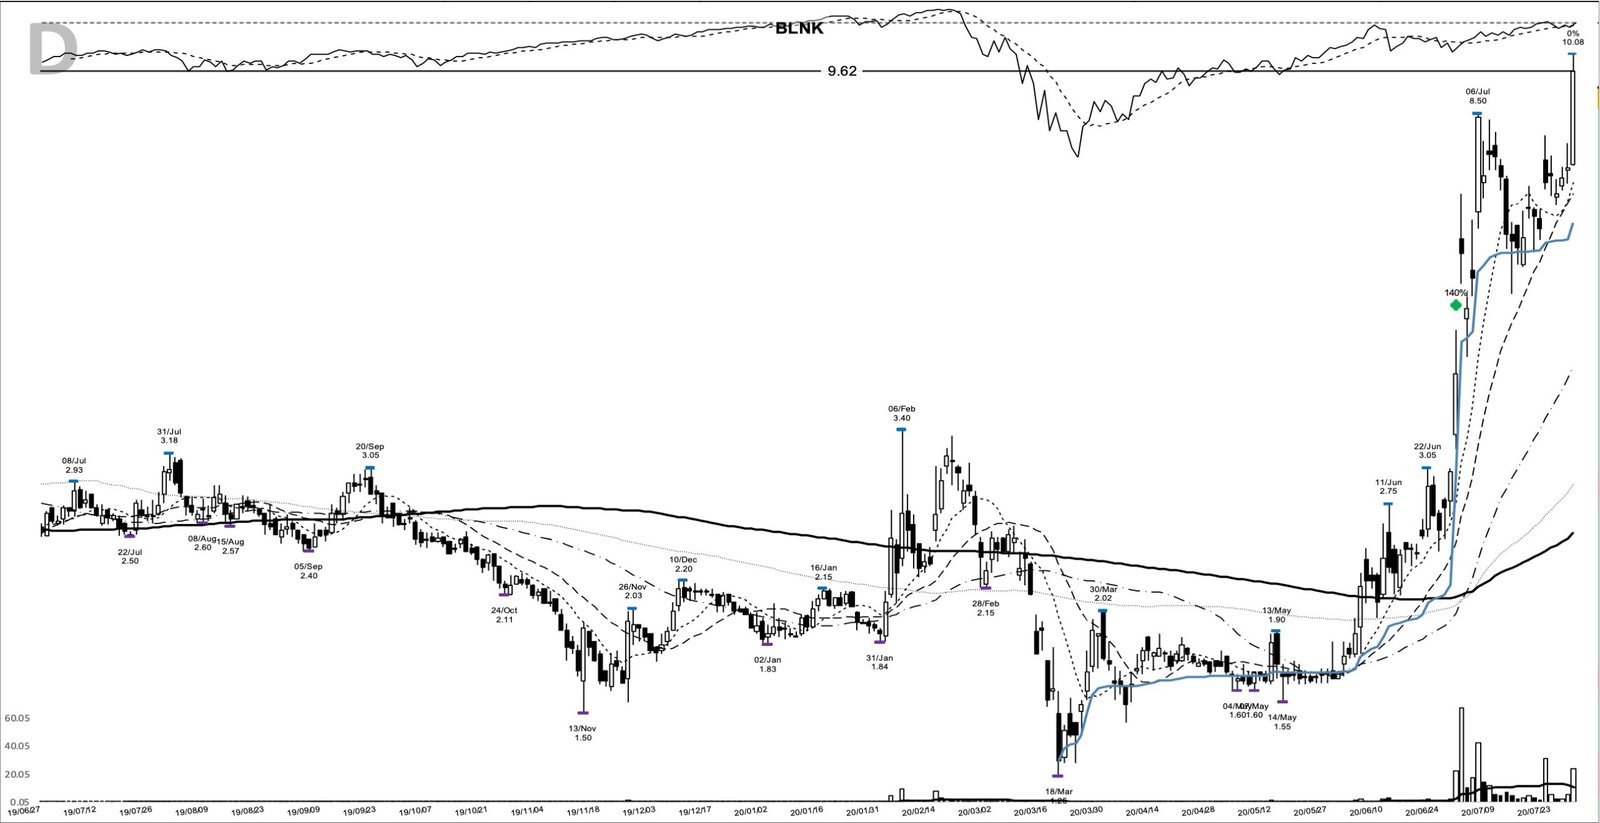
The story ran ahead of both. Motley Fool put July’s gain at 94.5 percent and tied it to development deals, including a late-July agreement to build a charging network in Greece, while noting the company had yet to collect serious revenue. The 29 July session offered the first add, a 9.62 close that took out the 8.50 high of 6 July.
The summer 2020 tape that rewarded speculative growth
The breakout came into a strong market. The Nasdaq Composite closed above 10,000 for the first time on 10 June 2020, per Nasdaq.com, completing a V-shaped recovery from the March lows. By November, Motley Fool noted, many electric-vehicle stocks were posting outsized gains.
By February 2021 that tape had turned. A sharp rise in Treasury yields that month pushed investors out of growth stocks, and Axios reported on 24 February that clean-energy names had been hit broadly, with Tesla 20.6 percent off its 8 January record. BLNK had already peaked on 27 January.
How a trader could have spotted BLNK before 29 June
Going into the entry, BLNK had closed above its 10-day moving average for 22 straight sessions. The 10-day sat at 2.76, the 20-day at 2.46 and the 50-day at 2.00, all stacked and rising. The watchlist case was a stock that had recovered from its March low, gone quiet in May and then started trading heavy volume in June, with two tests of 3.05 in the final week.
A plan written that morning might have read: a buy-stop above the 3.05 pivot of 22 June, with an initial stop under the 2.40 shelf low of 24 June. That’s 0.65 a share, 21.3 percent of the pivot, a wide stop by any standard. The 1.25 low of 18 March marked where the whole structure would fail. After entry, trail the 10-day line and widen to the 20-day once the trend was well advanced.
The open broke that plan’s arithmetic. Price gapped to 3.36, so a buy-stop at 3.05 would have filled near the open, with the shelf stop 28.6 percent below the fill. From the 4.01 close, the same stop sat 40.1 percent lower. Before sizing, the extension from the pivot was the number that set the risk.
From 4.01 to 64.50: how the BLNK trend played out in two legs
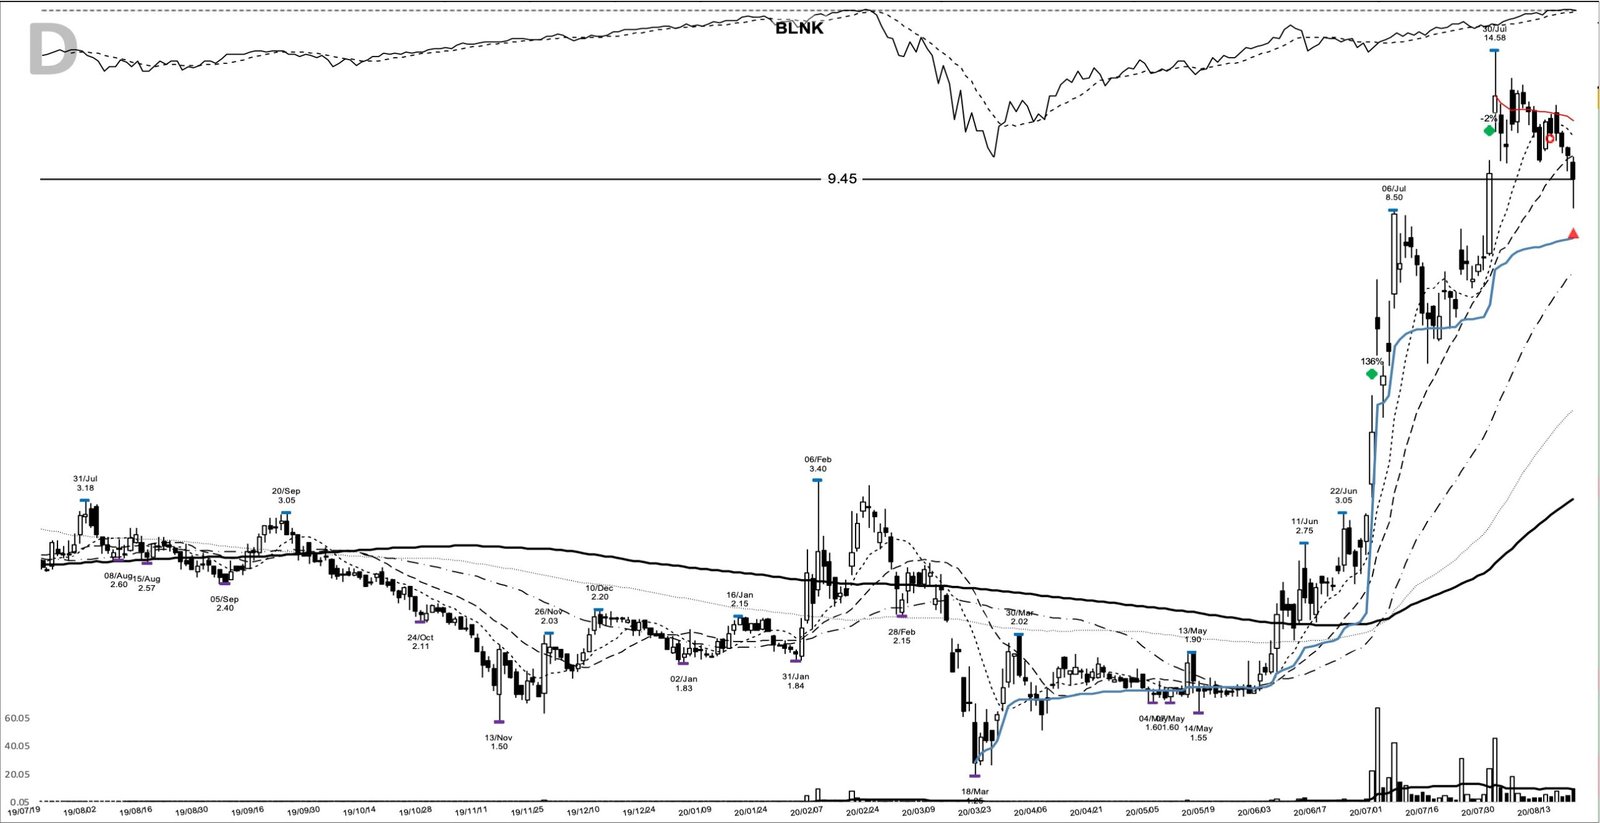
The first leg was violent. On 30 June BLNK opened at 5.91 and closed at 5.68 on 67,043,566 shares, then reached 8.50 on 6 July. A pullback to 5.05 on 14 July took 40.6 percent off that high and produced seven closes under the 10-day line, but every close held above the 20-day. The 29 July add came on volume only 1.9 times its 20-day average, and the next day the stock printed 14.58.
On 19 August the stock closed at 9.45, its first close below the 20-day moving average since the entry. That was the first sell mark, 135.7 percent above the first buy. The next day it traded down to 6.42, and by 4 September it had reached 5.77, 38.9 percent under the 19 August close.
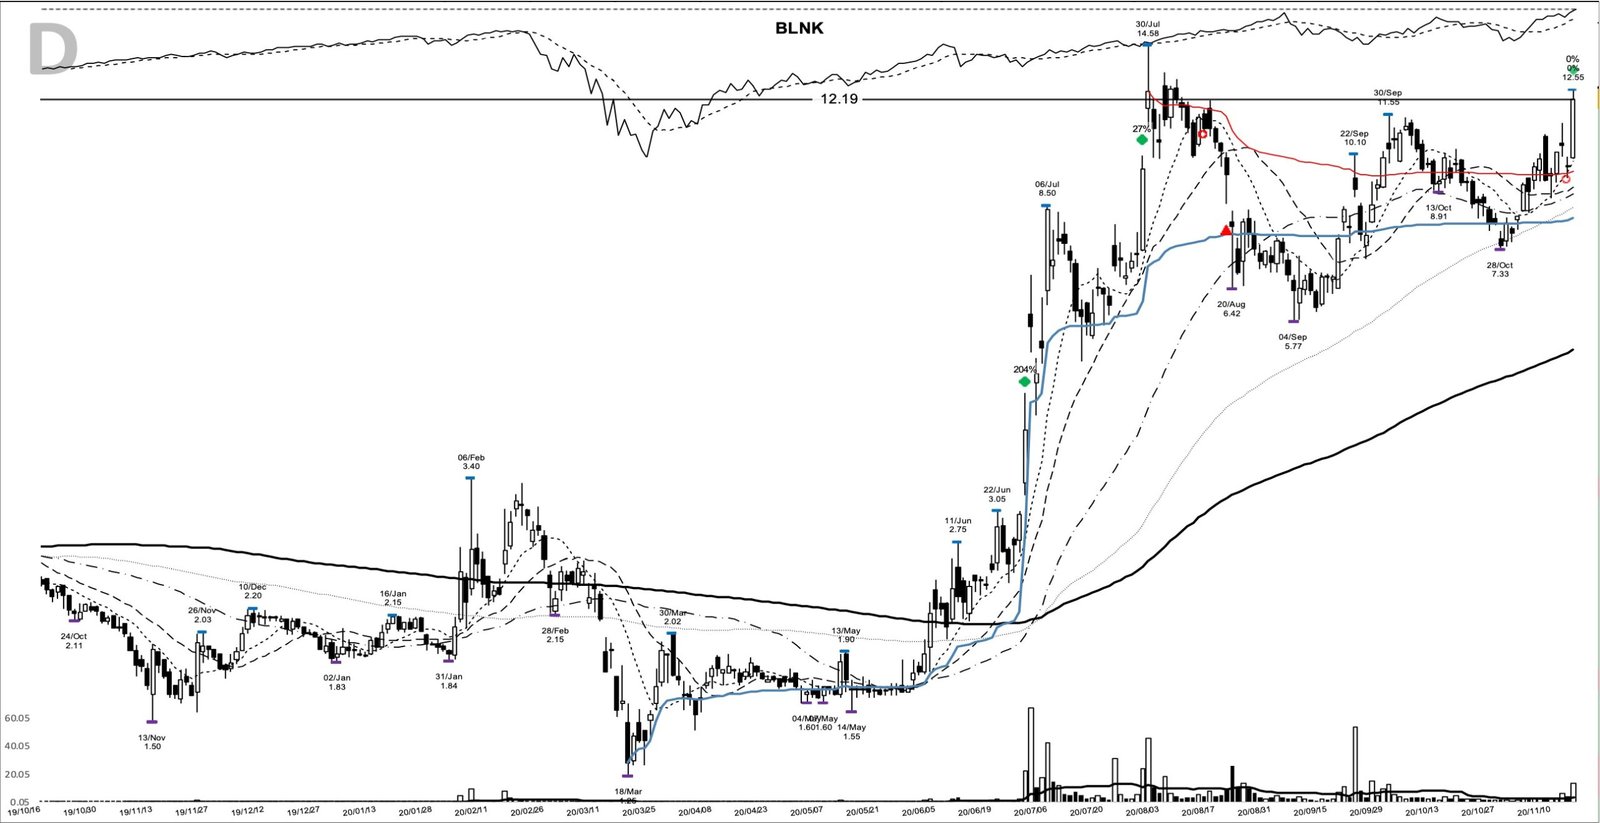
Through September and October BLNK built a new range under the 11.55 high of 30 September. Third-quarter results on 12 November disappointed, and Motley Fool reported the shares fell as much as 10.4 percent the next day. On 16 November the stock closed at 12.19, above the September high, on 13,425,277 shares, 5.5 times its 20-day average. That close offered a way back in, with another 246.7 percent still ahead to the exit.
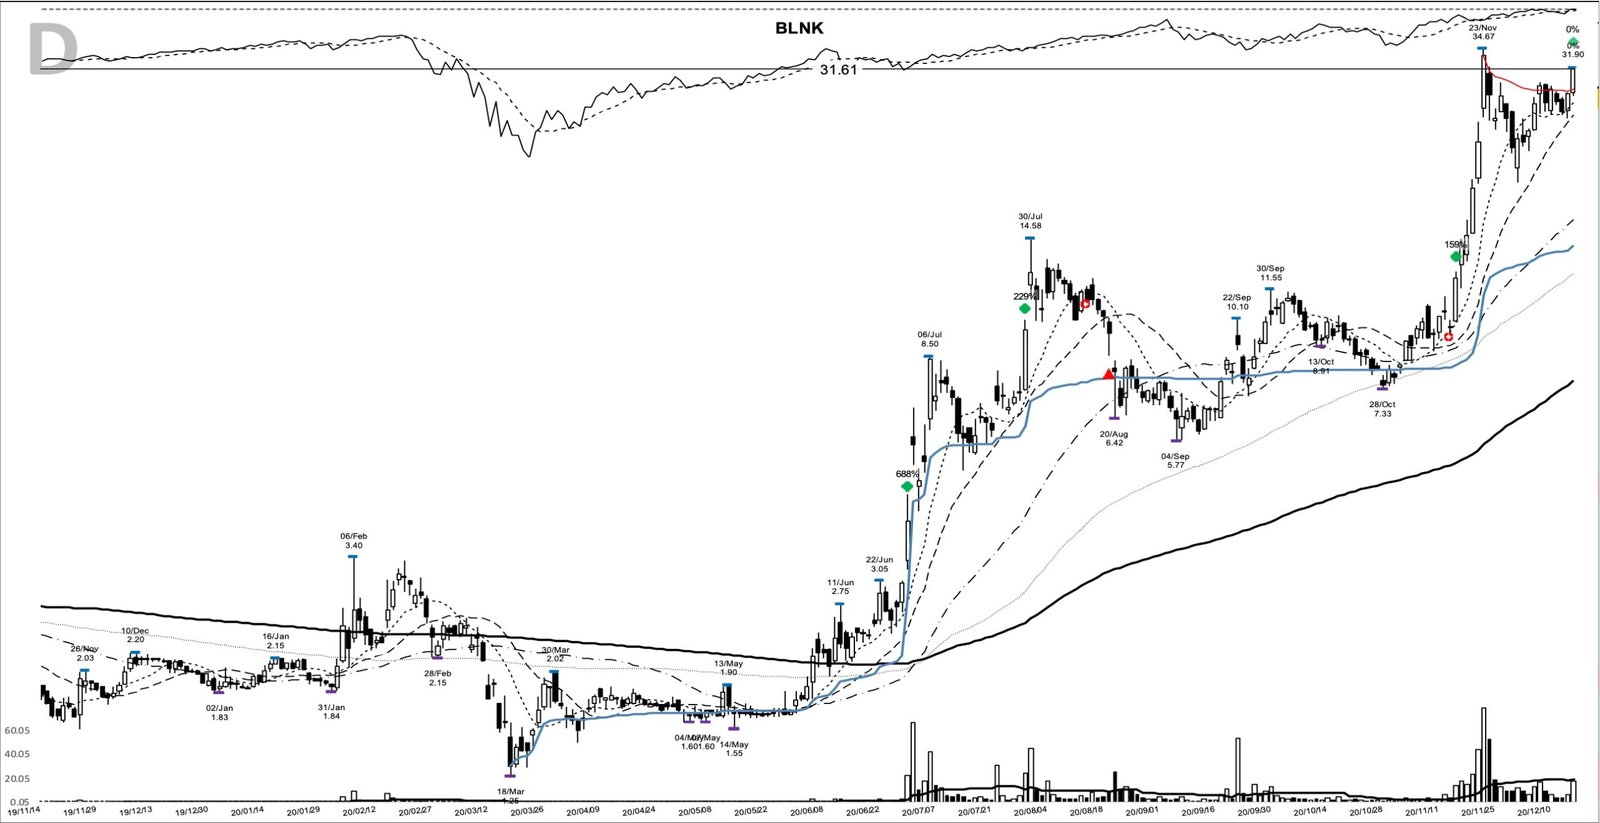
Within a week it hit 34.67, on 23 November, on 78,606,975 shares. A short report from Citron Research followed, and by 2 December the low was 18.81, 45.7 percent off the high. The recovery brought the third add on 16 December, a 31.61 close. For the mechanics of adding as a trend proves itself, see pyramiding into a position.
Highs of 56.12 on 28 December and 57.85 on 12 January led to the 64.50 peak on 27 January. The stock closed under its 20-day line in late January, early February and again in mid-February, but the 50-day held. On 22 February BLNK closed at 42.26, under its 50-day average for the first time since 2 November. That was the exit, 953.9 percent above the first buy and 34.5 percent under the peak. A thousand dollars riding the full move from first buy to exit would have become about 10,500 dollars.
Where the BLNK chart can mislead
The headline figure is the first trap. The +953.9% runs from the first close to the last, as if one share were held throughout. Someone who followed the August sell and came back on 16 November would have compounded two legs, +135.7% and +246.7%, into about +717%. That’s still a huge move, and a smaller one than the endpoints suggest.
The second is the base itself. A 63.2 percent decline is far deeper than the classic growth-stock base. This setup came with a big stop from the first minute, and the move had to be big to pay for it.
The third is the fundamental read. Revenue was accelerating, but losses per share were growing too, and the second leg started two sessions after a quarterly report that disappointed. Price led the story here, and the story was often ahead of the numbers.
What BLNK teaches about leaving and coming back
The 20-day line said the first leg was over on 19 August, and the chart then fell another 38.9 percent. The same rule couldn’t catch the second leg alone, because three months later the stock reclaimed its range on 5.5 times average volume and needed a fresh entry. A trend follower’s job on BLNK was to step aside when the trend broke and to recognise the next base when it formed.
Learn the pattern. Ride the trend. Keep the gains.
Related studies: the QS base breakout of November 2020, another electric-vehicle name from the same autumn, the NIO base breakout of May 2020, and the RUN base breakout of July 2020 from the clean-energy run of that summer. A new winner study lands most evenings.
Price and volume figures are computed from split-adjusted daily OHLCV data; company figures come from SEC filings where cited.
Educational content only. Not investment advice. Trading involves risk. You are responsible for your decisions.
Get the free Market Wisdom e-book
Join Trends and Breakouts — historical winners, breakout studies, and risk lessons. No spam, unsubscribe anytime.