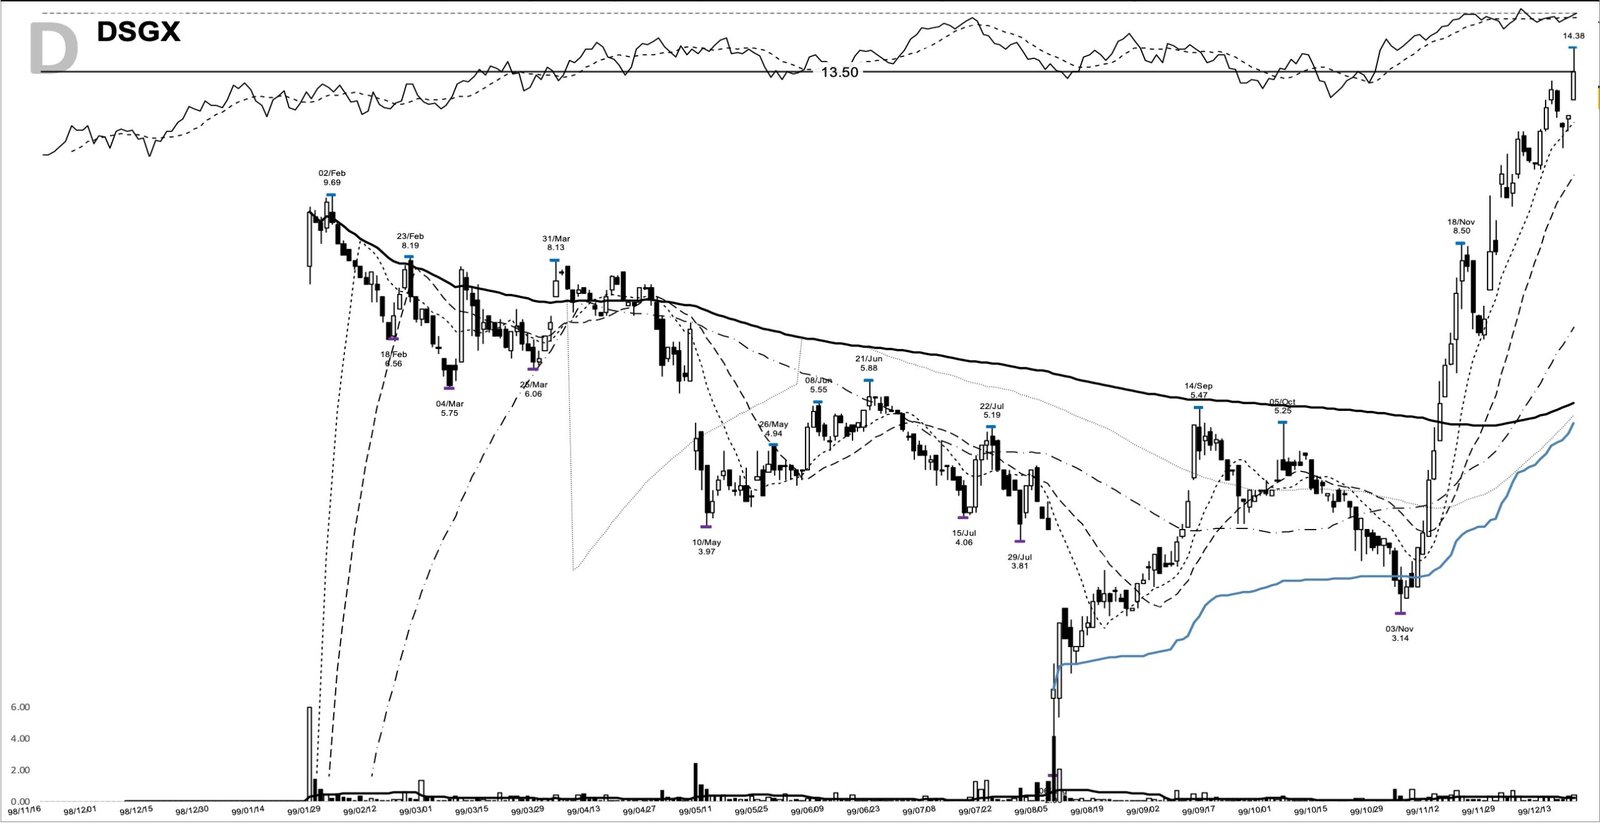
DSGX is back among the day’s big gainers this week, helped by a higher analyst price target, so it’s worth pulling up a much older chart. Back in late 1999, Descartes Systems Group had spent most of the year falling, from above 9 dollars in February to just over 2 dollars by August, before it turned. What followed was a textbook dsgx base breakout: a deep, washed-out base, a pivot at 8.50, and a run that carried the stock from an entry-day close of $8.31 to an exit near $41.50, a gain of 399 percent held across roughly four months.
The move looks obvious in hindsight. Living through it was harder, because the entry day never actually closed above the pivot. Price spiked through 8.50 intraday, then settled back below it, and the real confirmation came two sessions later. That gap between an intraday poke and a confirmed close is the whole lesson here.
Key takeaways from the DSGX base breakout
- The pattern: a deep six-month base, down about 76 percent from its high to its low, that set up under a pivot at $8.50.
- The move: from the $8.31 entry close to an exit near $41.50, a gain of 399.2 percent over 125 calendar days.
- The confirmation: the entry day only tested the pivot intraday; the pivot cleared two sessions later at a close of $10.25, on heavier volume.
- The adds: there was an opportunity to add on 17 December near $13.50, still early in the run; a second add on 22 February came very late, with under 10 percent of the move left.
- The lesson: waiting for a close above the pivot, then trailing the trend, beat chasing the first spike or the eventual peak near $91.61.
The DSGX trade at a glance
| Field | Value |
|---|---|
| Ticker | DSGX |
| Study entry date | 26 November 1999 (intraday pivot test) |
| Entry close | $8.31 |
| Pivot (20-day high) | $8.50 |
| Pivot cleared | 30 November 1999 at $10.25 |
| Volume vs 20-day average | 1.1x |
| Exit date | 30 March 2000 |
| Exit close | $41.50 |
| Gain | +399.2% |
| Calendar days | 125 |
| Peak before exit | $91.61 (10 March 2000) |
How the base formed under the 8.50 pivot
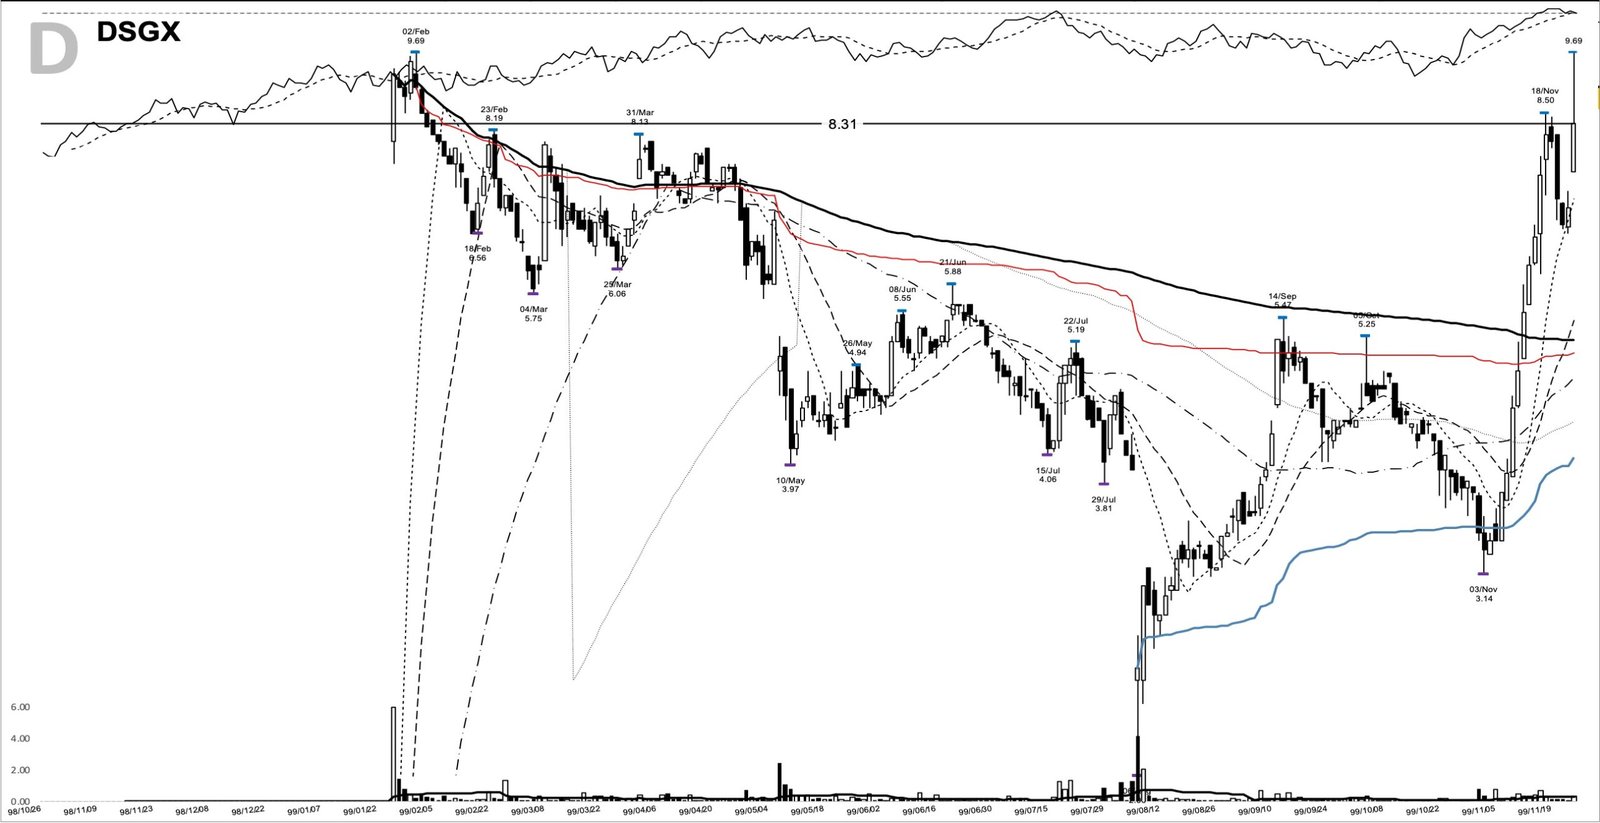
The base ran for months. After topping at 9.69 in February 1999, Descartes slid all year, and the selling climaxed on 6 August with a gap to a low of 2.03 on volume above four million shares. From that washout the stock spent late summer and autumn building a floor between roughly 3 and 5 dollars, then turned up hard in November.
The pivot was the 8.50 high set on 18 November, the top of that six-month base. Price pulled back into a tight shelf, with the low at 6.56 on 24 November, then surged on 26 November. That entry day is where the vocabulary matters. The bar traded as high as 9.69, well above the 8.50 pivot, but it closed at 8.31, back below it. This was an intraday pivot test, not a breakout. Volume ran only 1.1 times the 20-day average, so there was no demand surge to lean on.
The actual breakout came two sessions later. On 30 November the stock closed at 10.25, clearly above the 8.50 pivot, and it did so on 566,300 shares against the 298,900 traded on the entry day. That’s the close a trend follower waits for. The expansion in volume on the clearing day is what separates a real base breakout from a stock poking above resistance and failing. The kind of long base William O’Neil described in his model-book work tends to form while a business story coils under a beaten-down price.
By 17 December the stock had closed at 13.50, already 62 percent above the entry, and there was an opportunity to add into that strength. Building on a winner that keeps proving itself is the core of pyramiding into a position, and this early add still had most of the move ahead of it.
Descartes in 1999: a supply-chain software name in the right place
Descartes Systems Group built software for logistics and supply-chain management, the plumbing that moves freight and orders between companies. Founded in Waterloo, Ontario in 1981, it had traded in Toronto since its 1998 offering and first listed on Nasdaq under DSGX in 1999, opening the shares to U.S. buyers right as the internet trade heated up.
The company’s filings from that period don’t give a clean quarterly earnings series to quote here, so this study leans on price and volume rather than reported EPS. Descartes would later shift to a subscription model in 2001, an early software-as-a-service move in logistics, but in late 1999 investors were simply paying for growth in an internet-connected supply chain.
The tape in late 1999: a market that paid for momentum
The backdrop did a lot of the work. From October 1999 into March 2000, the Nasdaq went nearly vertical as money crowded into technology, internet, and software shares. In that tape, a small logistics-software name clearing a long base had the wind behind it, and strength kept feeding strength.
That’s the environment a base breakout likes: leaders run furthest when the broad market is trending up and rewarding risk, which is exactly what late 1999 did. From the 10.25 clearance, DSGX more than tripled again by late February, closing at 37.75 on 22 February.
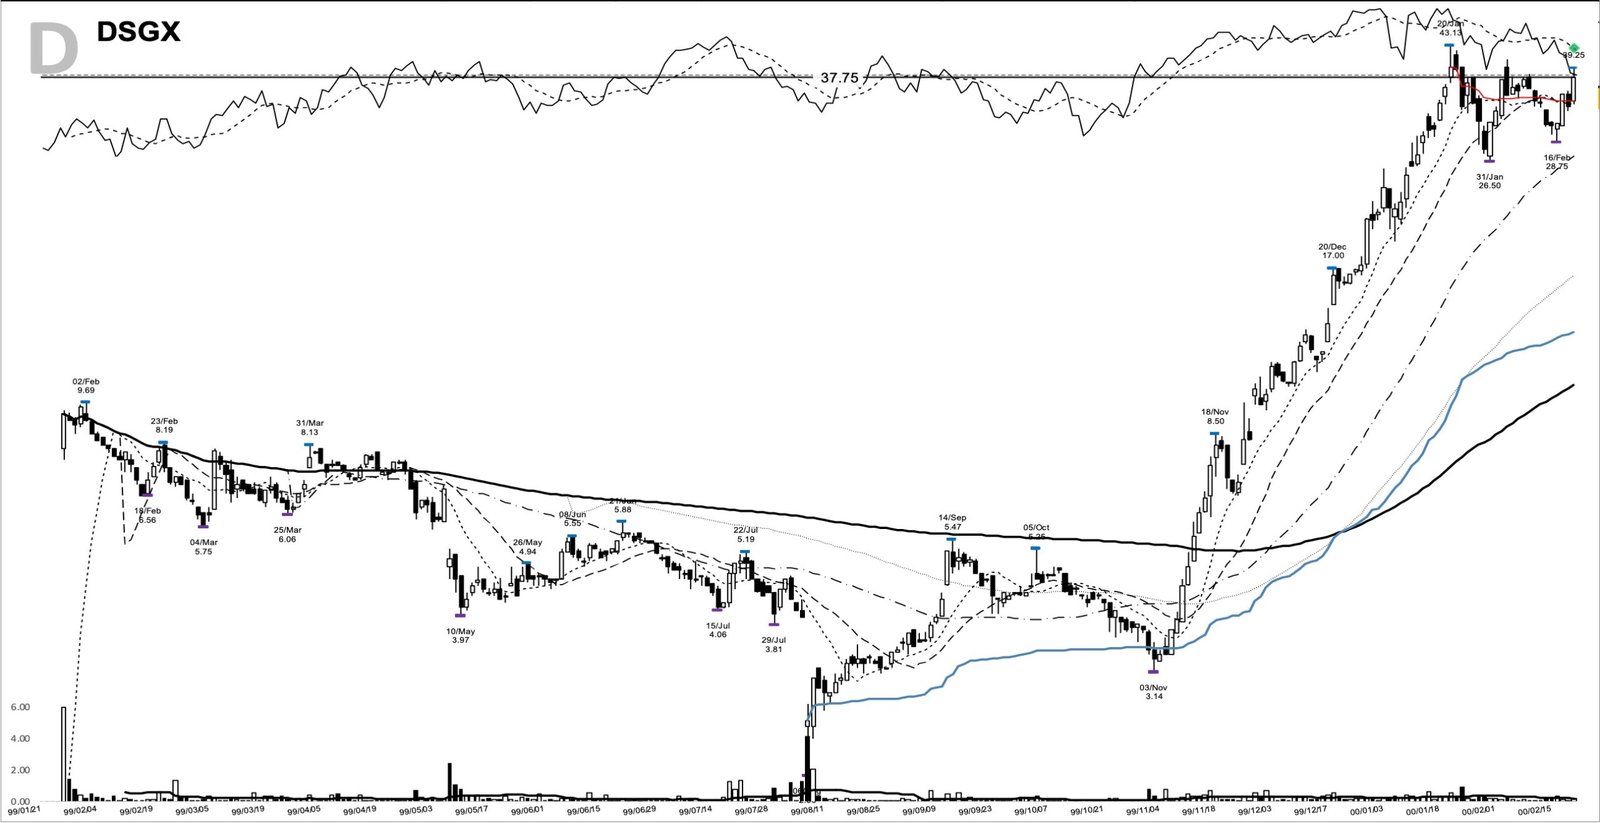
That second add on 22 February sat more than 350 percent above the entry, but it came with under 10 percent of the total move still ahead. A late add like that still rides the trend, and the reward against the risk had thinned to almost nothing.
Building a watch plan before the pivot cleared
Could a trader have seen this coming before the pivot cleared? The preparation is in the structure. Into the entry, DSGX had closed above its 10-day moving average for 14 straight sessions, and the close sat 17.6 percent above that 10-day line. The 10-day was near 7.07, the 20-day near 5.44, and the 50-day near 4.80, so the short-term averages had turned up and fanned out in the right order. A stock reclaiming its rising averages after a long base is exactly the setup trend following is built to catch.
The anchors were clean: the base low at 2.03 from 6 August, the base high and pivot both 8.50 from 18 November, and the last shelf low at 6.56 on 24 November. Those three levels frame the plan. Enter on a close above the 8.50 pivot. Set the initial stop below the 6.56 shelf, or below the 2.03 base low for a wider read, since that’s where the structure fails. Then trail the 10-day moving average up, widening to the 20-day once the move is well advanced.
That plan differs from the study entry in one way that matters. It waits for a close above 8.50. The study entry on 26 November came before that, on the intraday spike that closed back at 8.31, below the pivot. The anticipatory entry sat closer to the shelf, so the stop was tighter, but it risked the pivot never clearing at all. The patient version bought the confirmed 10.25 close on 30 November, higher but proven.
How the DSGX move played out into March 2000
A trader using this pattern would have been watching one thing after the 30 November clearance: does the stock hold its rising 10-day line and keep printing higher highs? For four months, it did. From the 10.25 close above the pivot, DSGX ran with only shallow pullbacks, clearing 20 dollars by year-end and 30 dollars in mid-January 2000.
The peak came on 10 March 2000, when the stock printed 91.61 intraday, more than ten times the entry close. That top lined up almost exactly with the Nasdaq’s own high, and then the trend broke. The marked exit closed the move on 30 March at 41.50, up 399 percent from the entry over 125 calendar days.
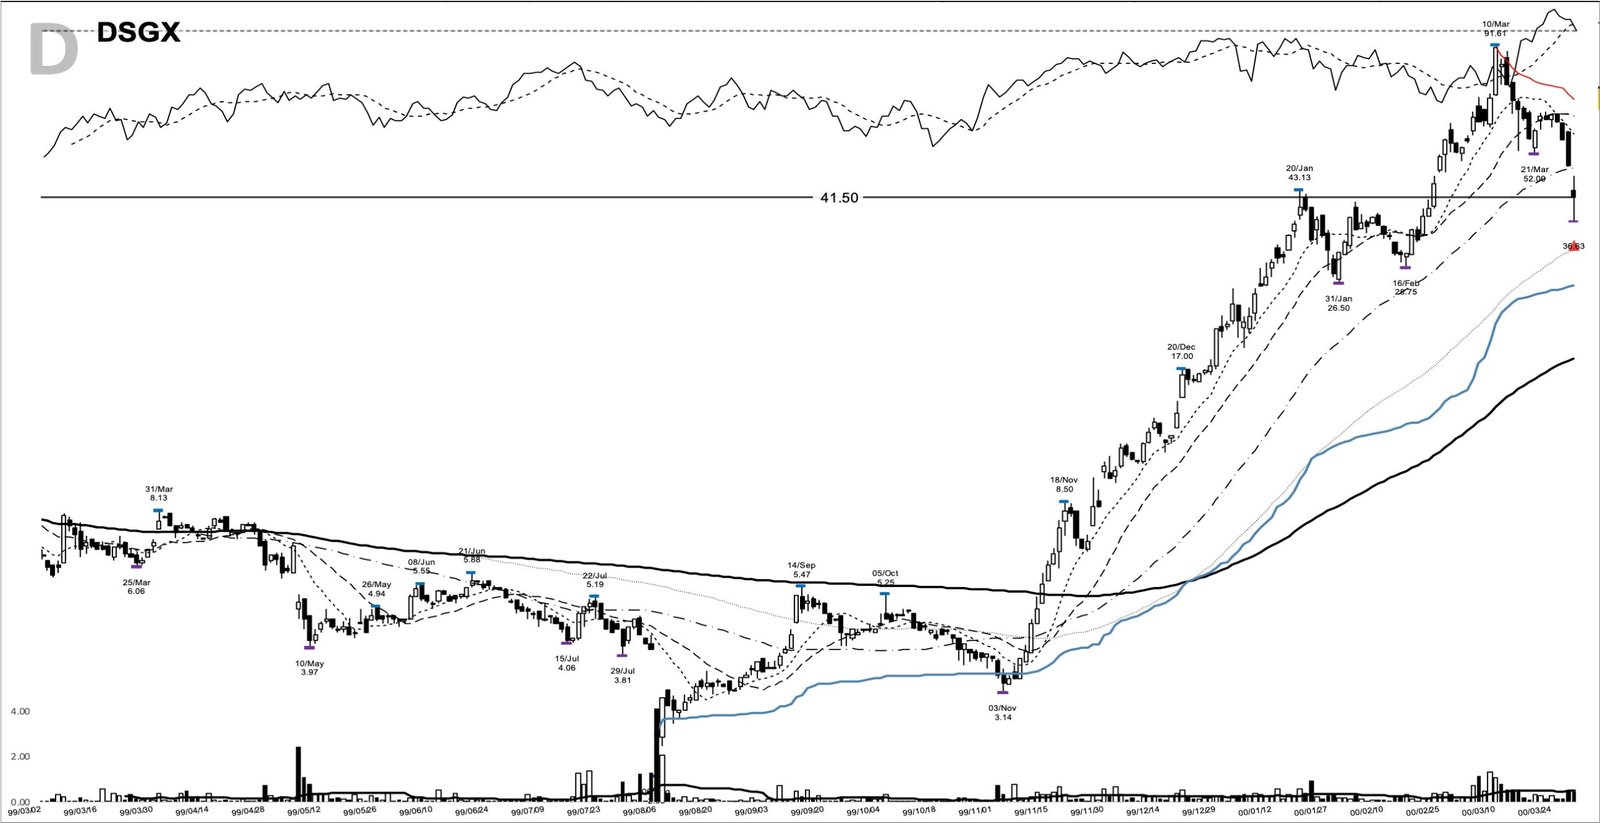
The exit tells its own story. At 41.50 it banked a large gain, but that was less than half the 91.61 peak. Trailing a moving average keeps you in a trend for the bulk of the move and gets you out well after the top, never at it. On this trade, a thousand dollars riding the full run from entry to exit would have become about $4,992.
Where the DSGX setup could have fooled you
The first trap is the entry bar itself. A 9.69 intraday high above the 8.50 pivot looks like a breakout in real time, but the close settled at 8.31, below it. Buying that spike meant buying before the base had resolved. The confirmation was the 30 November close at 10.25, and it paid to wait for it.
The second trap is the volume. The entry day traded just 1.1 times its 20-day average. A breakout on quiet volume is a weaker signal than one on expanding volume, and here the demand didn’t show up until the clearing day. Reading that entry bar as strong participation would have been a misread.
The third trap is survivorship. This is one chart that worked, pulled from an archive of past winners. For every deep base that ran 399 percent, others broke down and never came back. The pattern sets up a favorable trade, it doesn’t promise the outcome, and the stop below 6.56 defines the risk when it fails. Keep survivorship bias in view whenever you study a chart that already won.
Learn the base, wait for the pivot
The DSGX chart rewards patience in two places. Wait for the base to clear the pivot on a closing basis, and wait for the trend, not a price target, to tell you it’s done. The entry-day spike to 9.69 was noise. The 10.25 close above 8.50 was the signal, and the four-month trend that followed was the trade.
Learn the pattern. Ride the trend. Keep the gains.
Related studies: INCY base breakout, 1999, MSTR base breakout, August 1999, and NTAP base breakout, August 1999. A new winner study lands most evenings.
Price and volume figures are computed from split-adjusted daily OHLCV data; company figures come from SEC filings where cited.
Educational content only. Not investment advice. Trading involves risk. You are responsible for your decisions.
Get the free Market Wisdom e-book
Join Trends and Breakouts — historical winners, breakout studies, and risk lessons. No spam, unsubscribe anytime.