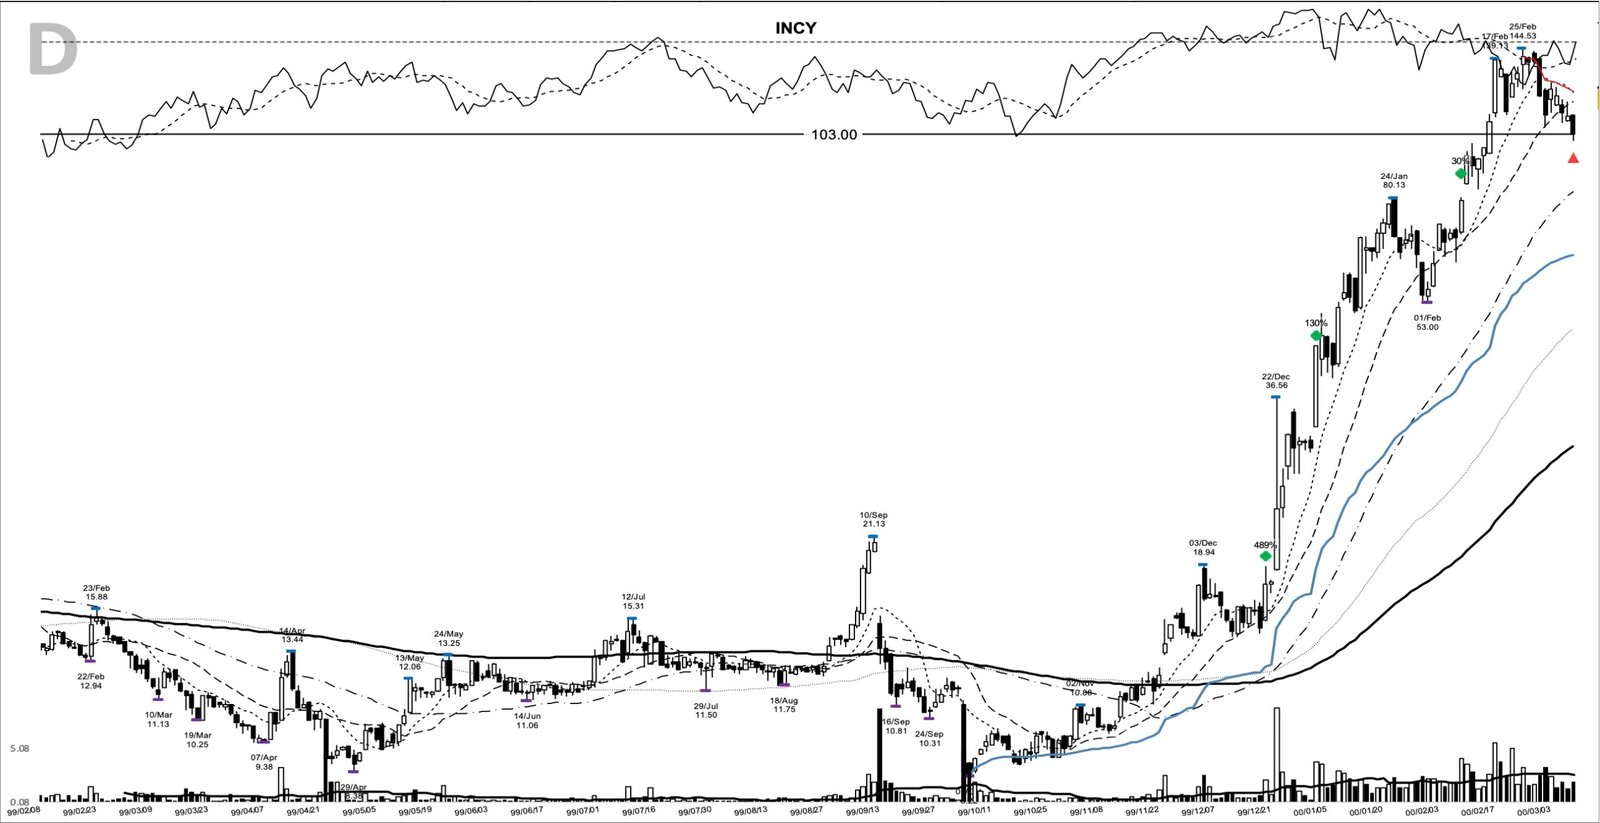
By late July 2026, INCY is back near the top of the day’s gainers list as Incyte heads into its Q2 2026 earnings report, and that is reason enough to pull an old chart. Incyte’s December 1999 run is one of the cleanest base-breakout examples in the archive. This INCY study marks its entry at a 17.50 close on 20 December 1999 on volume 2.3 times its 20-day average, just under the 18.94 pivot, then covered the ground to a 103.00 exit in 80 calendar days, a 489% gain in a market-leading genomics stock.
For a trend follower, the lesson lives in what came after that first entry. Most of the move belonged to riding a leader and adding into strength while the theme stayed hot.
Key takeaways from the INCY run
- The pattern: a deep six-month base, roughly 61% from a 21.12 high to an 8.22 low, with the study entry marked at a 17.50 close on 20 December 1999, just under the 18.94 pivot.
- The move: a 103.00 exit on 9 March 2000, a 488.6% gain across 80 calendar days, with a 144.53 peak on 25 February.
- Entry-day volume ran 2.3 times the 20-day average, the demand signature that separates a real move from drift.
- Two add-on points, at 44.83 in early January and 79.50 in February, let a trend follower pyramid into confirmed strength.
- Risk anchored to the base, and the biggest gains came from holding and adding once the trend proved itself.
The trade at a glance
| Field | Value |
|---|---|
| Ticker | INCY |
| Study entry date (anticipatory) | 20 December 1999 |
| Entry close | 17.50 |
| Pivot | 18.94 |
| Pivot cleared | 22 December 1999 at a close of 23.59 |
| Volume vs 20-day average | 2.3x |
| Exit date | 9 March 2000 |
| Exit close | 103.00 |
| Gain | +488.6% |
| Calendar days held | 80 |
| Peak before exit | 144.53 (25 February 2000) |
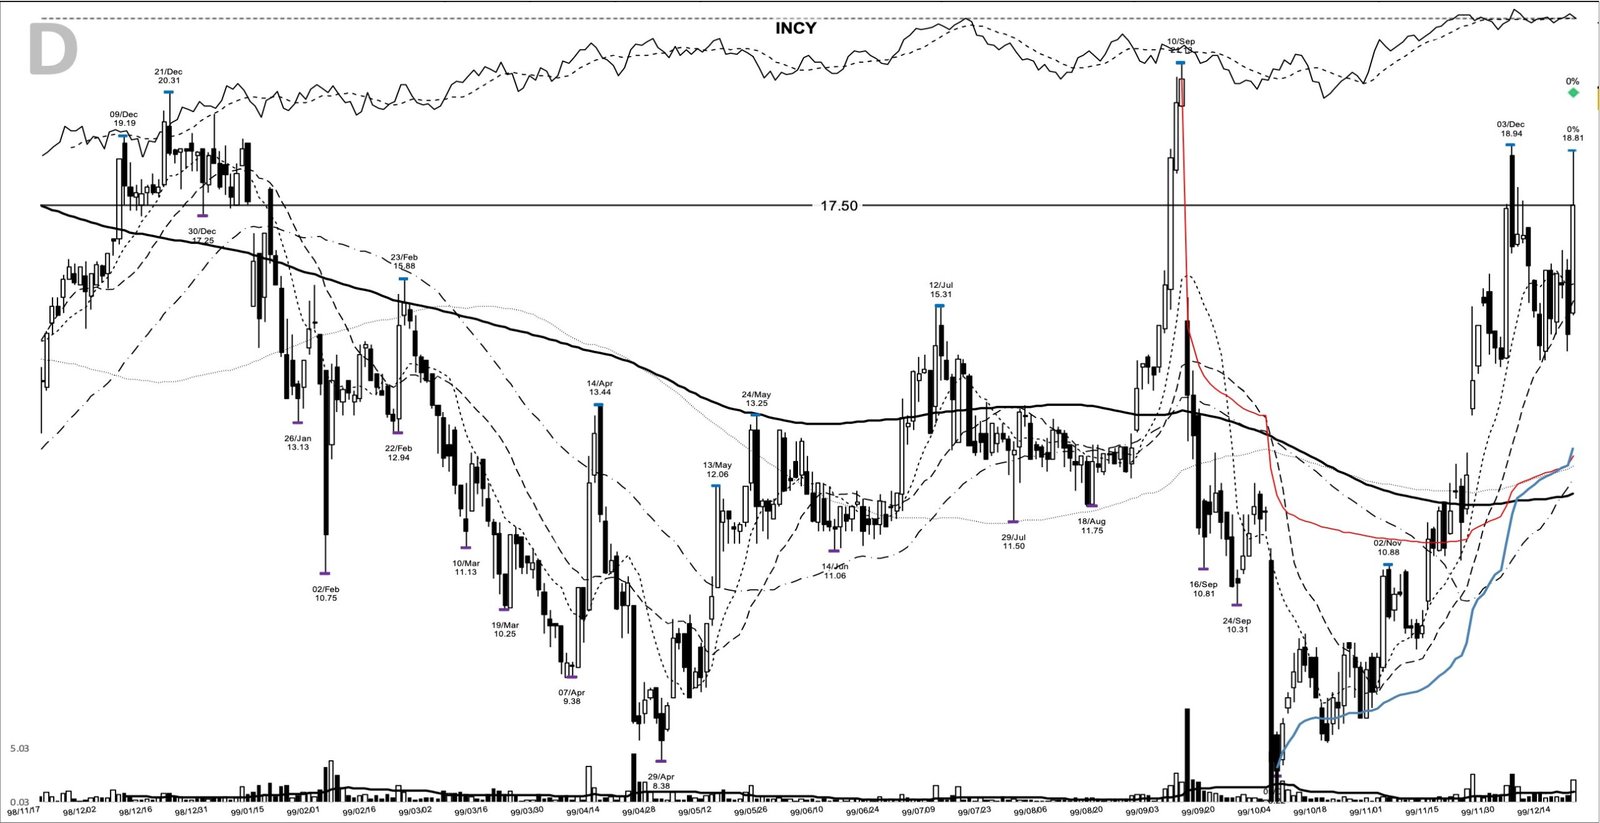
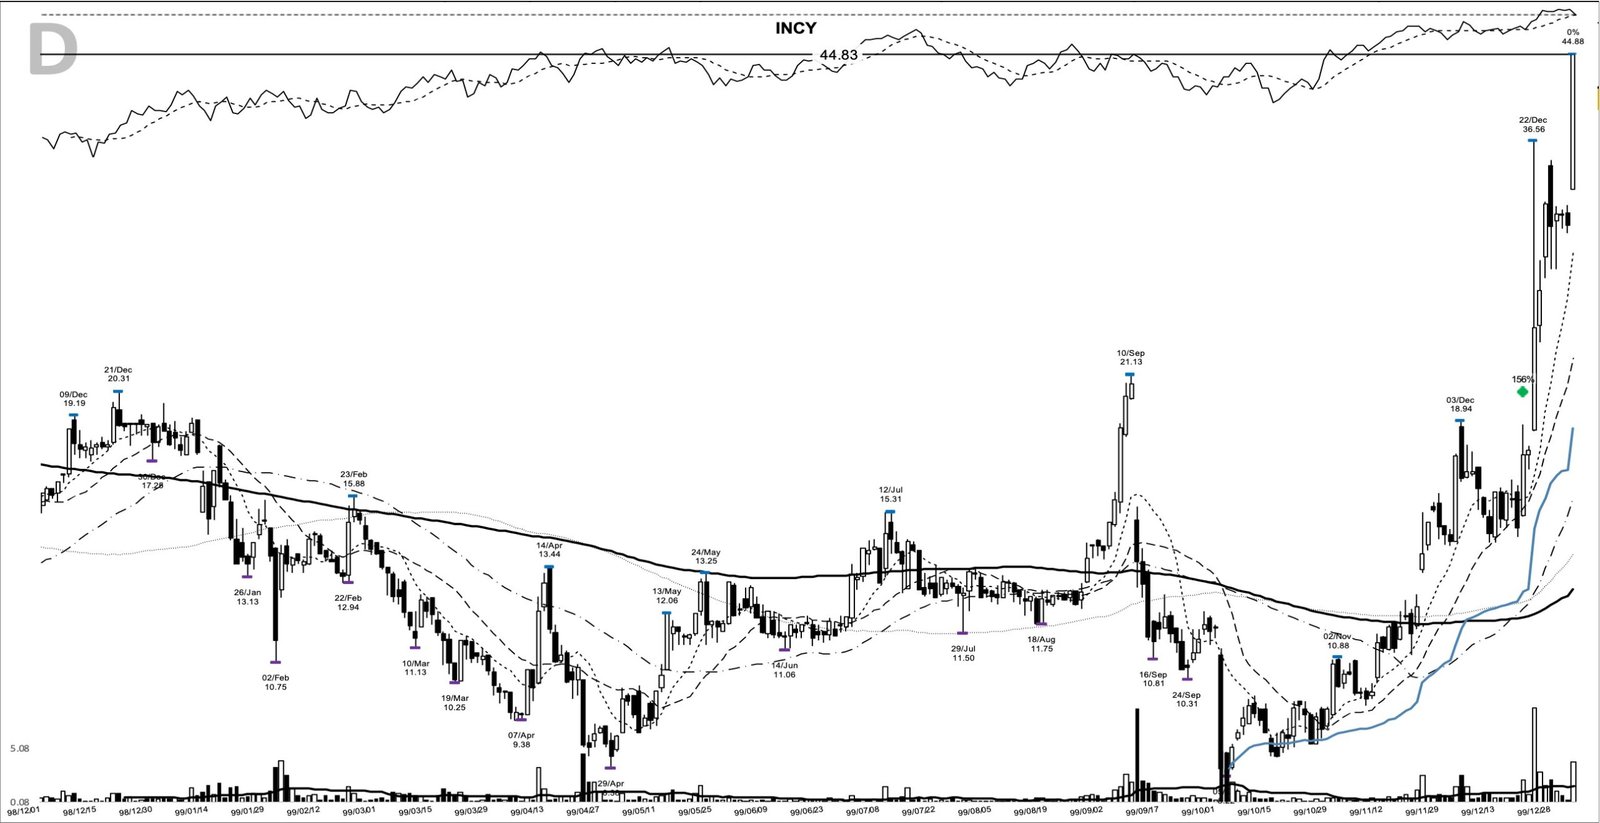
The chart below comes from my study archive. It runs from late 1998 into the December 1999 breakout, so the whole base is visible, from the September top to the December break.
Anatomy of the INCY base breakout
The base started with damage. Price topped at 21.12 on 10 September 1999, then broke hard to an 8.22 low by 5 October, a drop of about 61%. That’s a deep base, far deeper than the shallow cup the textbooks like, and depth matters: a base that steep fails more often than it launches. What made this one worth watching was the repair. Over the next two months the stock climbed back toward its old highs and rebuilt a moving-average stack.
By the entry, the 10-day average sat at 15.78, above the 20-day at 15.43, above the 50-day at 12.20. That is the posture you want under a leader: the fast lines over the slow ones, the slow one turning up. The pivot to clear was the 18.94 high from 3 December. On 20 December, INCY opened at 15.19, ran to an 18.81 high, and closed at 17.50 on 2.14 million shares, 2.3 times its 20-day average. Notice the close finished just under the 18.94 pivot, not through it. That marks this as an anticipatory entry, taken ahead of the 18.94 pivot, which did not clear until 22 December at a 23.59 close.
The decisive clearance came two sessions later. On 22 December the stock gapped and ran to a 36.56 high, closing at 23.59 on nearly 8.8 million shares. From there the base was behind it.
Incyte in 1999: selling the genome by subscription
Incyte had a real product behind the move. It ran the leading commercial genomics database of the era, LifeSeq, and sold subscriptions to more than fifty pharmaceutical research sites worldwide. During this window the company even changed its name from Incyte Pharmaceuticals to Incyte Genomics to match where the market’s attention had gone. By industry classification at the time, it was simply a pharmaceuticals name.
The fundamentals came with a catch worth respecting. When Incyte reported the December 1999 quarter in early 2000, during the advance, revenue had grown to $46.0 million from $36.6 million a year earlier, though the company still ran a net loss of $6.4 million, per its SEC filing. This was a revenue-growth and narrative story, so a screen that demanded rising EPS would have thrown the name out. A trend follower reads that kind of leadership off the tape, not off an earnings line.
The genomics mania behind the move
Context carried this trade as much as the base did. Late 1999 and early 2000 were the peak of the genomics craze, with the public Human Genome Project racing Celera to map human DNA and money pouring into anything with a gene-sequencing angle. The broader tape rewarded exactly this kind of high-beta leadership right up to the top.
That backdrop also dates the exit for you. The 103.00 close on 9 March 2000 landed the day before the Nasdaq’s dot-com peak. Leaders tend to top with the market that carried them, and INCY did. A trend-following approach has one job here, stepping aside once the trend that fed the move breaks, with no market-top forecast required.
Building the watchlist before the 18.94 pivot
Everything a trader needed to prepare for this was on the chart before the breakout. The base gave three anchors: the 18.94 pivot from 3 December, the 14.25 five-day shelf low from 13 December, and the 8.22 base low from 5 October, the level where the whole structure fails. The trend posture confirmed the rest, with the entry close sitting 10.9% above a rising 10-day line after the stock reclaimed it.
The relative-strength line did real work here too. Reading the relative strength line against the market told you this genomics leader was outrunning the tape into the pivot, which is what you want before you commit. So is the volume expansion, and there are cleaner ways to grade a breakout candle than eyeballing it, covered in reading volume.
Put it together and the plan a trend follower could have written that morning is plain. Enter on a push above the 18.94 pivot. Set the initial stop below the 14.25 shelf, or below the 8.22 base low for a wider version that only fails if the whole base gives out. Then trail the 10-day average at 15.78, widening to the 20-day at 15.43 once the move is well advanced. Adding into strength is its own skill, and position sizing is where the pyramiding decision lives.
How the 80-day run unfolded
A trader using this pattern might have watched for a decisive close back above the 18.94 pivot on expanding volume, then treated a close back under the 14.25 shelf as the sign the base had failed. Neither warning came. What came instead was a run.
From the 17.50 entry close, the chart offered two spots to add into confirmed strength. The first was 3 January 2000 at a 44.83 close, already up about 156% from the entry. The second was 9 February at a 79.50 close, up roughly 354%. Both were higher than the entry, which is the point: a trend follower adds where the move proves itself, not where it looks cheap.
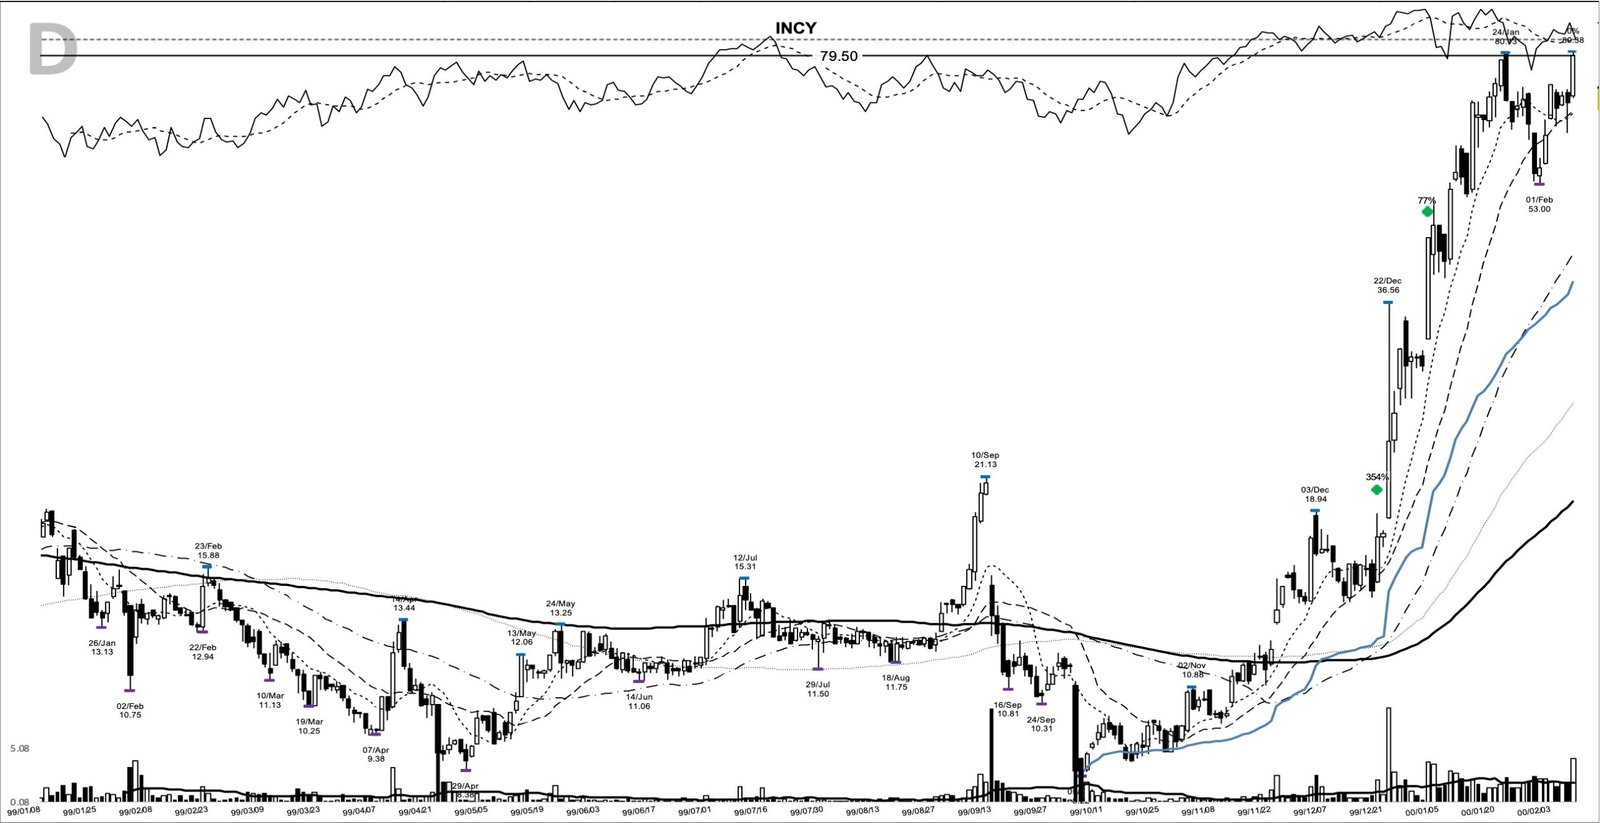
The stock peaked at 144.53 on 25 February, up about 726% from the entry close. The exit came at 103.00 on 9 March, closing the move 488.6% above the entry across 80 calendar days. On that arithmetic, $1,000 riding the full move would have become about $5,886. Educational framing matters here: this is a past chart retold to teach a pattern, never a recommendation.
Where this INCY breakout could have fooled you
The setup carried real traps, and naming them is how the pattern earns trust. The entry day itself closed at 17.50, below the 18.94 pivot, so a rule that demanded a clean closing break above 18.94 would have kept you out until the 22 December gap and paid a much higher price to get in. Waiting for confirmation costs something, even when it’s the right call.
The exit is the other honest lesson. The 103.00 close was about 28% below the 144.53 peak, so the pattern never promised you’d sell the high. It promised a way to ride most of a trend and give back a slice at the end. And that 61% base depth cuts both ways. The same steepness that made the recovery powerful is the steepness that fails more setups than it launches, which is exactly why the 8.22 base low mattered as an invalidation.
Learn the leader, not the legend
INCY in late 1999 is a compact lesson in how a leader pays. The base built the risk anchor, the 2.3x-volume expansion confirmed demand, and the trend did the heavy lifting once you let it. The parts a trader controls are the pivot, the stop, and the discipline to add into confirmed strength as it appears. The rest belonged to the tape. Much of this is the model-book work that William O’Neil built a method around.
Learn the pattern. Ride the trend. Keep the gains.
Related studies: Weinstein stage analysis for reading a base into a Stage 2 advance, trend following for the exit discipline, and William O’Neil for the leadership template. A new winner study lands most evenings.
Price and volume figures are computed from split-adjusted daily OHLCV data; company figures come from SEC filings where cited.
Educational content only. Not investment advice. Trading involves risk. You are responsible for your decisions.
Get the free Market Wisdom e-book
Join Trends and Breakouts — historical winners, breakout studies, and risk lessons. No spam, unsubscribe anytime.