In the spring of 2023 Carvana looked finished. The stock had fallen from the mid-teens to 71 cents inside a year, and most of the tape had left it for dead. Then it stopped falling. It built a base along the lows, and on 1 June 2023 it pushed through the shelf it had been coiling under. That day is the CVNA base breakout worth studying, and the ticker is back on traders’ screens this week after Carvana’s latest quarterly report landed on 29 July. Here’s the whole arc in one line: a base breakout that closed at 3.16 on 1 June 2023 and ran 176.6% over the next 111 days.
Key takeaways from the CVNA base breakout
- The pattern: a multi-month base built above the 7 December 2022 low of 0.71, resolved when price cleared the 2.81 pivot on 1 June 2023.
- The move: the breakout closed at 3.16, the run peaked at 11.44 on 20 July 2023, and the exit at 8.74 booked 176.6%.
- Volume did the confirming. The 1 June session traded roughly 250 million shares, about twice the 20-day average.
- Two follow-through points, 10 July and 28 August, offered later entries into an advance that was already established.
- The lesson: a base breakout is a price-and-volume signal, and here it led a still-unprofitable turnaround, so a trailing stop, not the story, defined the exit.
The trade at a glance
| Field | Value |
|---|---|
| Ticker | CVNA |
| Breakout date | 2023-06-01 |
| Breakout close (entry reference) | 3.16 |
| Volume vs 20-day average | 2.0x |
| Exit date | 2023-09-20 |
| Exit close | 8.74 |
| Gain | 176.6% |
| Calendar days | 111 |
| Peak before exit | 11.44 (2023-07-20) |
Reading the 1 June breakout chart
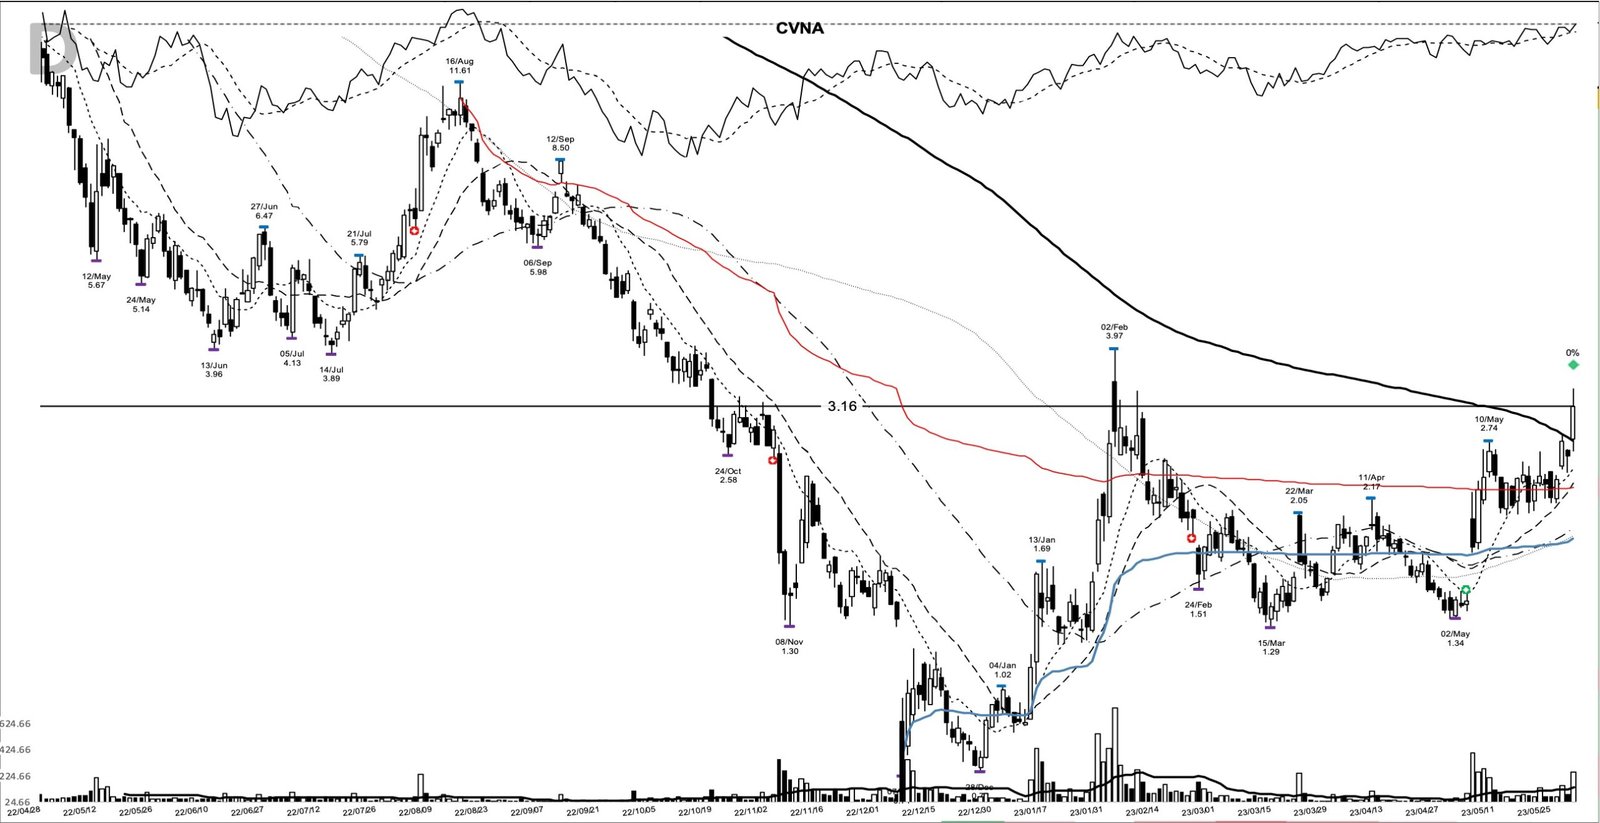
The charts here come from my study archive. The daily view puts the whole story on one screen: the 2022 collapse, the December washout that printed 0.71 on record volume, and the long stabilisation that followed. The horizontal marker sits at 3.16, the breakout close, and it’s the price every figure in this study is measured from.
Anatomy of a base breakout off the lows
A base breakout is simple to state and hard to sit through. Price grinds sideways for months while sellers exhaust themselves, then clears the top of the range on expanding volume. On this chart the base ran roughly six months, from the 7 December 2022 low at 0.71 up to the 2 February 2023 spike high of 3.97, a range about 82% deep. That depth is the tell that this was a wreck, not a shallow pullback.
The pivot that mattered for the 1 June entry was tighter than the whole base. Price had carved a shelf whose 20-day high sat at 2.81, printed on 30 May. On 1 June the stock opened at 2.76, ran to 3.386, and closed at 3.16, clearing that 2.81 pivot on volume near 250 million shares, roughly 2.0x the 20-day average. The volume expansion on the breakout candle is what separates a real move from a drift through resistance. You want the crowd showing up on the day the level gives way.
One honest caveat sits on the same chart. The 3.16 close cleared the recent shelf, but the February high at 3.97 was still overhead. This was an early breakout from a shelf inside the larger base, so it wasn’t a clean break of the whole structure yet. That distinction matters for where a stop belongs, and we’ll come back to it.
What Carvana’s business looked like into the entry
The fundamentals weren’t a growth-stock highlight reel, and pretending otherwise would miss the point. The most recent quarter on file at the entry, the first quarter of 2023, showed revenue of about 2.61 billion dollars, down 25.5% year over year, with a loss of 1.51 per share. Revenue had already turned negative year over year in the third quarter of 2022, down 2.7%, after running at double digits through 2021. Losses were narrowing from the prior year’s 2.35 and 2.67 per share, so the trajectory was improving, but this was a company still bleeding and still shrinking on the top line.
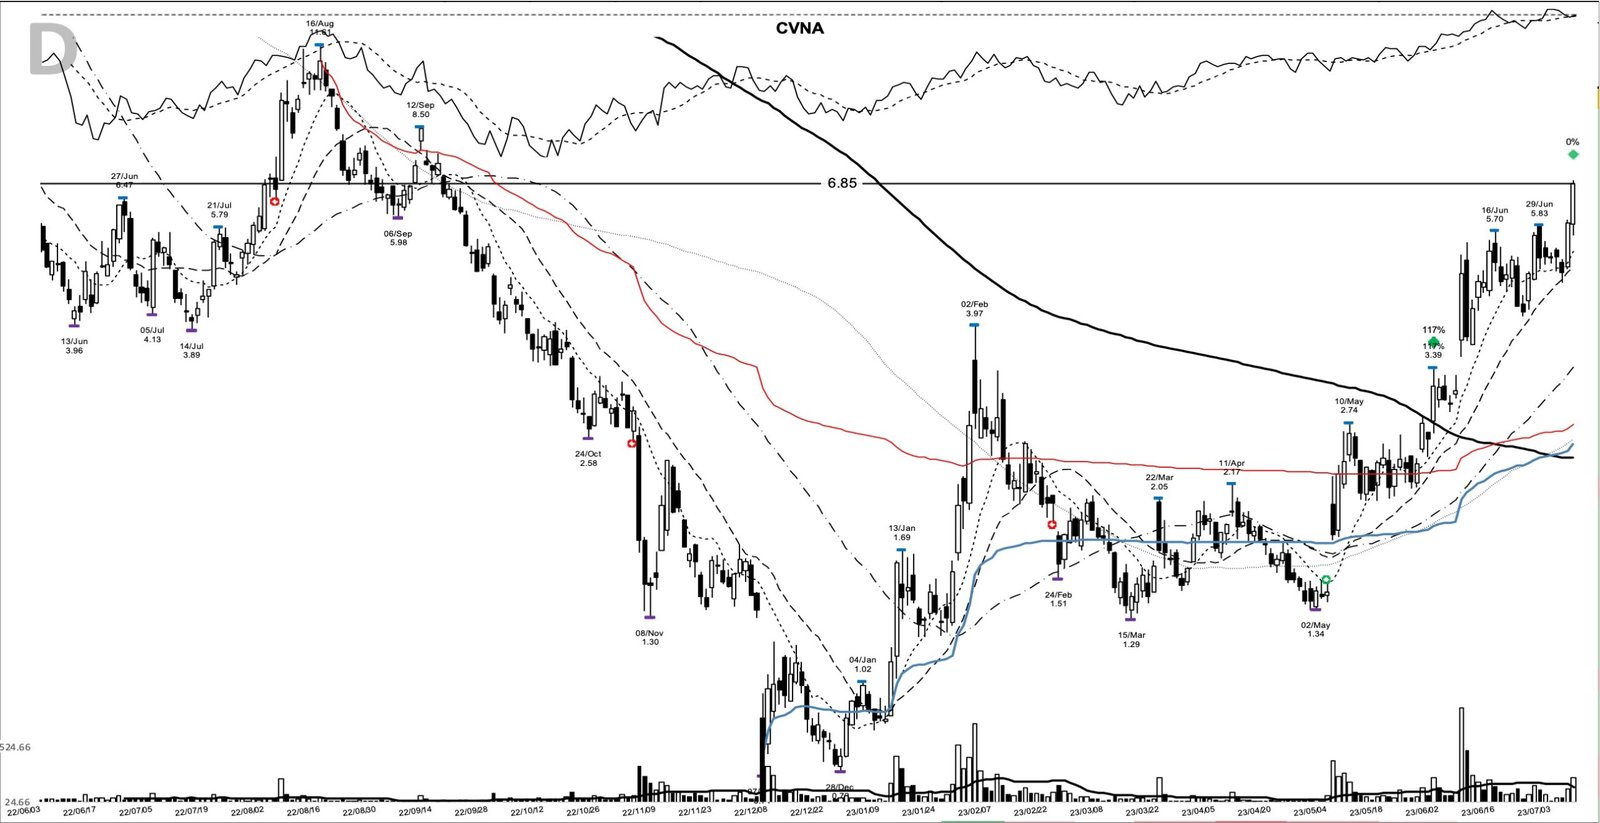
What the tape was pricing was survival, not sales growth. On 19 July, Carvana announced an agreement with noteholders to cut its debt load and lower near-term cash interest, alongside a strong preliminary read on the quarter (per Carvana’s 19 July 2023 release and CNBC’s same-day coverage). That’s the balance-sheet turn the base breakout was front-running. For a trend follower the point is that the classic base breakout works on price and volume first, and the story can be a recovery bet rather than an earnings ramp.
The tape that rewarded the breakout
Context helped. The first half of 2023 was one of the stronger stretches for US equities, with the Nasdaq posting its best first half in about four decades as risk appetite returned. A rising tape doesn’t make a breakout work, but it makes follow-through more likely. CVNA broke out into a market paying up for strength, exactly the backdrop trend following wants behind a fresh signal.
Underneath that headline strength, though, the 2023 tape was narrow and selective, the kind of market where full exposure off the index chart alone made little sense and the job was to pick the handful of names actually working. A volume-confirmed breakout from a year-long base was precisely the kind of spot worth picking, and the tight shelf stop respected how unforgiving that tape was to anything that slipped.
How a trader could have prepared for the 1 June signal
By the entry, the trend posture was already constructive. Price closed above its 10-day moving average for four straight sessions into the pivot, and the short-term averages were stacked in order: the 10-day near 2.45, the 20-day near 2.32, and the 50-day near 1.93. The 3.16 close sat about 29% above that 10-day line, which is the first warning we’ll cover under misreads.
The watchlist work is the repeatable part. A base this long and deep, above a washout low that held, with the moving averages turning up and volume drying into the shelf, is the profile you flag before the break, not after.
Here’s the plan a trend follower could have written that day, every number from the chart. Enter on strength above the 2.81 pivot. Set the initial stop below the 2.13 shelf low from 25 May, with the December base low at 0.71 as the deeper line where the whole structure fails. Then trail the 10-day moving average, widening to the 20-day once the move is well advanced, and let the exit be a level rather than an opinion. Sizing follows the stop distance, which is why position sizing gets decided before the entry, not during the run.
How the CVNA breakout actually played out
A trader using this pattern might have watched for the base high at 3.97 to give way next, and it did. On 8 June the stock gapped and closed at 4.846 on volume near 880 million shares, an expansion that cleared the February high and confirmed the larger base had broken. By 10 July the first follow-through point closed near 6.85, already up about 117% from the breakout close, with room to add into an established uptrend.
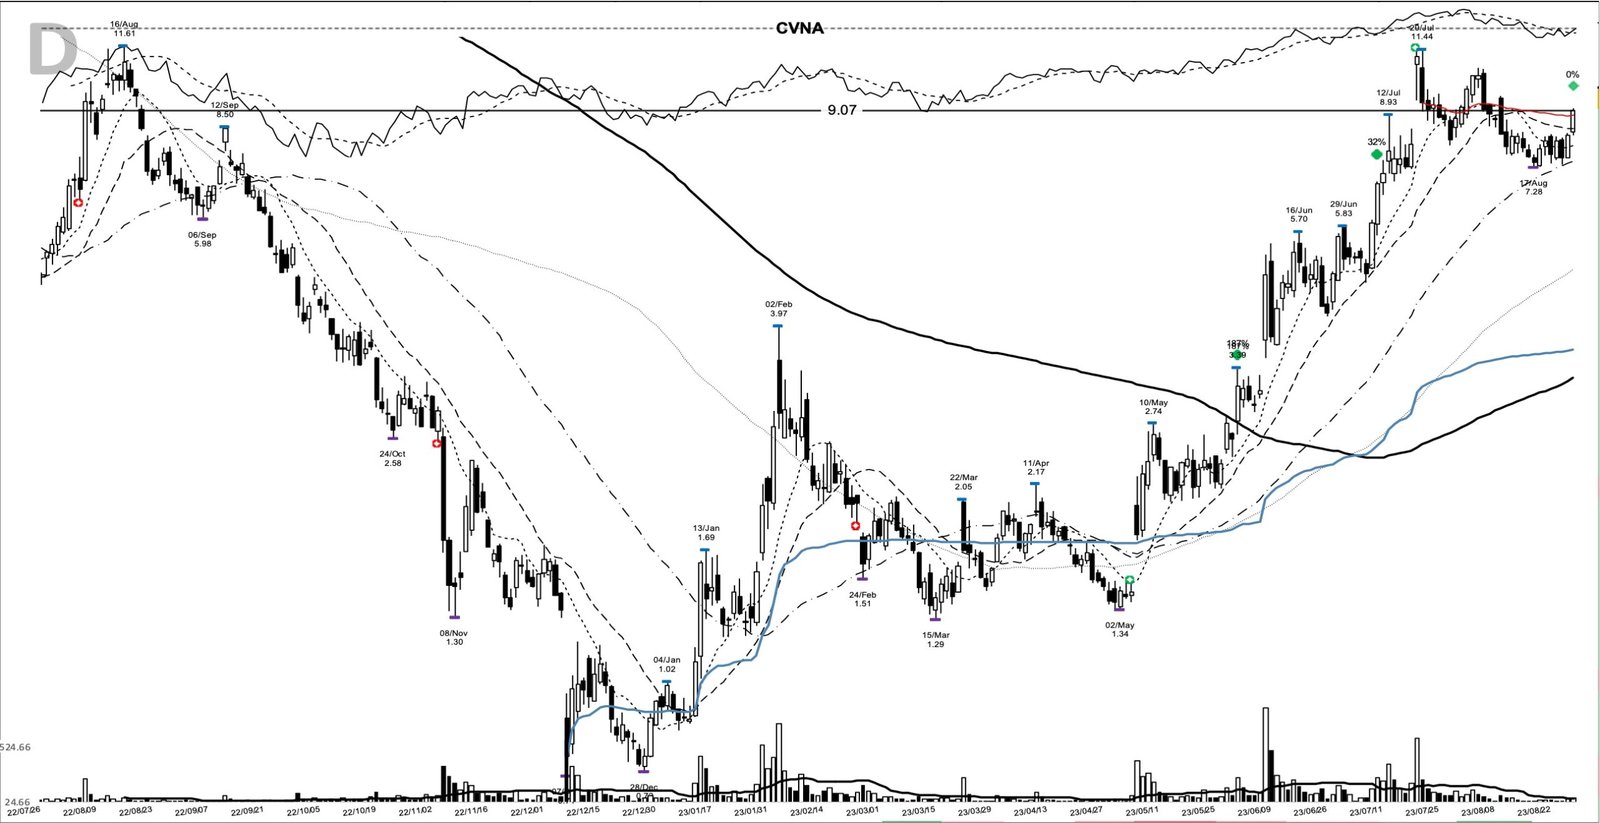
The peak came fast. On 19 July, the debt-deal session, the stock gapped again and closed near 11.16 on heavy volume, then printed its high of 11.44 the next day, 20 July. That’s a peak gain of about 262% from the breakout close. The trend then rolled into a slower grind, and a second follow-through point on 28 August closed near 9.07, a higher base but already off the top.
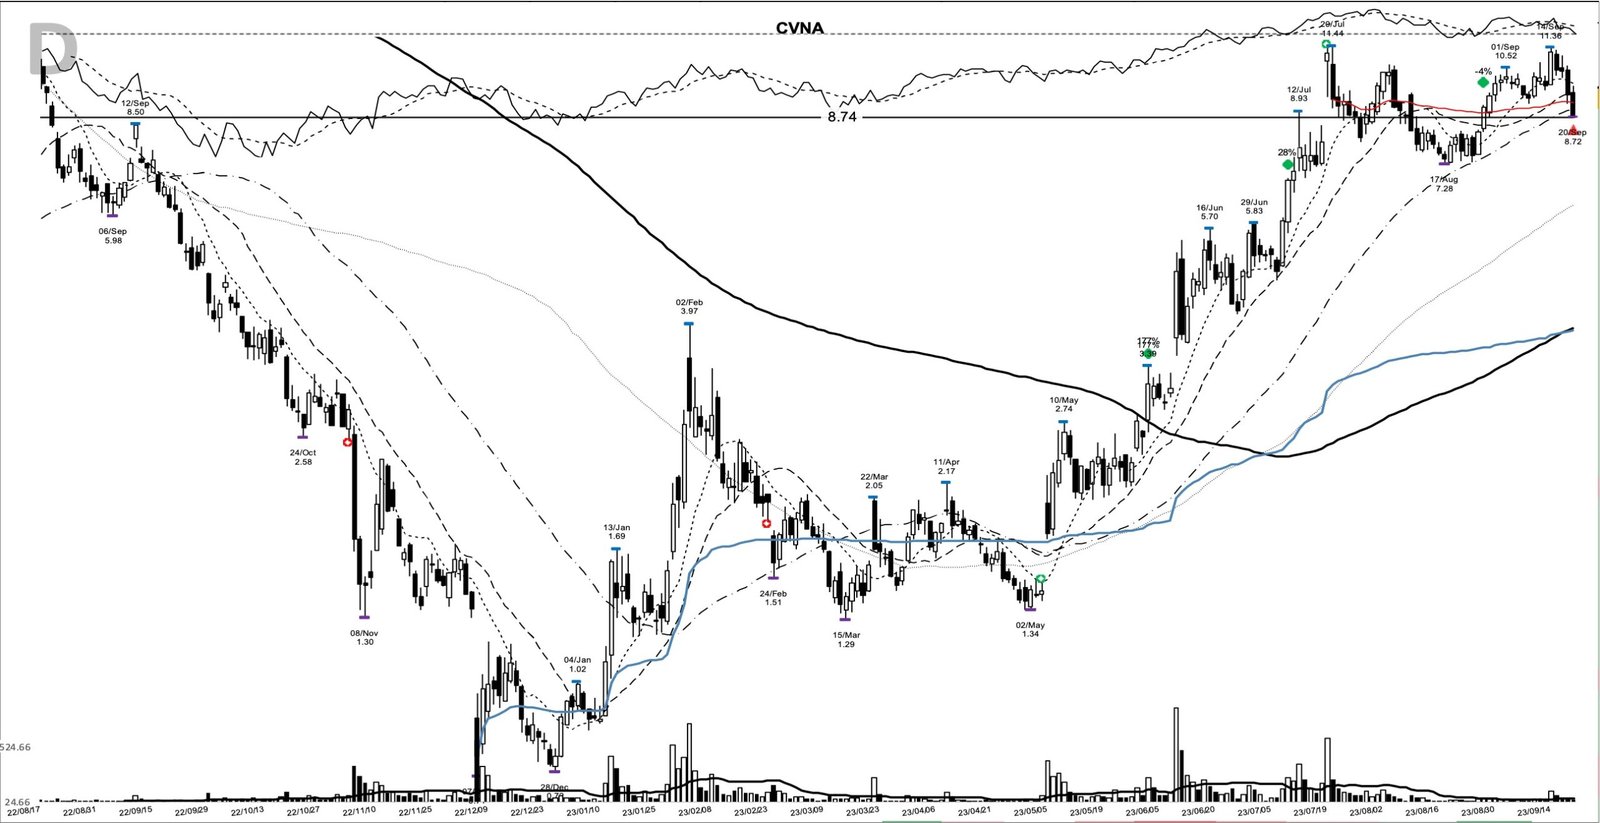
The exit lands on 20 September at a close of 8.74, closing the move 176.6% above the breakout close over 111 calendar days. Look at the gap between the 11.44 peak and the 8.74 exit. A trailing stop gives some of the top back by design, which is the price of never guessing the exact high. The study books the 176.6% the trend delivered, not the 262% that lived for a single day.
The calendar of that exit matters too. The same week, Fed-day selling tipped the broader market into a correction after weeks of lower highs and thinning breadth, and the working advice was to shrink risk and sit out rather than force long exposure. A trailing stop that hands back the top of the move looks generous right up until the tape turns like that; then it looks like the whole method.
Where this base breakout is easy to misread
The first trap is chasing. The 1 June close was already about 29% above its 10-day average, so buying the intraday high near 3.386 meant paying up into a stretched move. The next few sessions pulled back, and a stop set tight under the breakout day’s range would’ve been shaken out before the real advance began. The 2.13 shelf, not the day’s low, is the level that let the position breathe.
The second trap is reading the base breakout as an earnings bet. It wasn’t one. Revenue was down 25.5% year over year and the company was still losing money at the entry. The signal was price and volume plus a visible balance-sheet catalyst, and that mix can fail. A base that looks identical on a chart can dissolve if the recovery story doesn’t arrive.
The third is the one every winner study owes you. This is a single name pulled from the archive because it’s trending again, and a 71-cent stock carried real bankruptcy risk that a chart can’t show. Most beaten-down bases that look like this never break out and run. Studying winners without weighing the failures is survivorship bias, and it’s the fastest way to overtrust a pattern.
The signal, then the trail
CVNA in the summer of 2023 is a clean example of one idea: the chart can lead the fundamentals, and the trader’s job is to buy confirmed strength above a real pivot and let a trailing level carry the rest. The base breakout gave the entry at 3.16 above the 2.81 pivot. The trend gave the 176.6%. The stop, not a target, gave the exit. Learn the pattern. Ride the trend. Keep the gains.
Related studies: for the mechanics behind this setup, see the primer on reading volume, the support and resistance guide for how pivots form, and the CANSLIM base framework. A new winner study lands most evenings.
Price and volume figures are computed from split-adjusted daily OHLCV data; company figures come from SEC filings where cited.
Educational content only. Not investment advice. Trading involves risk. You are responsible for your decisions.
Get the free Market Wisdom e-book
Join Trends and Breakouts — historical winners, breakout studies, and risk lessons. No spam, unsubscribe anytime.