MGNI is back on traders’ screens this week, near the top of the day’s gainers list after Magnite’s early-August quarterly report. That’s a good reason to pull the chart that matters more: the MGNI base breakout of November 2020. On 4 November 2020, the day after the US election, the stock cleared a shelf it had been carving for months, closing at 10.08 just above the 10.03 pivot from 23 October. From that close it trended to 39.10 by early March 2021, a base breakout that returned 287.9 percent in 121 calendar days.
A move like that looks obvious in hindsight. The value is in reading what was actually visible on the chart the week it began, and what a trend follower could’ve done with it as it ran.
Key takeaways from the MGNI base breakout
- The setup was a long, deep base under a 10.03 pivot; the entry was a breakout close of 10.08 on 4 November 2020.
- The move ran 287.9 percent in 121 calendar days, from 10.08 to a 39.10 exit close on 5 March 2021.
- There were three points to add as the trend confirmed, on 18 November, 18 December, and 14 January, with the position up 19.6 percent, 130.7 percent, and 208.9 percent from the first entry at each.
- Price reached a 64.39 peak on 9 February 2021, up 538.8 percent, before giving ground into the exit.
- The lesson is that trailing a trend beat trying to call the top; the 39.10 exit sat well below the peak and still banked a large gain.
The trade at a glance
| Field | Value |
|---|---|
| Ticker | MGNI |
| Breakout date | 4 November 2020 |
| Breakout close (entry reference) | 10.08 |
| Volume vs 20-day average | 1.1x |
| Exit date | 5 March 2021 |
| Exit close | 39.10 |
| Gain | +287.9% |
| Calendar days held | 121 |
| Peak before exit | 64.39 (9 February 2021) |
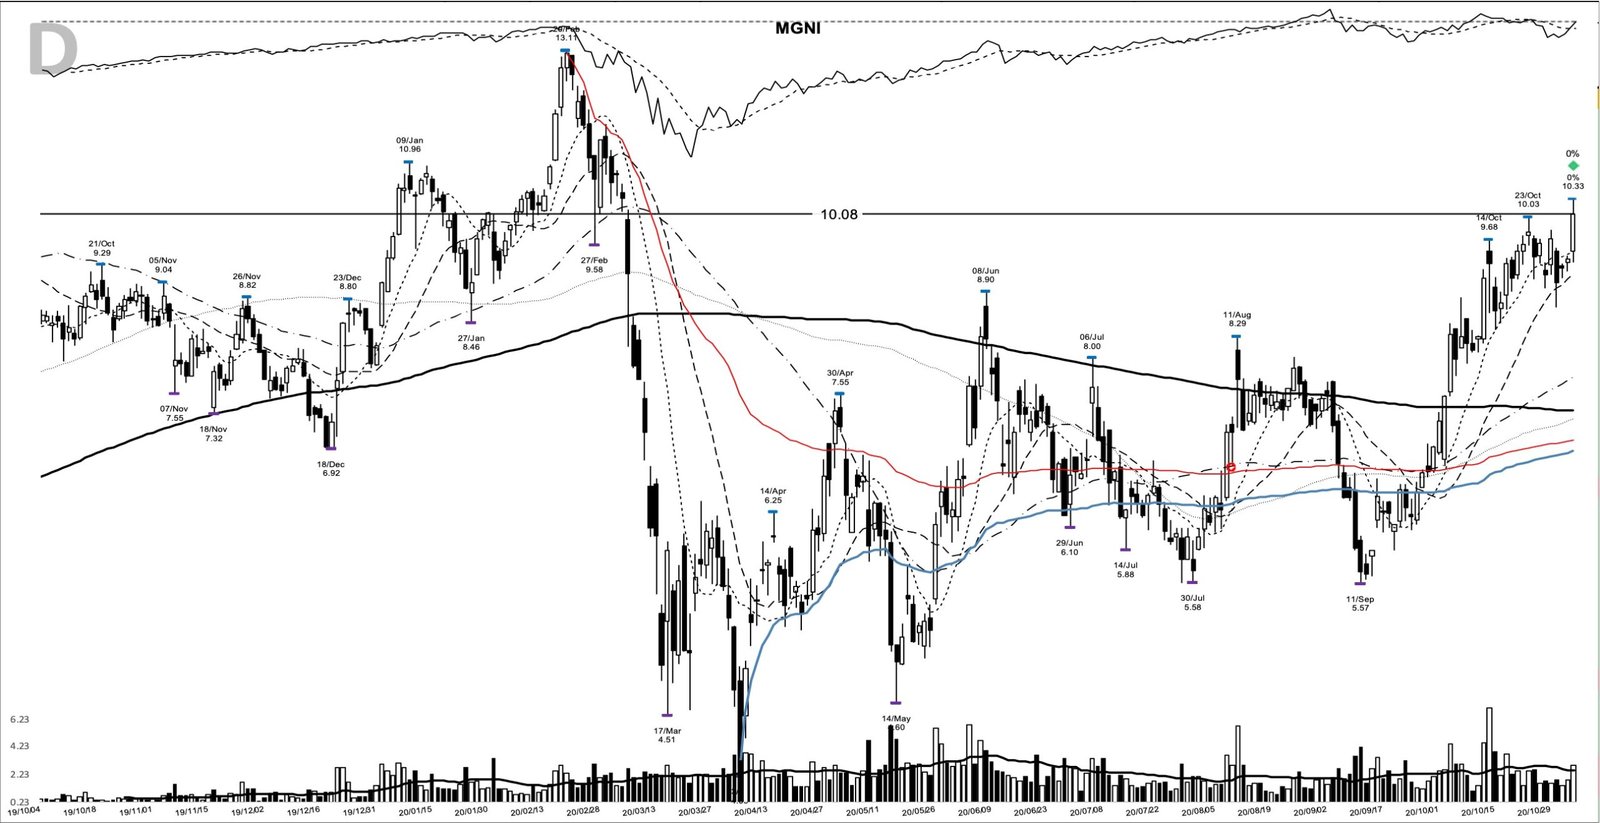
The chart below comes from my study archive, marked at the entry.
How the MGNI base breakout set up beneath 10.03
The base was long and it was deep. After a February 2020 high at 13.11 on 20 February, the stock fell with the whole market to a 4.09 low on 3 April, then spent roughly six months rebuilding from a 4.60 base low on 14 May. Measured from that low to the 10.03 base high, the structure was about 54 percent deep, the kind of wide base a beaten-down name carves on the way back.
Through late October the price coiled under 10. It set a shelf low at 8.68 on 30 October and kept failing against the 10.03 high from 23 October, which is what made 10.03 the pivot. The line to watch was clear before the breakout happened.
On 4 November the stock opened at 9.50, ran to a 10.33 high, and closed at 10.08, its first close out over the pivot. The one caution on the signal bar was volume: 2,828,920 shares, only about 1.1 times the 20-day average of 2,492,348. That’s a light print for a breakout, and it’s the first thing a careful reader would’ve flagged.
What Magnite was doing behind the breakout
The business was inflecting into the move. Magnite was the new name for the merger of Rubicon Project and Telaria, which closed on 1 April 2020; the ticker changed from RUBI to MGNI on 1 July 2020. The combined company billed itself as the largest independent sell-side advertising platform, with connected-TV advertising as the fast-growing piece.
The revenue line tells the story cleanly. Across the three 2020 quarters, sales climbed from 36.3 million dollars to 42.3 million dollars to 61.0 million dollars, the last being the quarter ending 30 September 2020 and the first full period to reflect the combined company. Over the same stretch the quarterly loss narrowed, from 0.36 dollars per share in the June quarter to 0.10 dollars in the September quarter. That third-quarter report landed in early November, right on top of the breakout. This is the sort of accelerating leader William O’Neil built a method around.
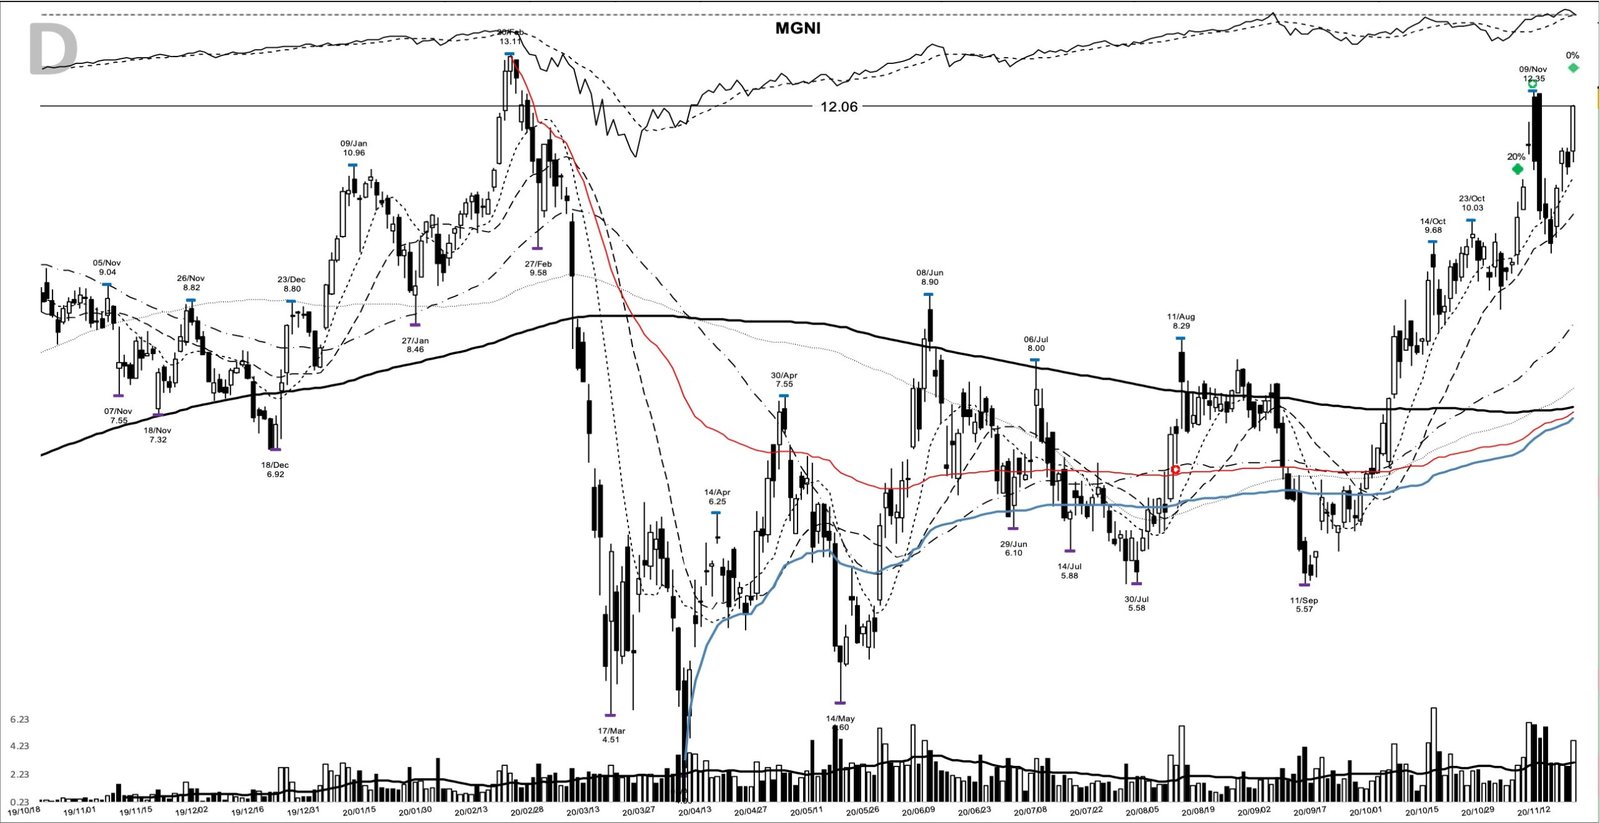
Two weeks after the breakout, price had run to a 12.06 close on 18 November, up 19.6 percent from the entry, holding above a rising 10-day line. With the trend confirming and the fundamentals fresh, there was room to add.
The November 2020 tape that carried MGNI
No breakout runs in a vacuum, and this one had the wind at its back. Early November 2020 was a strong uptrend: indexes rallied through election week on the prospect of a divided Congress, and days after the entry the 9 November vaccine news drove the biggest one-day rally since February. Advertising and communication-services names were bid as reopening hopes returned. A leader breaking out into a rising market has a very different base rate than one fighting the tape.
The finer print of that week mattered for position management. The uptrend had only just been restored by a fresh follow-through, with the S&P still chopping inside its box, and the sober counsel was to move in gradually and add only to positions that proved themselves. MGNI’s stair-step of higher shelves was that proving, in real time.
Building a watchlist plan around the 10.03 pivot
The posture into the breakout was textbook trend structure. The 10-day, 20-day, and 50-day moving averages were stacked in bullish order and rising, at roughly 9.50, 9.17, and 7.76, and the breakout close sat about 6 percent above the 10-day line. Price above a rising 50-day line, pushing to the top of a long base, is the profile that belongs on a watchlist.
The anchors were all readable in advance. The pivot was the 10.03 high from 23 October; the near-term support shelf was the 8.68 low from 30 October; the structure itself failed only on a break of the 4.60 base low from 14 May. Layer in a relative strength line turning up with the market, and the case was built before the entry bar printed.
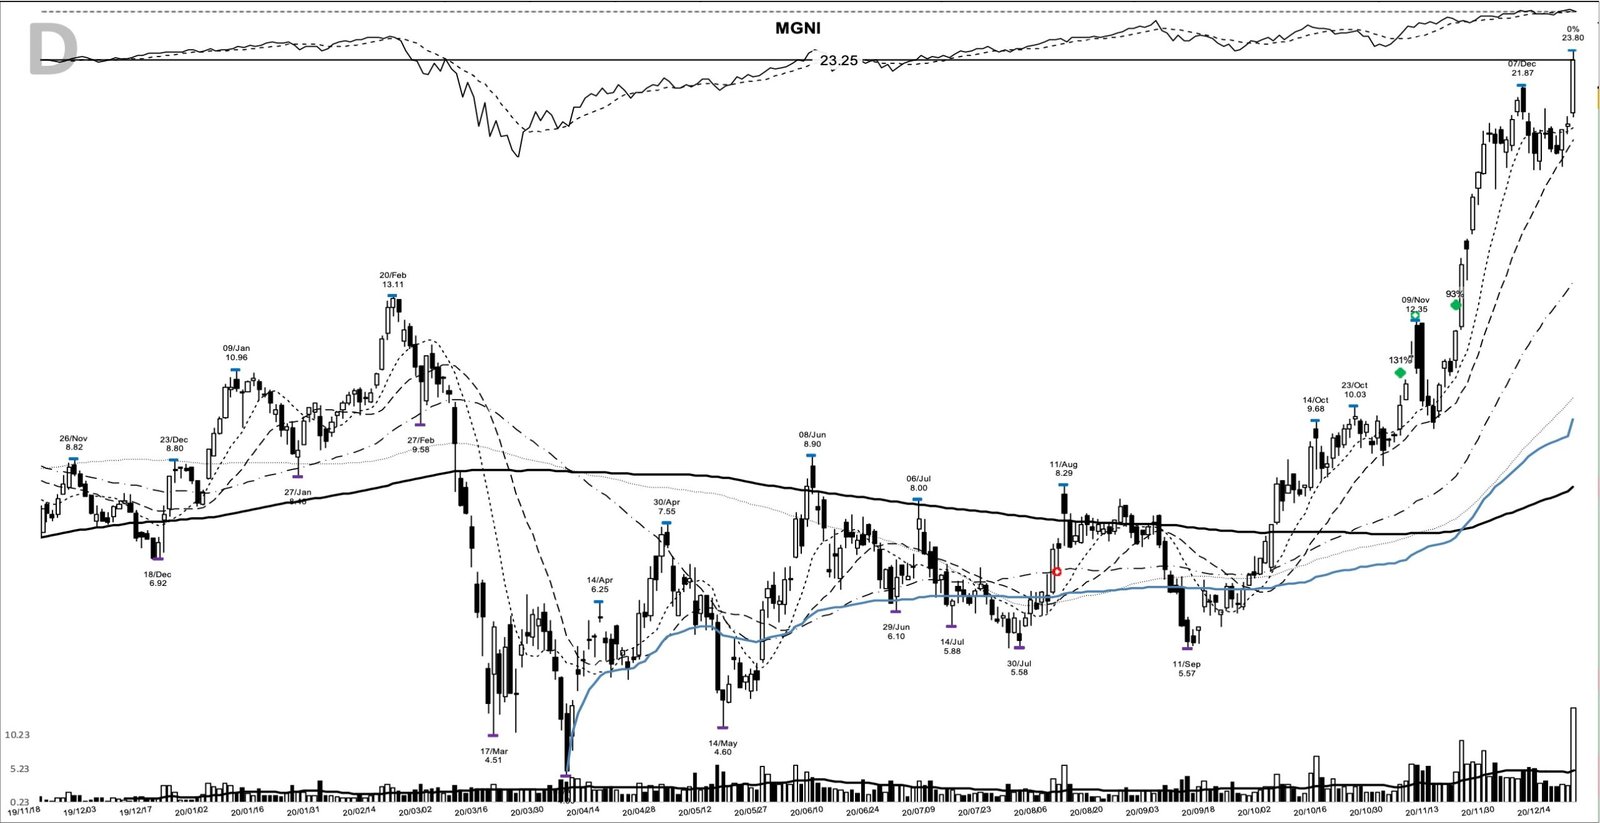
From that map, the plan a trend follower could’ve written on the entry day is simple. Enter above the 10.03 pivot; set the initial stop below the 8.68 shelf, or below the 4.60 base low where the whole structure fails; then trail the 10-day line, widening to the 20-day once the move is well advanced. By 18 December the chart offered a second chance to add, as price gapped to a 23.25 close on volume of 14,164,949 shares, up 130.7 percent from the entry.
How the MGNI trend actually played out
A trader using this pattern might’ve watched for the trend to hold above a rising 10-day line, adding on controlled strength and ratcheting the stop up. That’s close to what the chart delivered.
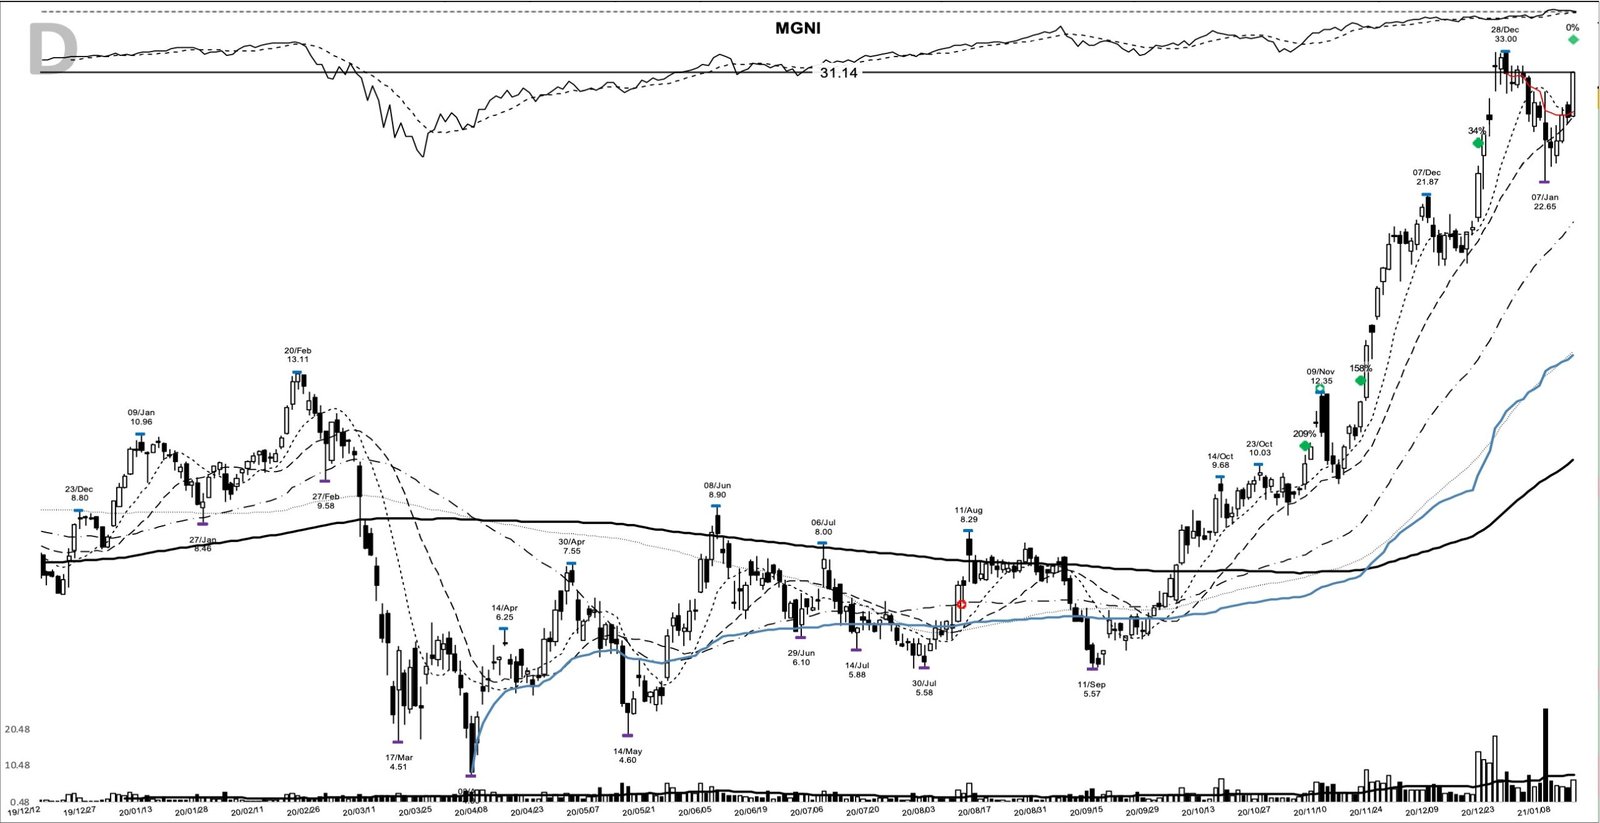
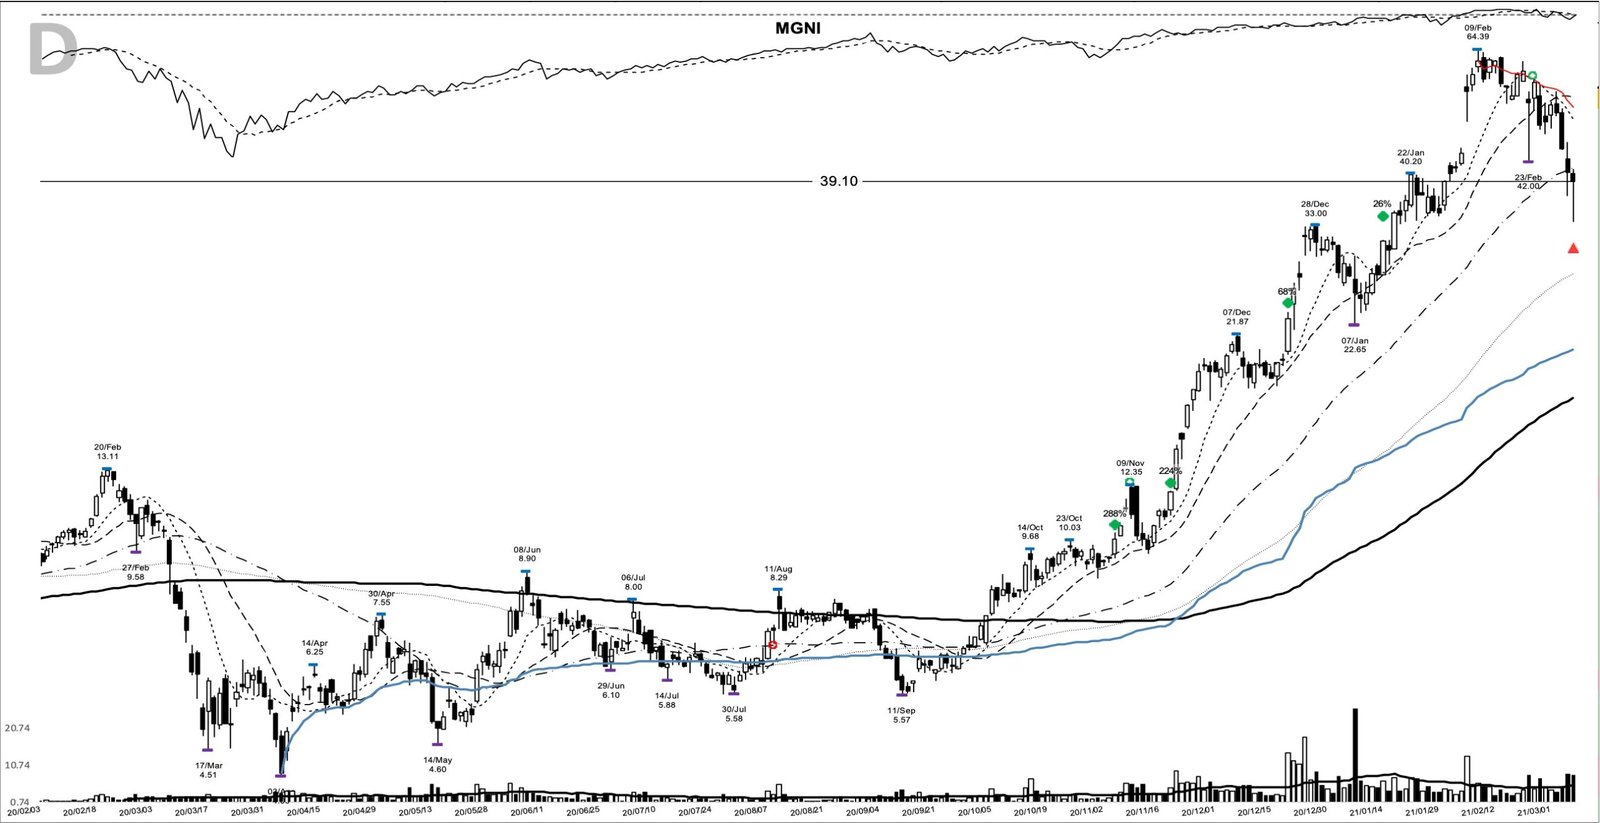
From the 10.08 close, MGNI advanced through the winter. The add points came at 12.06 on 18 November, 23.25 on 18 December, and 31.14 on 14 January, each a higher shelf inside the same trend. Price tagged a 64.39 peak on 9 February 2021, up 538.8 percent from the entry, then rolled over. The exit closed the move at 39.10 on 5 March 2021, a 287.9 percent gain held for 121 days.
By early March the market had shifted to an uptrend under pressure: the Nasdaq had broken below near-term support and was stacking distribution while the S&P held up better, a split tape where the defensive default was to shrink positions and limit new buying. The exit near the trend break belongs to that moment, when growth charts stopped getting the benefit of the doubt.
Where this MGNI breakout could have fooled you
The clearest trap was the signal-bar volume. At about 1.1 times the 20-day average, the breakout print was ordinary, well short of the 1.5-to-2-times expansion the textbook wants to see. The heavy accumulation only arrived in the sessions after, with the 6 November bar trading 5,900,183 shares. A reader who demanded picture-perfect volume on day one would’ve passed on the whole move.
The second trap was the peak. Price reached 64.39 on 9 February and then handed back a large share of the advance before the 39.10 exit. A trailing method never sells the high, and expecting it to is the misread. Chasing the 18 December gap at 23.25 carried its own risk too, since the stock had already run 130 percent from the entry and then chopped hard, with the 7 January bar swinging down to a 22.65 low before it resumed.
What the MGNI base breakout teaches
The edge here came down to a readable pivot at 10.03, a stop level under the 8.68 shelf, a business turning up, and a market leading rather than fighting the move. Enter on strength, add as the trend proves itself, trail the stop, and let the position run. That’s how a small base breakout becomes a near-fourfold trend. Learn the pattern. Ride the trend. Keep the gains.
Related reading: Trend following, support and resistance, and reading volume each go deeper on the pieces above. A new winner study lands most evenings.
Price and volume figures are computed from split-adjusted daily OHLCV data; company figures come from SEC filings where cited.
Educational content only. Not investment advice. Trading involves risk. You are responsible for your decisions.
Get the free Market Wisdom e-book
Join Trends and Breakouts — historical winners, breakout studies, and risk lessons. No spam, unsubscribe anytime.