Polar Power is back on traders’ screens this week, and per the company’s 29 September release it has a new trial order for 50 propane-fueled DC generators from a Southeast Asian telecom operator. That makes this a good moment to pull up the stock’s most famous chart. The pola base breakout of late 2020 grew out of a messy, news-spiked base, stalled on its first attempt at the pivot, and then ran. In short: a November 2020 base that resolved into a trend worth 446 percent in 80 calendar days.
Key takeaways from the POLA base of 2020
- The pattern: a volatile six-month base with an 81.9 percent depth, capped by a 27.09 pivot set on a one-day spike in late October.
- The first attempt failed on a closing basis: 13 November traded to 28.70 and closed at 23.31, back under the pivot.
- The pivot cleared on 19 November with a close at 28.91, and the stock ran to a 215.74 peak by 25 January 2021.
- A second chance came on 15 December after a pullback that held the pivot on every close.
- The lesson: a stock with shrinking sales can still trend hard, which is exactly why price and the stop have to lead.
The POLA trade at a glance
| Field | Value |
|---|---|
| Ticker | POLA |
| Study entry date | 13 November 2020 (intraday pivot test) |
| Entry close | $23.31 |
| Pivot (20-day high) | $27.09 |
| Pivot cleared | 19 November 2020 at $28.91 |
| Volume vs 20-day average | 1.9x |
| Exit date | 1 February 2021 |
| Exit close | $127.33 |
| Gain | +446.2% |
| Calendar days | 80 |
| Peak before exit | $215.74 (25 January 2021) |
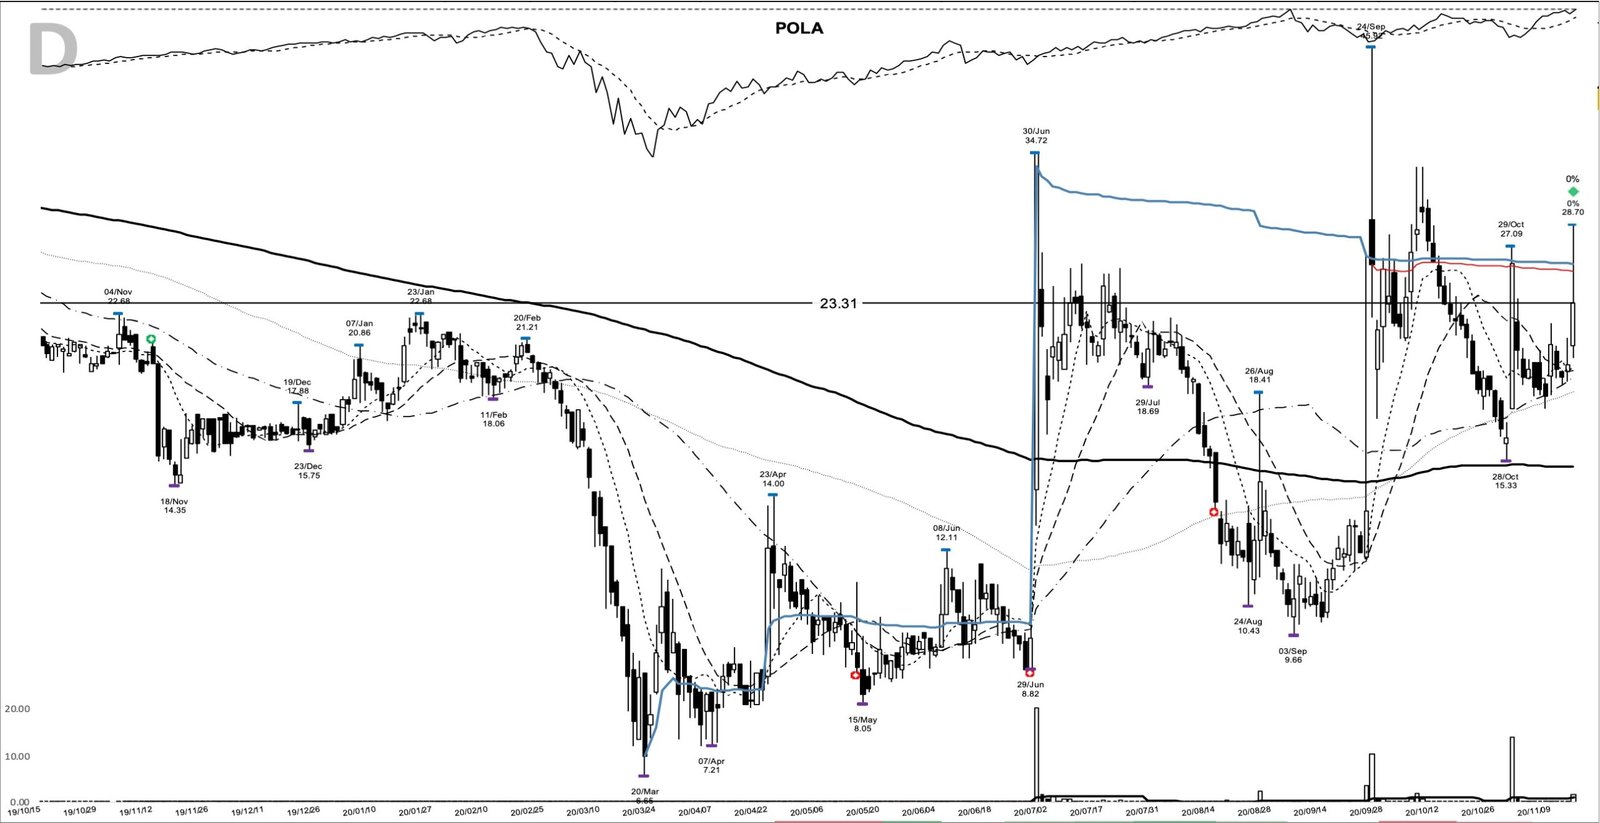
How the POLA base breakout formed around a 27.09 pivot
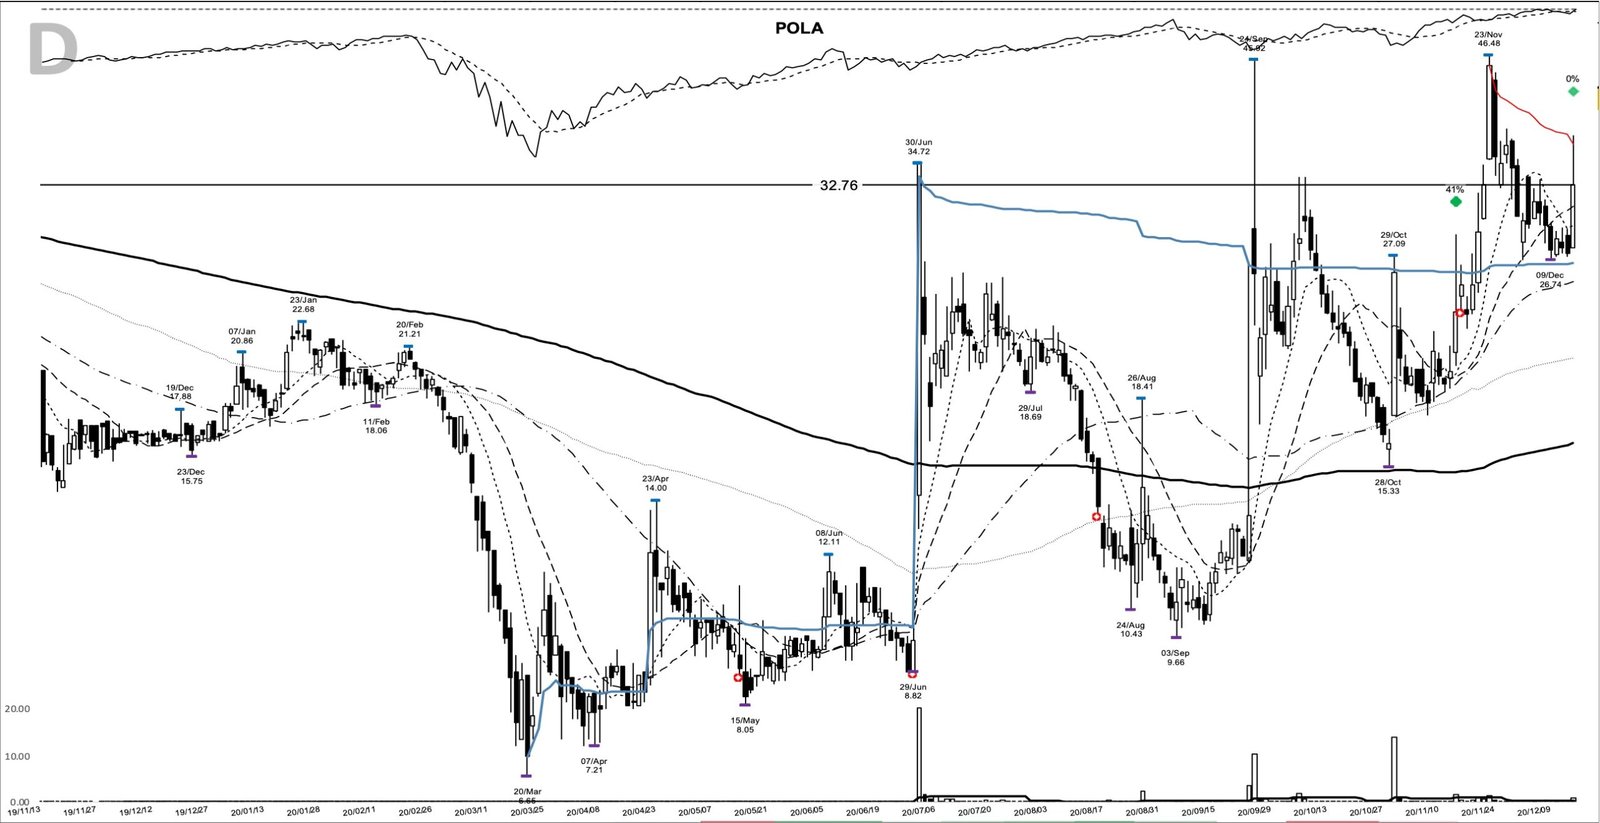
This base doesn’t look like a textbook cup. After the March 2020 crash took the stock to 6.65, POLA spent the spring pinned near 8 to 10 dollars, with the six-month base low at 8.33 on 18 May. Then came three violent spikes. On 30 June it closed at 34.72 on more than 20 million shares. On 24 September it traded to 45.92 intraday and closed at 25.83. On 29 October it ran from 17.64 to 27.09 on over 14 million shares.
Each spike faded, but the floors kept rising. After the June spike the stock bottomed at 9.66 on 3 September, and after the September spike it bottomed at 15.33 on 28 October, the day before the third spike. On the chart the three volume bars tower over everything else, and the moving averages underneath slowly curl up from the September lows.
That third spike set the pivot at 27.09. Price then built a short shelf, with the low at 17.64 on 6 November, and on 13 November it surged again. The bar opened at 20.86, traded as high as 28.70, well through the pivot, and closed at 23.31. That makes the entry an intraday pivot test. Volume ran 1.9 times the 20-day average, but that average was itself inflated by the 29 October spike, so the day showed interest without proving demand.
The close that counted came four sessions later. On 19 November POLA closed at 28.91, above the 27.09 pivot, on 807,303 shares. The next day it closed at 32.83, and on 23 November it traded to 46.48, taking out the September spike high of 45.92 for the first time.
Polar Power in late 2020: a shrinking business with a new story
Polar Power builds DC generators and hybrid power systems, and in 2020 almost all of its sales went to telecom carriers powering cell sites. The numbers into the entry were poor. Quarterly revenue fell from 6,939,000 dollars in the September 2019 quarter to 2,501,000 dollars a year later, down 64 percent. The June 2020 quarter had been worse, at 1,126,000 dollars, down 87.8 percent. The September quarter still carried a loss of 0.42 dollars per share as reported at the time.
The company’s quarterly filing, filed on 16 November, blamed telecom customers shifting budgets from backup power toward their 5G buildouts, plus pandemic delays on site installations. It also pointed to new products: a natural gas and propane line for Asian telecom customers, a military generator contract, and plans for EV charging and marine markets. Backlog stood at 3.4 million dollars at the end of September.
Measured against the model-book frame, this fails the earnings test outright. There’s no EPS acceleration and no revenue growth. The only fundamental support was a sequential rebound from the June quarter and a story about new markets, which is why POLA is a price-led lesson more than a William O’Neil style earnings leader.
A small-cap tape that rewarded risk
The backdrop carried a lot of this move. November 2020 opened with the election, and on 9 November Pfizer’s vaccine data set off a rotation into smaller, economically sensitive companies. The Russell 2000 was on track for its best month on record, per CNBC’s 24 November report, rising roughly 20 percent in November alone.
Small caps and clean-energy names kept running into January 2021, when retail traders crowded into EV-linked stocks. A low-priced power-systems company with an EV-charging plan sat right in that current.
Preparing for POLA before 27.09 gave way
Into 13 November the trend posture was early and unfinished. The 10-day, 20-day, and 50-day moving averages sat bunched at 19.71, 19.53, and 19.19, knotted together rather than fanned out. Price had closed above the 10-day line for only two straight sessions, and the 23.31 close stood 18.3 percent above it. The stock was also still 49.2 percent below its 45.92 high from September.
What would have put it on a watchlist was the sequence of higher lows between spikes, 8.33 in May, then 9.66 in September, then 15.33 in October, and the fact that each flood of volume was absorbed without a return to the old lows. A volume reader would note that the spikes marked supply as well as demand, since each one gave back a large part of its gain within two sessions: the 34.72 close of 30 June became an 18.06 close by 2 July, and the 25.83 close of 24 September became 21.70 the next day.
The plan a trend follower could have written that week came straight from the anchors: a trader using this pattern might have entered on a close above the 27.09 pivot, set the initial stop below the 17.64 shelf, or below the 8.33 base low for the structural read, then trailed the 10-day moving average, widening to the 20-day once the move was well advanced. On a stock this volatile the stop under 17.64 was already about a third of the entry price, which argues for a much smaller position than a quiet base would allow.
The study entry on 13 November anticipated that plan. It sat at 23.31, closer to the shelf, so the stop distance was roughly a quarter of the price against a third for the plan. The cost was the risk that 27.09 would never clear. Here it did, four sessions later.
How the POLA move played out, November to February
A trader using this pattern would have watched one thing after 19 November: whether pullbacks held the pivot. The first test came fast. After the 46.48 high on 23 November the stock slid for two weeks to a 26.74 intraday low on 9 December, yet every close in that stretch stayed above 27.09. On 15 December it jumped to 37.45 intraday and closed at 32.76 on 832,456 shares, 40.5 percent above the entry. That was an opportunity to add, with most of the move still ahead, a textbook case for pyramiding into a position.
January did the heavy lifting. POLA closed at 51.80 on 8 January, then on 15 January traded 5,554,185 shares and closed at 80.64. A week later it closed at 165.20, and on 25 January it printed the 215.74 peak before closing at 191.66. Three sessions later it traded as low as 109.768.
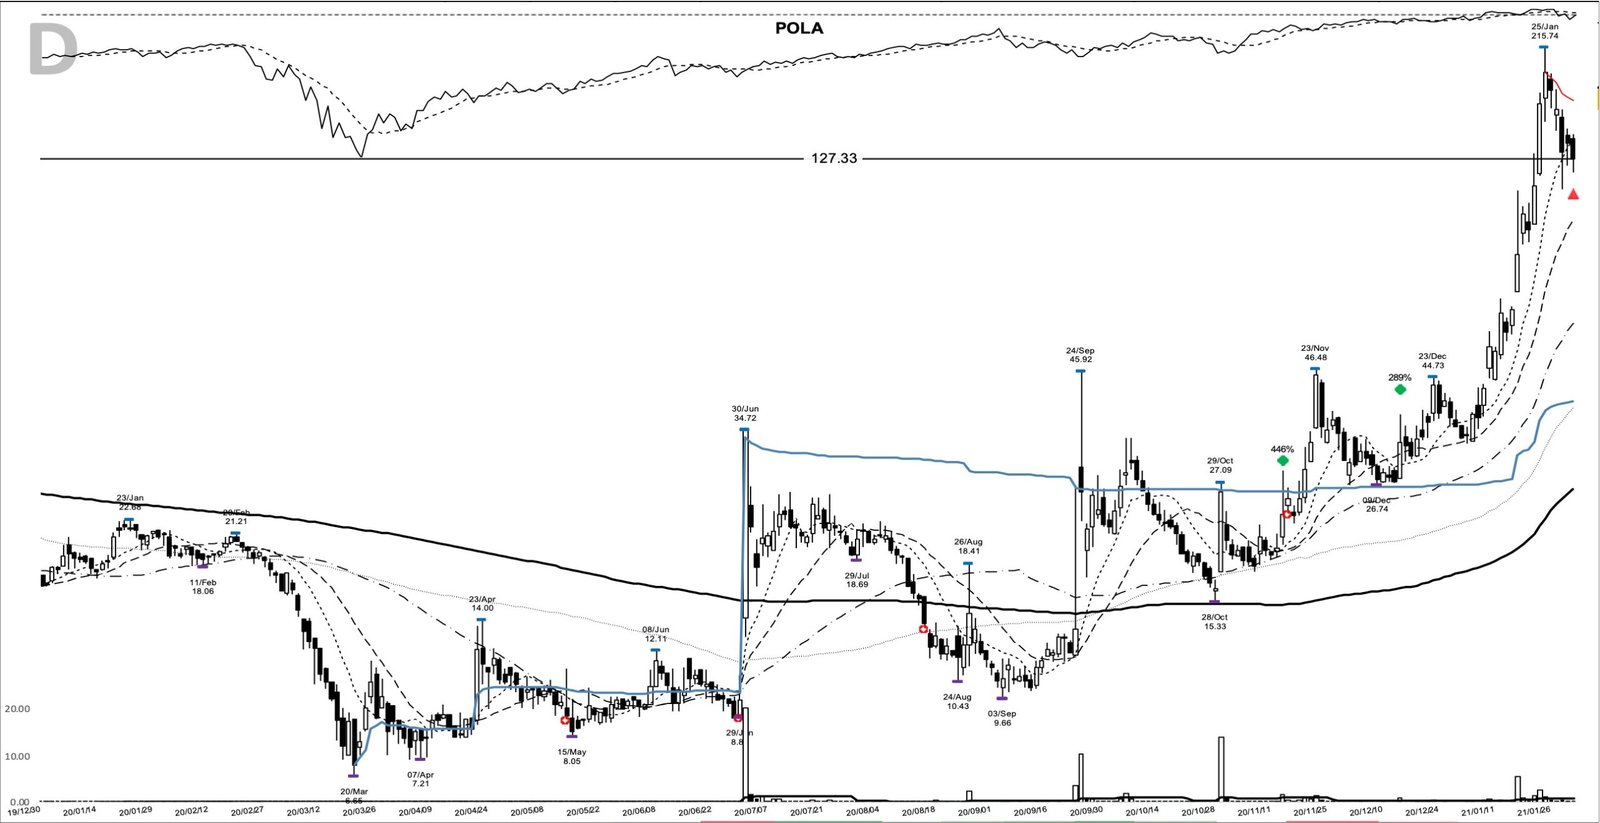
The marked exit came on 1 February at 127.33, a gain of 446.2 percent over 80 calendar days. That’s well short of the 825.5 percent the peak had shown, and that gap is the price of trailing a trend instead of guessing the top. A thousand dollars riding the full move would have become 5,462 dollars.
Where the POLA chart could have fooled you
The first trap is the entry bar. A print at 28.70 through a 27.09 pivot looks like a breakout in real time, yet the close at 23.31 said the base hadn’t resolved. It took until 19 November to get a close that did.
The second trap is the fundamentals, in both directions. A model-book screen would have discarded POLA for falling sales and losses, and it still ran 446 percent. The opposite misread is worse: taking the run as proof the business had turned. It hadn’t, and within three sessions of the 215.74 peak the stock gave back more than half its gain from the entry.
The third trap is the pivot itself. A level set by a single spike day is thinner than one set by weeks of closes, and three earlier spikes on this chart had failed. This is one winner from an archive of charts that worked; plenty of spike-driven bases never cleared, which is why survivorship bias belongs in every study like this.
What the 27.09 pivot taught on POLA
The spike through 27.09 on 13 November was a test. The close at 28.91 on 19 November was the answer, and the pullback that held above 27.09 into mid-December was the proof. On a volatile small cap with weak numbers, the pivot, the stop, and the trend are the only honest guides you have.
Learn the pattern. Ride the trend. Keep the gains.
Related studies: QS base breakout, November 2020, EH base breakout, November 2020, and NTLA base breakout, November 2020. A new winner study lands most evenings.
Price and volume figures are computed from split-adjusted daily OHLCV data; company figures come from SEC filings where cited.
Educational content only. Not investment advice. Trading involves risk. You are responsible for your decisions.
Get the free Market Wisdom e-book
Join Trends and Breakouts — historical winners, breakout studies, and risk lessons. No spam, unsubscribe anytime.