NTLA is back near the top of the trending lists this week, and every time a ticker like this reappears it is worth pulling the chart that made it interesting in the first place. Back in early November 2020, Intellia Therapeutics pushed the close through a multi-month shelf and printed a new 52-week high, the classic shape of a NTLA base breakout. The setup did not look dramatic on the day. What followed was a run of 114% in 84 calendar days, four points where a trend follower could have added, and an exit that gave back a third of the peak.
The stock trades far below those levels now, which is exactly why the 2020 chart teaches more than the current tape does. This is a study of one real winner from my study archive, retold so the pattern is easy to spot the next time it shows up.
What the NTLA breakout teaches
- A base breakout can clear its pivot on a close even when volume is light, so a quiet breakout day is not a reason to pass.
- The entry close of 27.17 cleared the 27.07 pivot by a fraction, and the demand arrived the next session, not the day of.
- The move ran 113.9% from the entry to the 27 January 2021 exit at 58.11, over 84 calendar days.
- There were opportunities to add on 13 November, 23 November, and 6 January as the trend widened.
- The trailing exit at 58.11 sat well under the 92.00 peak, a reminder that trend followers keep the trend, not the top.
The NTLA base breakout at a glance
| Field | Value |
|---|---|
| Ticker | NTLA (Intellia Therapeutics) |
| Breakout date | 4 November 2020 |
| Breakout close | 27.17 |
| Volume vs 20-day average | 0.9x |
| Exit date | 27 January 2021 |
| Exit close | 58.11 |
| Gain | 113.9% |
| Calendar days held | 84 |
| Peak before exit | 92.00 (15 January 2021) |
How the base and the 27.07 pivot formed
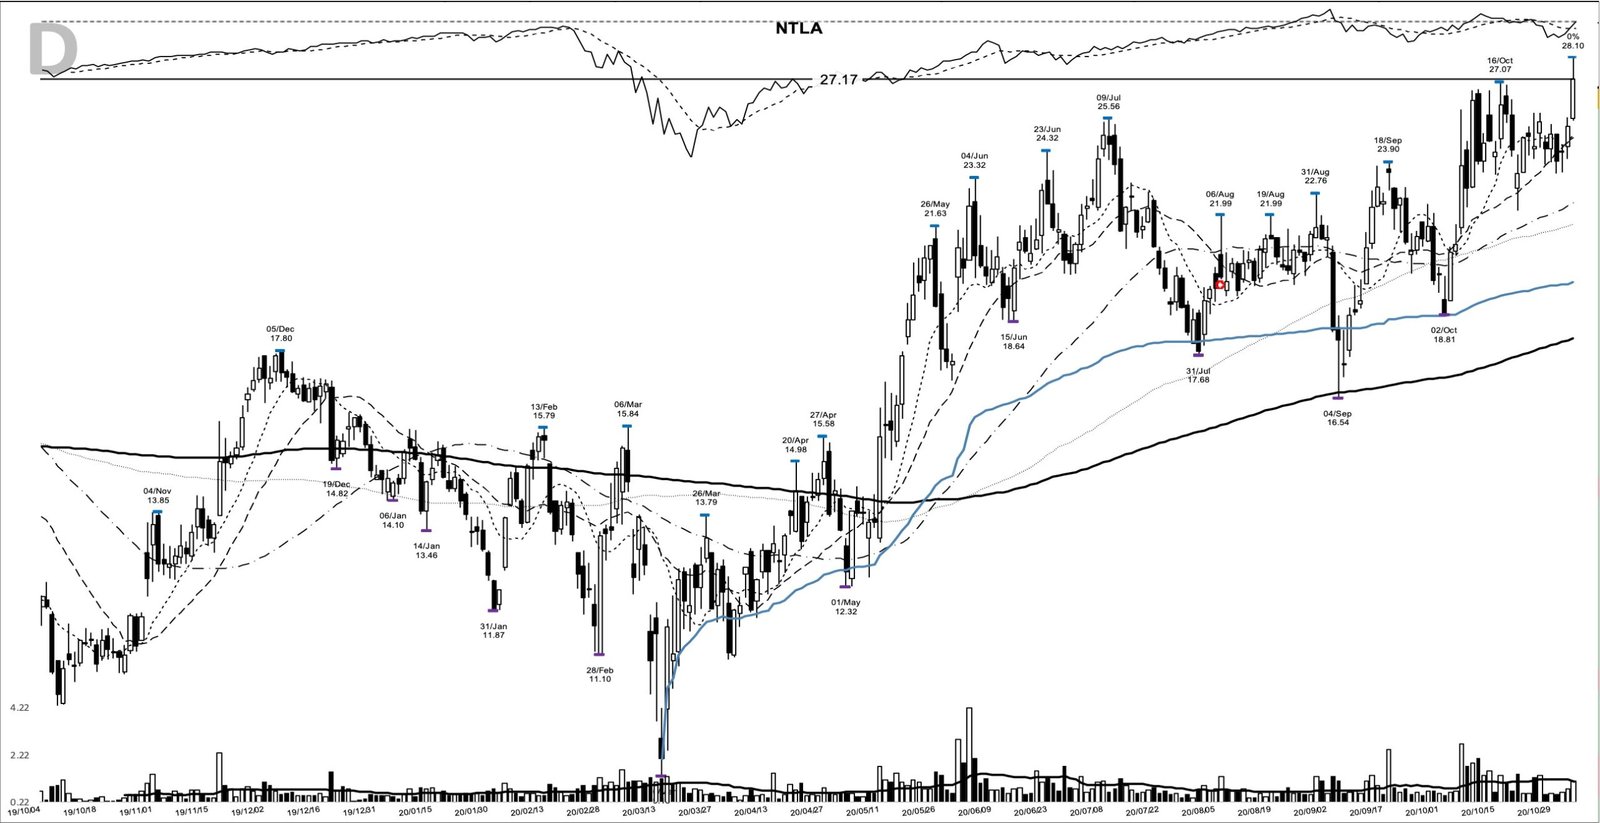
Start with the wreckage on the left of the chart. NTLA bottomed at 9.18 in March 2020 with the rest of the market, then spent the next eight months rebuilding. By autumn it had carved a wide base whose ceiling was the 27.07 high set on 16 October, which also happened to be the prior 52-week high.
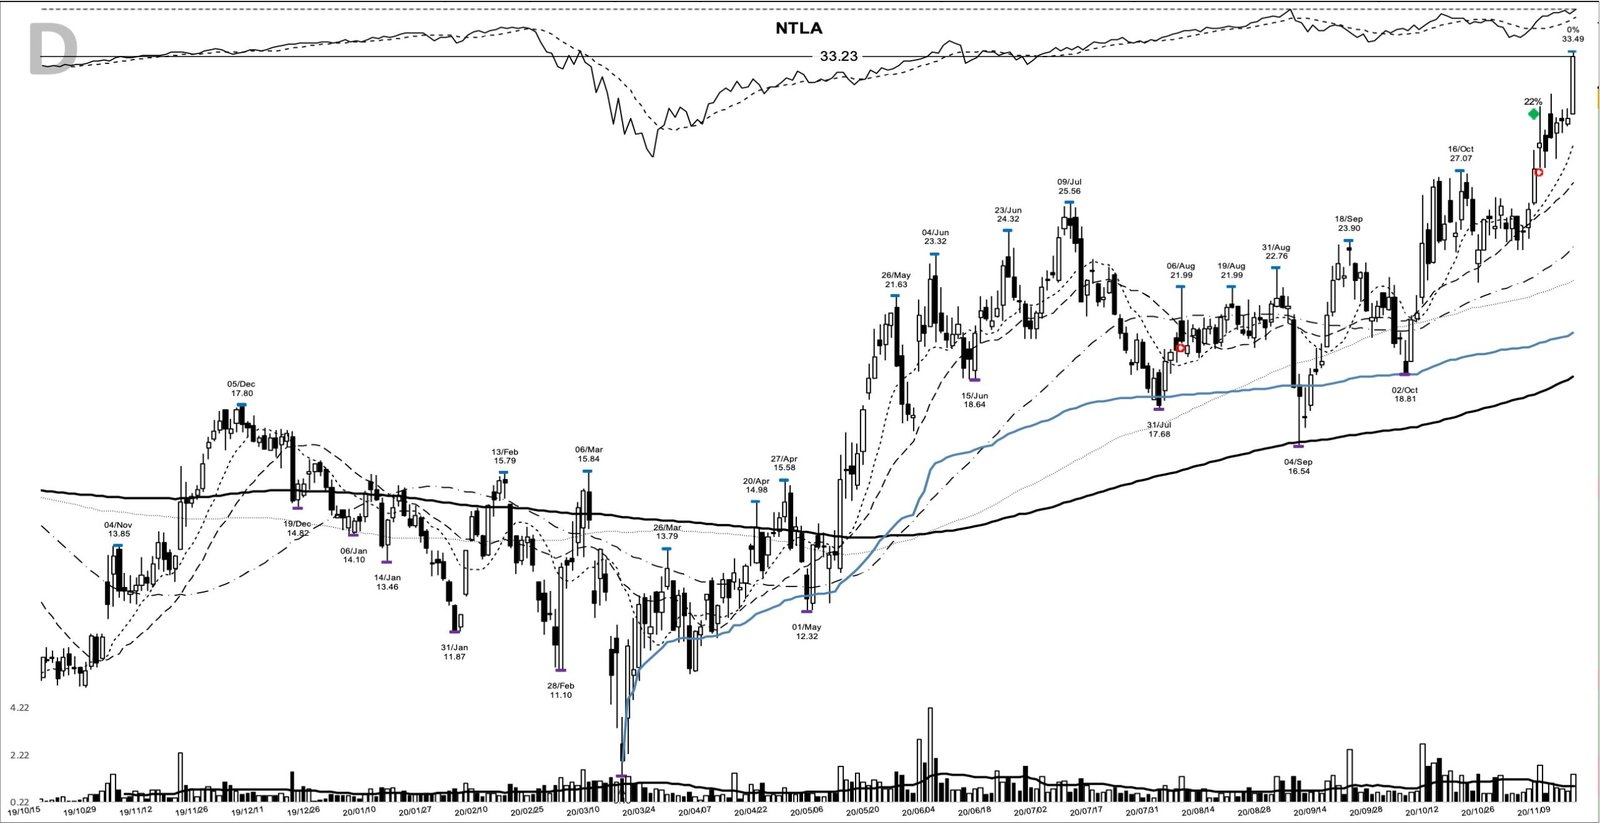
The last five sessions before the breakout tucked into a tight shelf, with the low at 23.49 on 30 October. That is the coil that matters: price pressed up under known resistance and stopped going down. On 4 November the breakout closed at 27.17, about 0.4% above the 27.07 pivot and into fresh 52-week-high ground. Because the close finished above the pivot, this counts as a confirmed breakout rather than a probe below it.
The honest wrinkle is volume. The breakout day traded 1,105,583 shares, which is 0.9 times the 20-day average, so the day itself carried no demand surge. The buyers showed up the next session: 5 November gapped to 28.48 on 1,751,056 shares, a clear expansion. Reading that sequence is a skill in itself, and it pays to read volume as a story across days rather than judging one candle.
The fundamental frame fit the model-book template that William O’Neil built his work around, even without an earnings line. Intellia was pre-profit, so there is no EPS figure to cite. Reported revenue, though, was accelerating hard into the base: 12.9 million in Q1 2020, up 23.8% on the year, then 16.3 million in Q2 at plus 46.3%, then 22.2 million in Q3 at plus 109.3% (SEC EDGAR). A young company posting triple-digit revenue growth at new price highs is the raw material breakouts are made of.
Intellia’s business as the base built
Intellia Therapeutics is a gene-editing company, one of the names built directly on CRISPR/Cas9. Through 2020 the story that investors were arguing about was whether in-body gene editing could move from the lab to a living patient, and Intellia sat at the front of that debate alongside its partner Regeneron.
The breakout front-ran the news by a few days. On 9 November 2020 the company announced that the first patient had been dosed with NTLA-2001, its CRISPR therapy for transthyretin amyloidosis, the first in-body CRISPR treatment delivered intravenously to a human (Intellia release, 9 November 2020). The chart had already cleared its pivot on 4 November, which is the pattern that tends to repeat: price moves first, the headline confirms later. The relative-strength line in the top panel of the chart tells the same story, pushing back to new-high ground as the breakout printed. If that line is new to you, the relative-strength line is worth learning before you weigh a breakout.
The autumn 2020 tape behind the move
Context helps here. The breakout landed the day after the November 2020 US election, in a strong risk-on stretch that carried growth and biotech names to new highs into year-end. Vaccine headlines and a broad rotation into speculative growth gave leaders like this one room to run.
A tape that rewards new highs is the tape you want behind a breakout. That backdrop does not excuse a weak chart, and it does not last forever, but it turned NTLA’s clean base into a trend instead of a one-day pop. The froth in that same tape is also what eventually caught the stock, which the exit section gets to.
How a trader could have spotted NTLA early
The watchlist tell was in the structure well before 4 November. Price was stacked above its rising moving averages into the pivot: the 10-day at 24.97, the 20-day at 24.81, and the 50-day at 22.42, all below a 27.17 close. The stock had reclaimed its 10-day line and closed above it for two straight sessions, sitting about 8.8% over that line, so it was extended but firmly in gear.
The base itself flagged the name. A stock rebuilding toward a prior 52-week high, with the pivot fixed at the 27.07 October high and a tight 23.49 shelf underneath, belongs on a watchlist waiting for the close through resistance. This is textbook trend-following preparation, and the art of pyramiding into a position starts with a base this clean.
Here is the plan a trend follower could have written that day. Enter on the close above the 27.07 pivot. Set the initial stop just under the 23.49 shelf, the level that says the breakout failed; a wider stop under the 12.51 base low is where the whole structure breaks, but that is a lot of room to give. From there, trail the 10-day moving average while the move is young and widen to the 20-day once the trade is well advanced. The trade is defined before the entry, not after.
How the NTLA trend played out
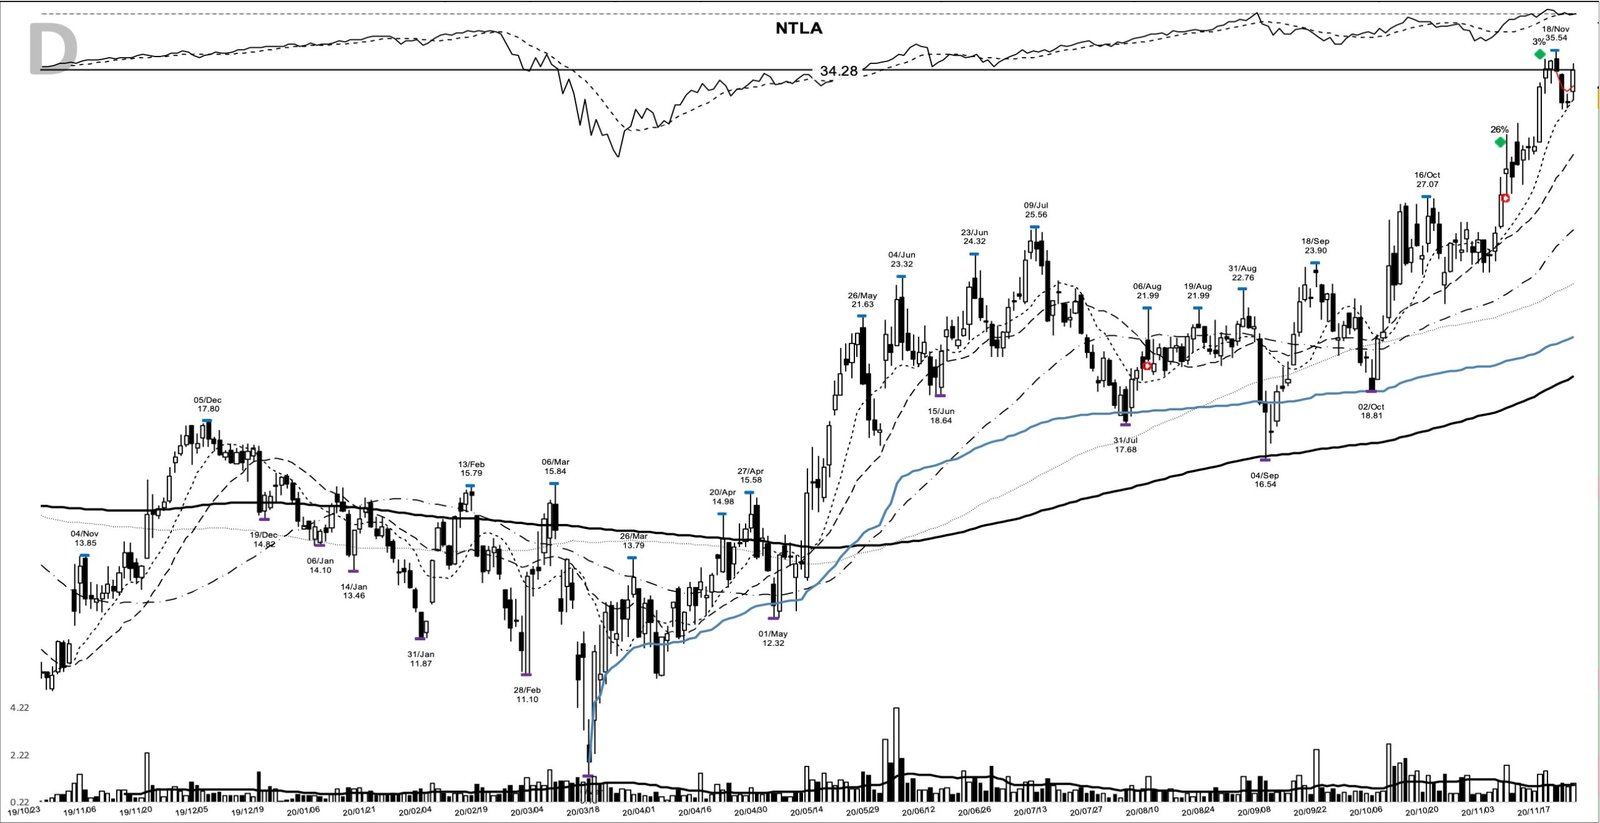
A trader using this pattern would then watch for follow-through above the pivot and pullbacks that hold the moving averages, and NTLA delivered both. The first add point came on 13 November at 33.23, already 22.3% above the entry. A second followed on 23 November at 34.28. Each was a spot where the trend gave a fresh, higher shelf to lean on.
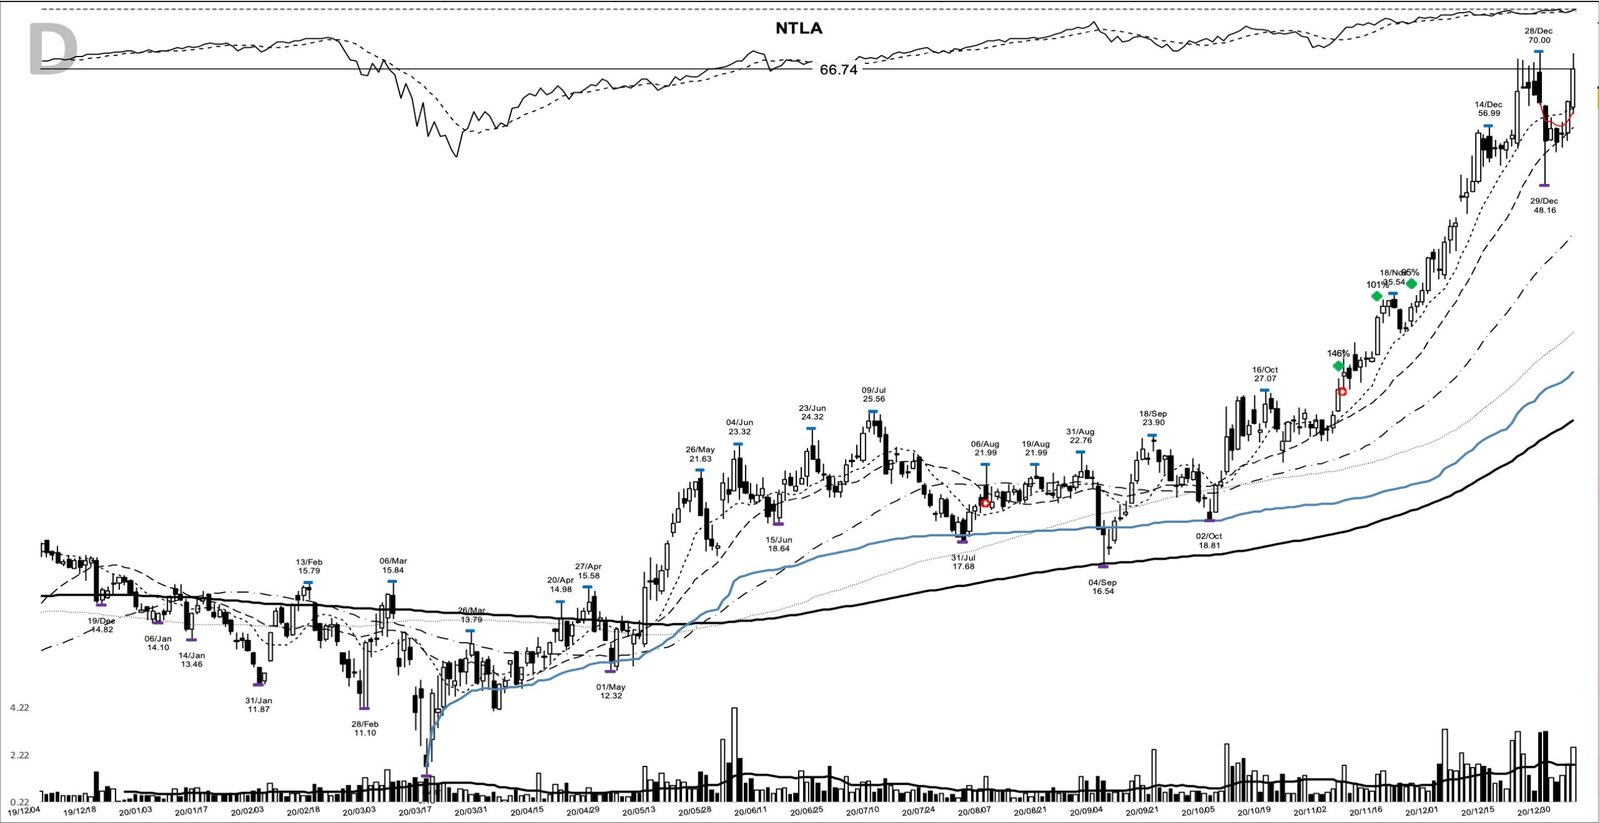
The move then accelerated into January. By 6 January 2021 the stock closed at 66.74, up about 145.6% from the entry, and that was the last of the marked add points as the trend went vertical. It peaked at an intraday 92.00 on 15 January, a maximum gain of 238.6% for anyone who caught the exact high.
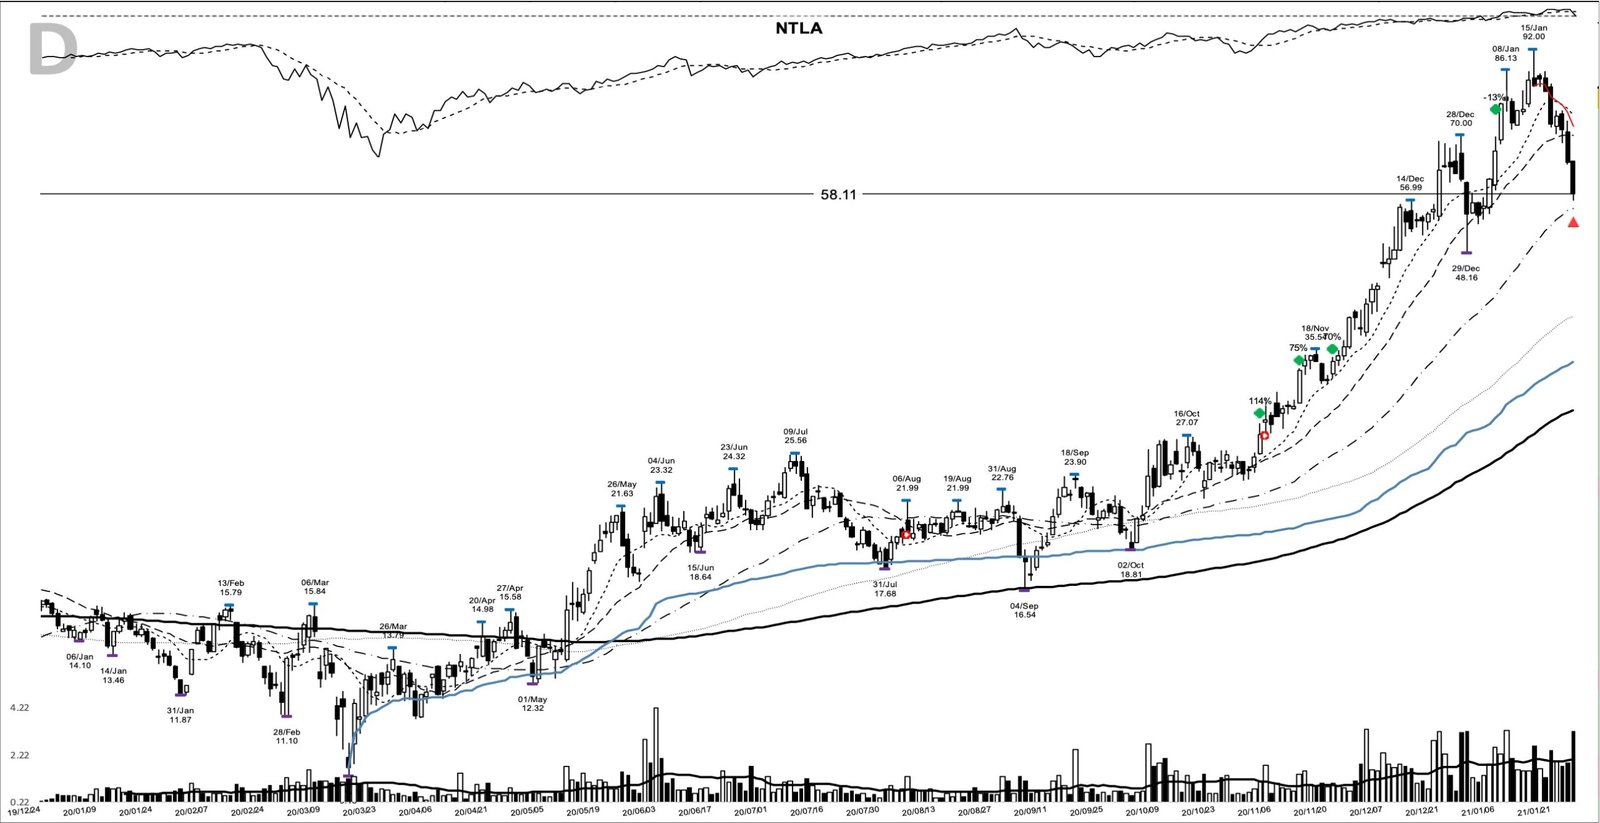
Nobody sells the exact top. The exit on the chart lands on 27 January at 58.11, closing the move at 113.9% above the breakout after the trailing stop caught the pullback from 92. On 1,000 units risked at the entry, the run would have become about 2,139 by that exit. The peak was 238.6%; the kept gain was 113.9%. That gap is the price of staying mechanical instead of guessing the high.
Where this NTLA setup could fool you
The first trap is volume worship. Plenty of playbooks demand a big volume spike on the breakout candle, and here that spike never came on the day; the entry printed on 0.9 times average volume. Waiting for a textbook surge would have skipped the entry entirely. Volume still matters, but it can arrive a session late, which is why it helps to study how volume confirms breakout candles across a few days rather than one.
The second trap is the late add. Buying the 6 January print at 66.74 felt strong, yet from there to the 58.11 exit the stock actually lost ground. An add near a vertical extension carries the worst risk in the sequence, because the stop sits far below and the move is already stretched. The wide base is a caution too: a 53.8% base is loose by model-book standards, and loose bases fail more often than they run, so this one working is not a promise the next deep base will.
The trend did the heavy lifting
NTLA’s November 2020 chart is a clean lesson in patience. The entry was almost boring, a quiet close a hair above resistance on light volume. The result came from the eight-month base that set it up, the adds that pressed a working trend, and a stop that stayed mechanical while price gave back a third of its peak. Learn the pattern. Ride the trend. Keep the gains.
Related studies worth a look next: the NVAX base breakout from the same biotech-led stretch, the TWST base breakout of 2020 in adjacent gene-tech, and the QS base breakout of November 2020 from the very same week. A fresh winner study lands here most evenings.
Price and volume figures are computed from split-adjusted daily OHLCV data; company figures come from SEC filings where cited.
Educational content only. Not investment advice. Trading involves risk. You are responsible for your decisions.
Get the free Market Wisdom e-book
Join Trends and Breakouts — historical winners, breakout studies, and risk lessons. No spam, unsubscribe anytime.