By mid-February 2020, Zoom Video Communications had spent almost a year grinding sideways after its IPO pop, and then it stopped grinding. On 18 February 2020 the stock closed at 96.39, pushing up through a shelf that had capped it for a week and clearing the pivot that defined a long base. When ZM shows up on traders’ screens again, and it’s back on them this week, this is the chart worth going back to. The ZM base breakout that day opened a run of +370% over the next 258 calendar days.
Key takeaways from the ZM base breakout
- A six-month base, roughly 36.8% deep, resolved on 18 February 2020 when ZM closed at 96.39 and cleared its 93.30 pivot.
- Volume on the breakout day ran about 1.8 times the 20-day average, real demand behind the move rather than a quiet drift higher.
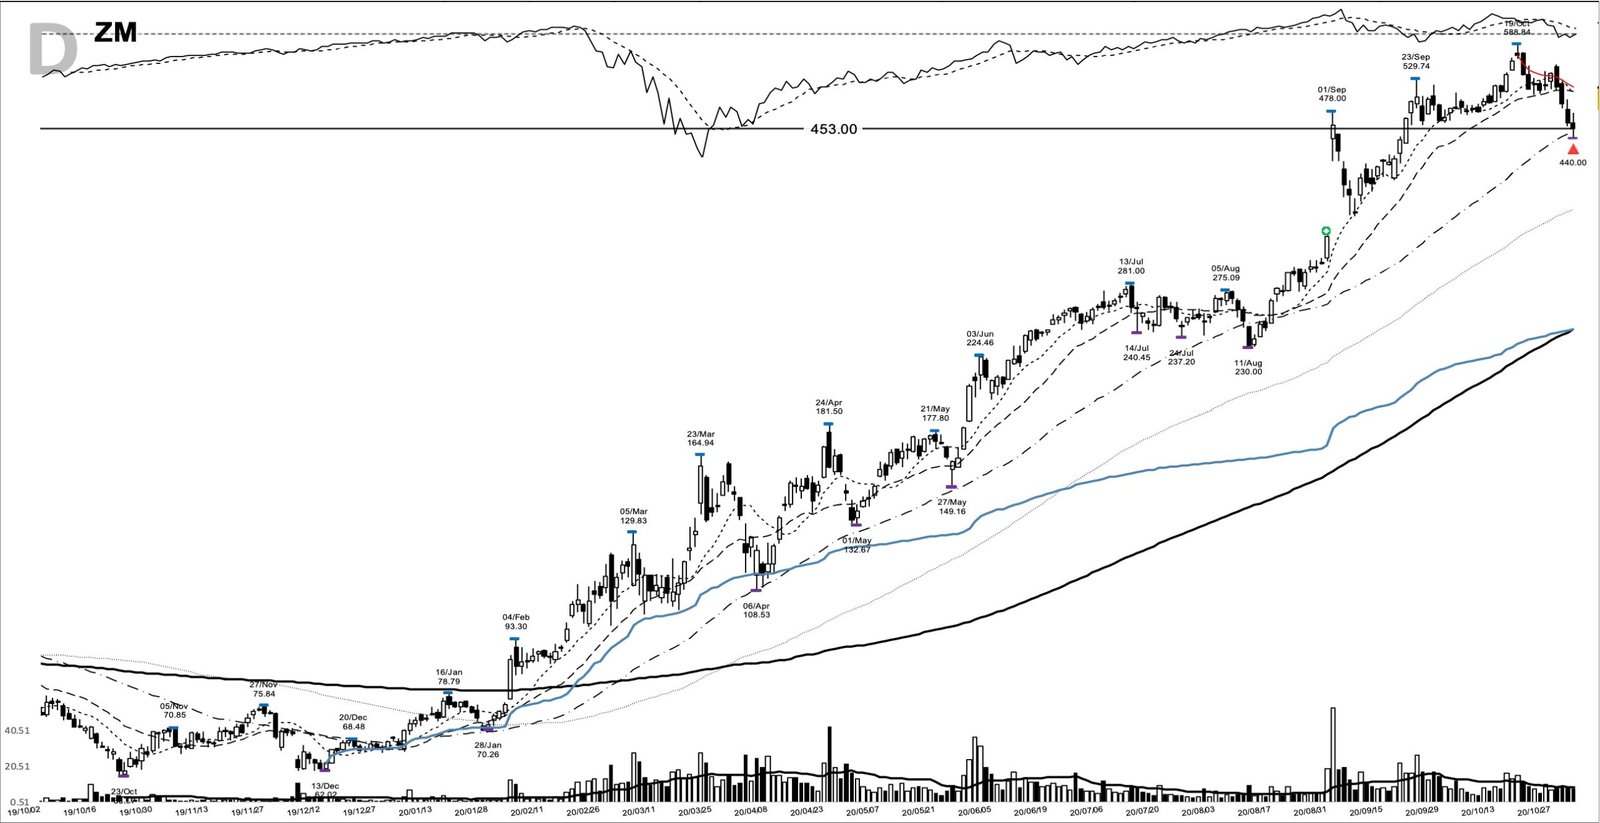
- The trend carried the stock from the 96.39 close to a 453.00 exit on 2 November 2020, a +370% gain held for 258 calendar days, with price peaking at 588.84 on 19 October.
- Five marked points between May and October gave a trend follower places to add into strength as the move extended.
- The lesson is a leadership template: accelerating fundamentals, a clean pivot, expanding volume, and a relative-strength line already at new highs.
The ZM trade at a glance
| Field | Value |
|---|---|
| Ticker | ZM |
| Breakout date | 18 February 2020 |
| Breakout close | 96.39 |
| Volume vs 20-day average | 1.8x |
| Exit date | 2 November 2020 |
| Exit close | 453.00 |
| Gain | +370% |
| Calendar days held | 258 |
| Peak before exit | 588.84 (19 October 2020) |
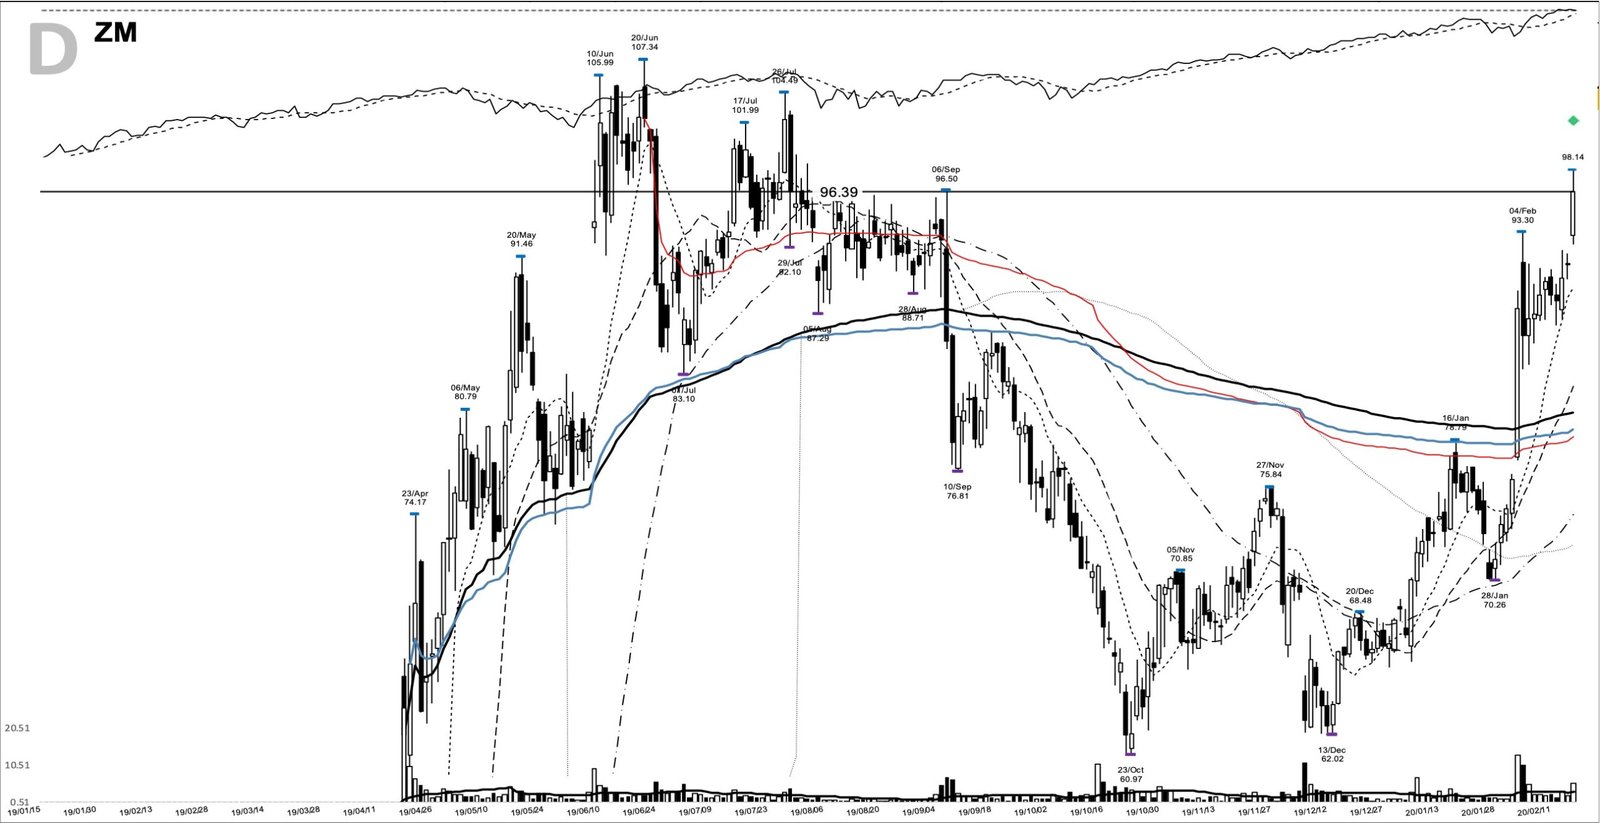
The charts here come from my study archive. On the entry chart, the horizontal line sits at the 96.39 breakout close, and the base beneath it’s easy to trace: a high near 107.34 from June 2019, a long slide into the 60.97 October low, and a recovery back toward the old resistance. The relative-strength line across the top of the chart pushed to a fresh high as price cleared the pivot, which tells you the broad market was leading the advance here, not merely tolerating it.
Anatomy of the ZM base breakout
The structure is a textbook post-IPO base. After topping at 107.34 in June 2019, ZM fell all the way to 60.97 by 23 October 2019, a decline of about 36.8% from the base high of 96.50 set in September. That’s a deep, wide base, the kind that shakes out weak holders before a leader turns.
The immediate pivot was the 93.30 high from 4 February 2020. Price then coiled into a tight one-week shelf, holding a low of 86.52 on 12 February before the breakout. On 18 February the stock opened at 93.02, ran to a high of 98.14, and closed at 96.39. Because that close finished above the 93.30 pivot, this was a confirmed breakout, not a test that failed back into the range.
Volume did its job. The breakout traded about 5.67 million shares against a 20-day average near 3.10 million, roughly 1.8 times normal. Reading volume that way matters: a pivot cleared on a volume expansion is worth more than the same close on a quiet tape. For context on why that ratio carries weight, our note on reading volume walks through the logic.
The fundamentals fit the leadership profile that William O’Neil built his base-breakout work around. Across the four quarters through its January 2020 fiscal year-end, Zoom grew revenue between 78% and 103% year over year. The last report the market had digested before the breakout, fiscal Q3, showed revenue up 84.9%. Two weeks after the entry, on 4 March 2020, Zoom reported fiscal-Q4 revenue up 77.9% and earnings of 0.05 per share, a fourfold jump from a year earlier. A profitable, hyper-growth software leader breaking out of a deep base is the setup, and the CANSLIM framework names most of the boxes it ticked.
What Zoom’s business was doing into the breakout
The story behind the chart was already turning before anyone said the word pandemic on a trading desk. Zoom sold video meetings that worked, and its customer base was compounding fast. The February 2020 tape then handed that thesis a catalyst: as the coronavirus spread, investors started paying up for companies seen as insulated from an economy that might have to stay home. Zoom was the clearest expression of that idea, and money moved toward it early (The Motley Fool, March 2020).
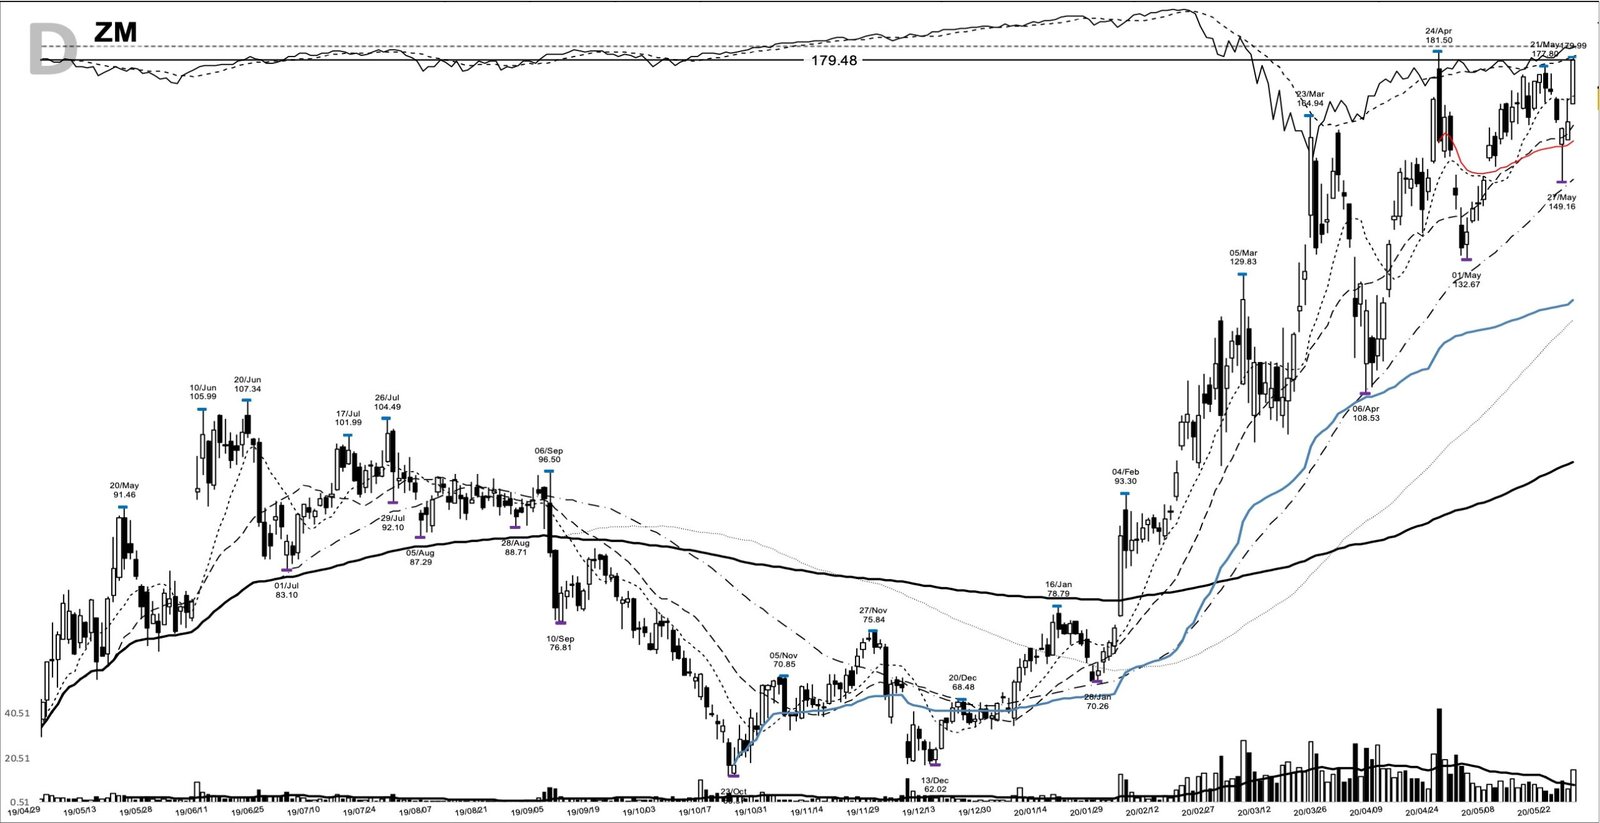
By late May, the fundamental picture had gone from strong to extraordinary as work-from-home demand pulled forward years of adoption. The stock reflected it. On 29 May 2020 ZM closed at 179.48, already up about 86% from the entry, and the chart was building a fresh launch pad rather than topping out. That combination, a business inflecting higher while price consolidates gains, is exactly where there was an opportunity to add to a winning trend.
The February 2020 tape behind the move
Context matters, because the same setup fails more often in a hostile market. In mid-February 2020 the broad market was still in a confirmed uptrend, with leading growth names printing new highs. That backdrop’s what let ZM clear its pivot cleanly. It didn’t last: within about a week of the breakout the coronavirus correction hit the tape, and even a leader like Zoom whipsawed hard, trading down to 97.37 intraday on 28 February after opening far higher. The trend reasserted itself into the spring, but the first ten days were a stress test, not a victory lap.
How a trader could have spotted the ZM setup early
The preparation was visible before the breakout printed. Into the 93.30 pivot, ZM had closed above its 10-day moving average for 13 straight sessions, and the entry close sat about 8% above that 10-day line at 89.25. Price was well clear of the 20-day line at 82.32 and the 50-day at 74.16, so the trend posture was already stacked up and pointing higher.
The watchlist trigger was the base itself. A stock reclaiming the top of a long, deep base, with a tightening shelf and a relative-strength line at new highs, belongs on a screen before it moves. The plan a trend follower could’ve written that morning was plain: enter as price clears the 93.30 pivot, place the initial stop under the 86.52 shelf low, or under the 60.97 base low for those who wanted the structure itself to be the line in the sand, then trail the rising 10-day average and widen to the 20-day once the move extended. Managing the adds is its own discipline, and the note on pyramiding into a position covers the mechanics.
How the ZM trend played out
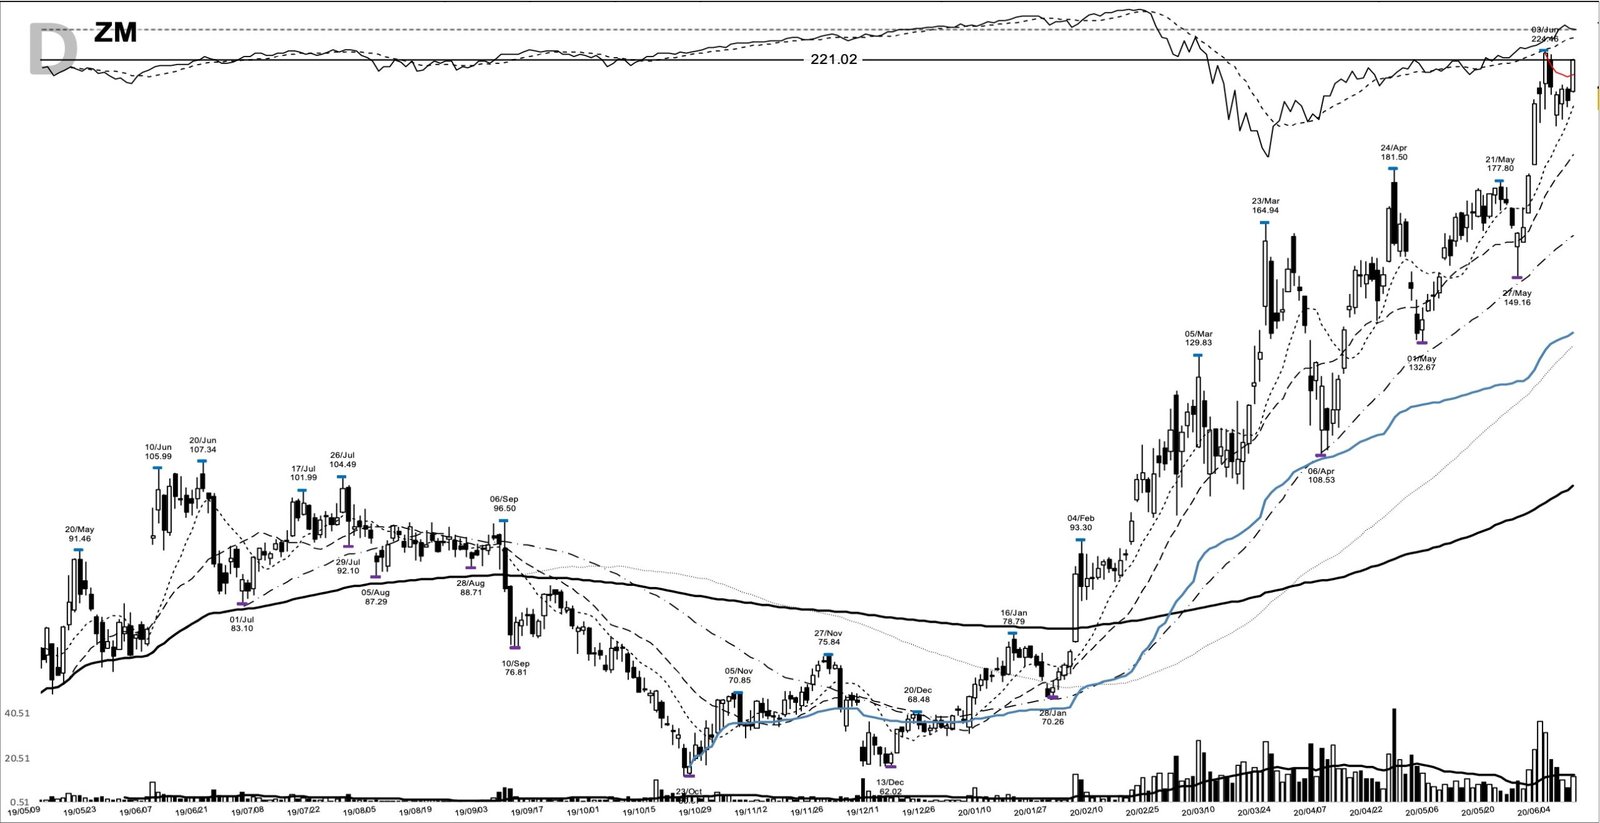
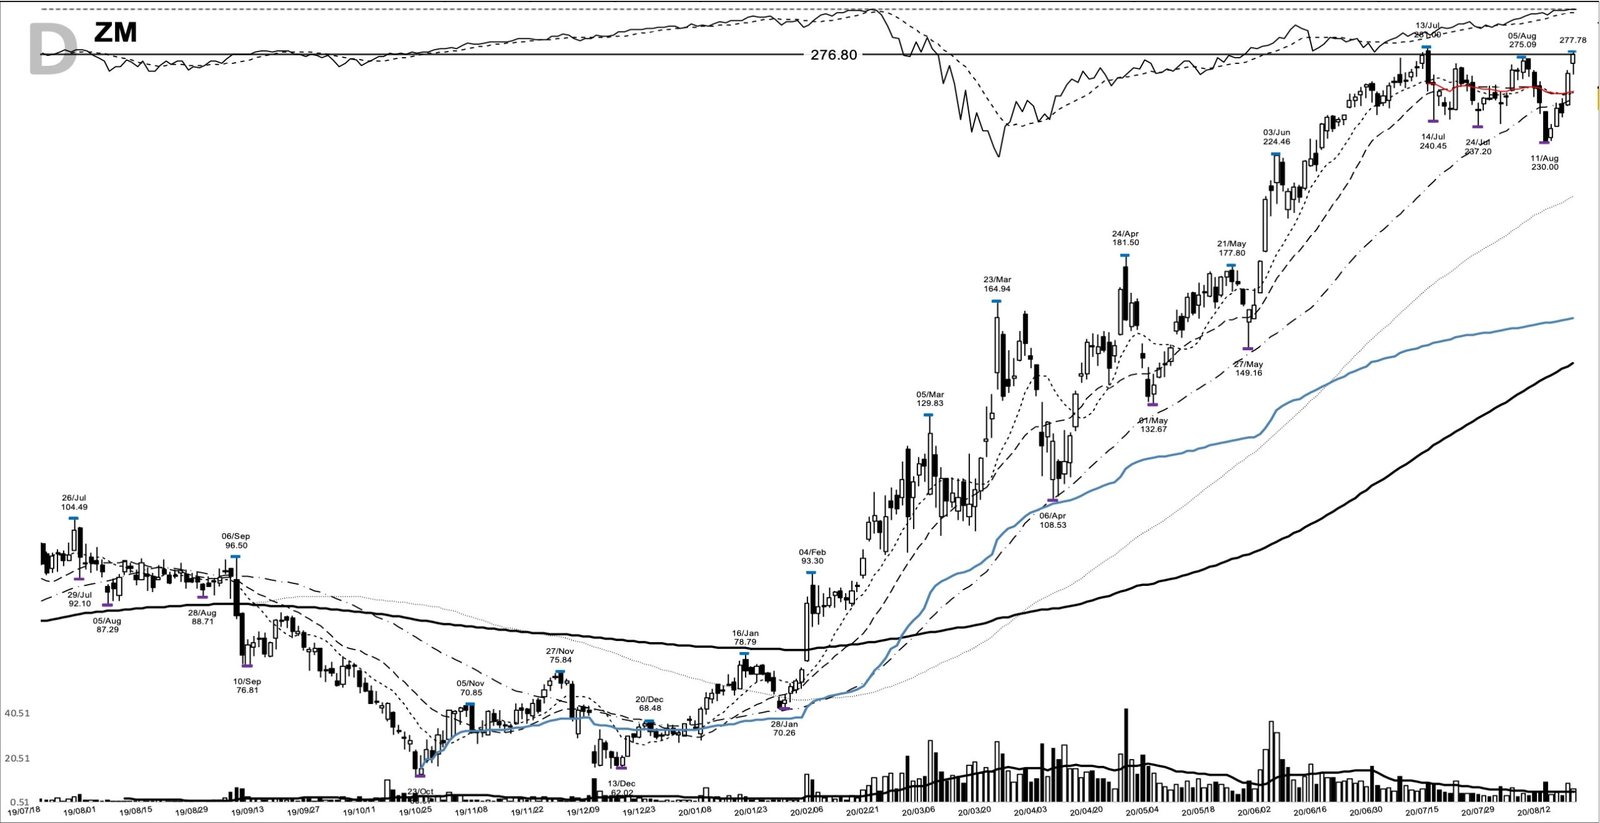
A trader using this pattern might’ve watched for the same thing the chart kept offering: higher lows, tight pauses, and fresh pushes on volume. The stock delivered them. From the 96.39 close, ZM worked through a series of bases at progressively higher prices, and each one marked a spot where a trend follower could’ve pressed the position. The 29 May close at 179.48 was up about 86%. The 10 June close at 221.02 had more than doubled the entry. By 18 August the close was 276.80, and by 18 September, 438.73.
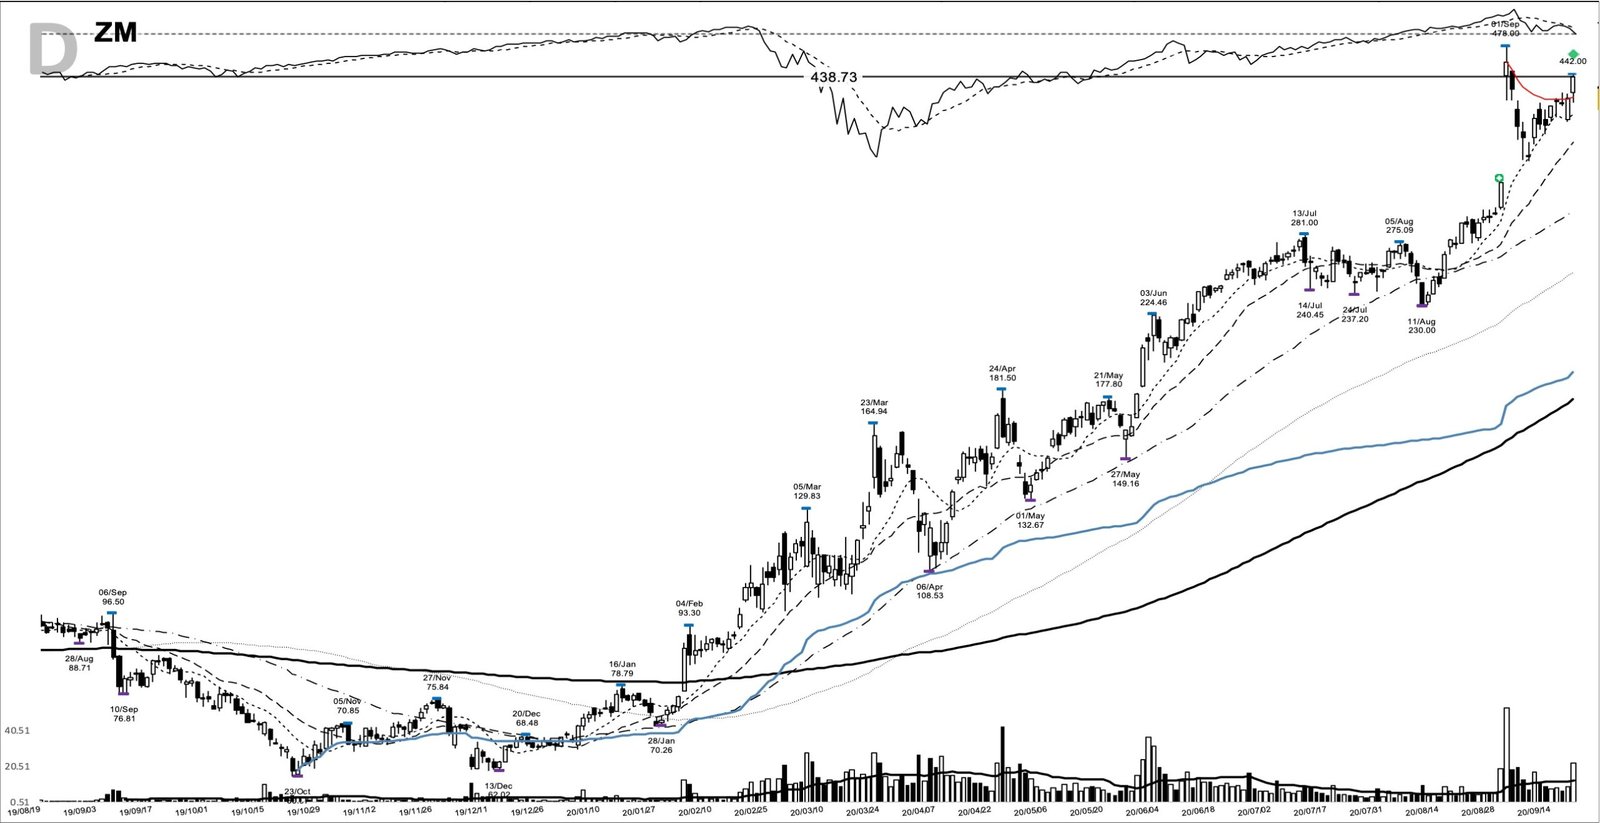
The final add landed on 9 October 2020 at a 492.41 close, roughly 411% above the entry. Price then topped out, peaking at 588.84 on 19 October before rolling over. The marked exit came on 2 November 2020 at a 453.00 close, closing the studied move 370% above the entry after 258 calendar days.
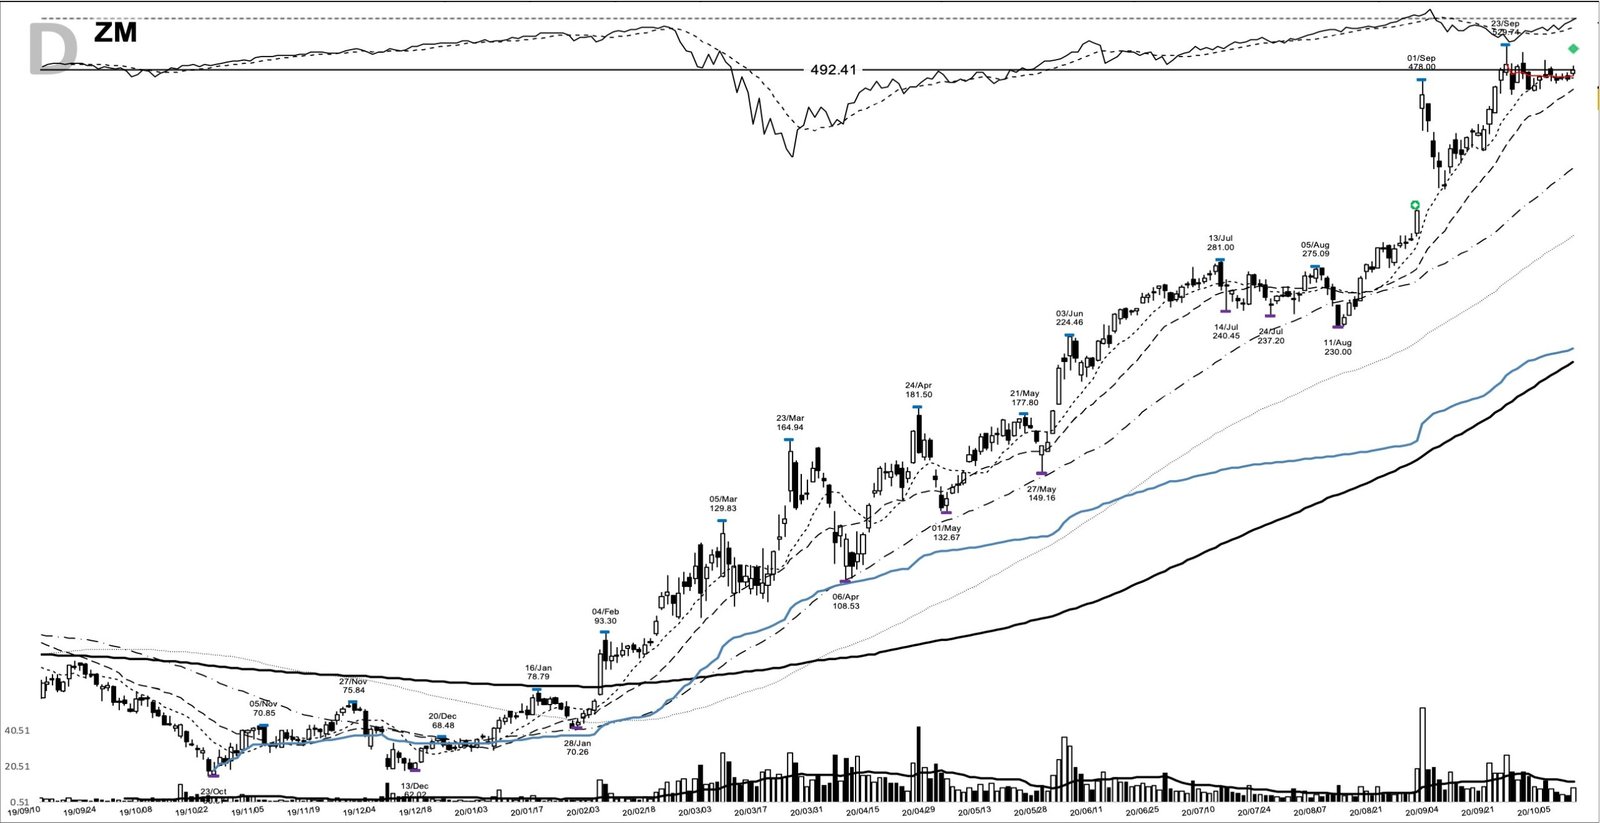
A conditional illustration makes the scale concrete: 1,000 dollars riding the full move from the 96.39 close to the 453.00 exit would have become about 4,700 dollars. The number is a measure of what trend following, held with discipline through a violent tape, could compound out of a single leader.
Common misreads on a breakout like this
The first misread’s treating the 96.39 close as clear air. That close landed right into the September 2019 base high of 96.50, still 10% under the June 2019 high of 107.34, with overhead supply at both levels. A trader chasing well above the pivot, rather than buying near it, took on the risk of the 86.52 shelf giving way.
The second misread’s reading the outcome backward. The clean chart hides how uncomfortable the first two weeks were, with the late-February correction dragging the stock down to 97.37 intraday. The pattern never promised a straight line, and a stop set too tight under the entry would’ve been taken out inside the first few sessions. The 1.8x volume was solid confirmation, but volume alone was never the whole signal.
The last misread’s survivorship. ZM ran because the business and the tape both cooperated, and studying one clean winner tells you nothing about how often the same base fails elsewhere. The honest way to read a single study is covered in our note on survivorship bias, and the relative-strength line is the tell that separated this leader from the dozens of bases that went nowhere.
The takeaway from Zoom’s 2020 run
ZM’s a clean picture of why trend followers hunt leaders in the first place. The edge came from recognising a profitable, fast-growing company clearing a proper pivot on rising volume with the market at its back, then holding the trend and adding into strength instead of taking a quick gain. Pattern recognition did the work that morning, well before the pandemic became the story. Learn the pattern. Ride the trend. Keep the gains.
Related studies
For more leaders that broke out of bases in the same era, see the TSLA base breakout, November 2019, the FUTU base breakout, May 2020, and the UPWK base breakout, June 2020. A new winner study lands most evenings.
Price and volume figures are computed from split-adjusted daily OHLCV data; company figures come from SEC filings where cited.
Educational content only. Not investment advice. Trading involves risk. You are responsible for your decisions.
Get the free Market Wisdom e-book
Join Trends and Breakouts — historical winners, breakout studies, and risk lessons. No spam, unsubscribe anytime.