NTAP is back on traders’ screens this week, in the days after its latest quarterly report, so it’s worth pulling an old chart back up and reading it properly. The NTAP base breakout of August 1999 is one I keep in my study archive, from back when the company traded as Network Appliance and built network-attached storage filers. Price was basing quietly under 16, and the entry on the chart landed at a close of 13.48, well below the level that later triggered the move. The result was a run of 542% over 216 days, from that August 1999 entry to a March 2000 exit.
Nothing about the entry bar looked special. The move that followed came from the base resolving, the trend extending, and repeated chances to add into strength. That’s the lesson worth keeping.
Key takeaways from NTAP’s 1999 run
- The setup was a six-month base, roughly 43% deep, with a pivot sitting at the prior 20-day high of 16.09.
- The entry closed at 13.48 on 12 August 1999, about 16% below that pivot, on volume of only around 1.1 times the 20-day average.
- Price closed back above the 16.09 pivot on 27 August 1999 at 16.11, and the trend was underway.
- Three chances to add into strength followed, at closes of 18.50, 25.86, and 56.56, on the way to a peak of 124.00 on 10 March 2000.
- The move closed on 15 March 2000 at 86.53, a gain of 541.7% held across 216 calendar days.
The NTAP trade at a glance
| Metric | Value |
|---|---|
| Ticker | NTAP |
| Study entry date (anticipatory) | 12 August 1999 |
| Entry close | $13.48 |
| Pivot (prior 20-day high) | $16.09 |
| Pivot cleared | 27 August 1999 at $16.11 |
| Volume vs 20-day average | 1.1x |
| Exit date | 15 March 2000 |
| Exit close | $86.53 |
| Gain | 541.7% |
| Calendar days | 216 |
| Peak before exit | $124.00 (10 March 2000) |
Reading the NTAP daily chart into 12 August 1999
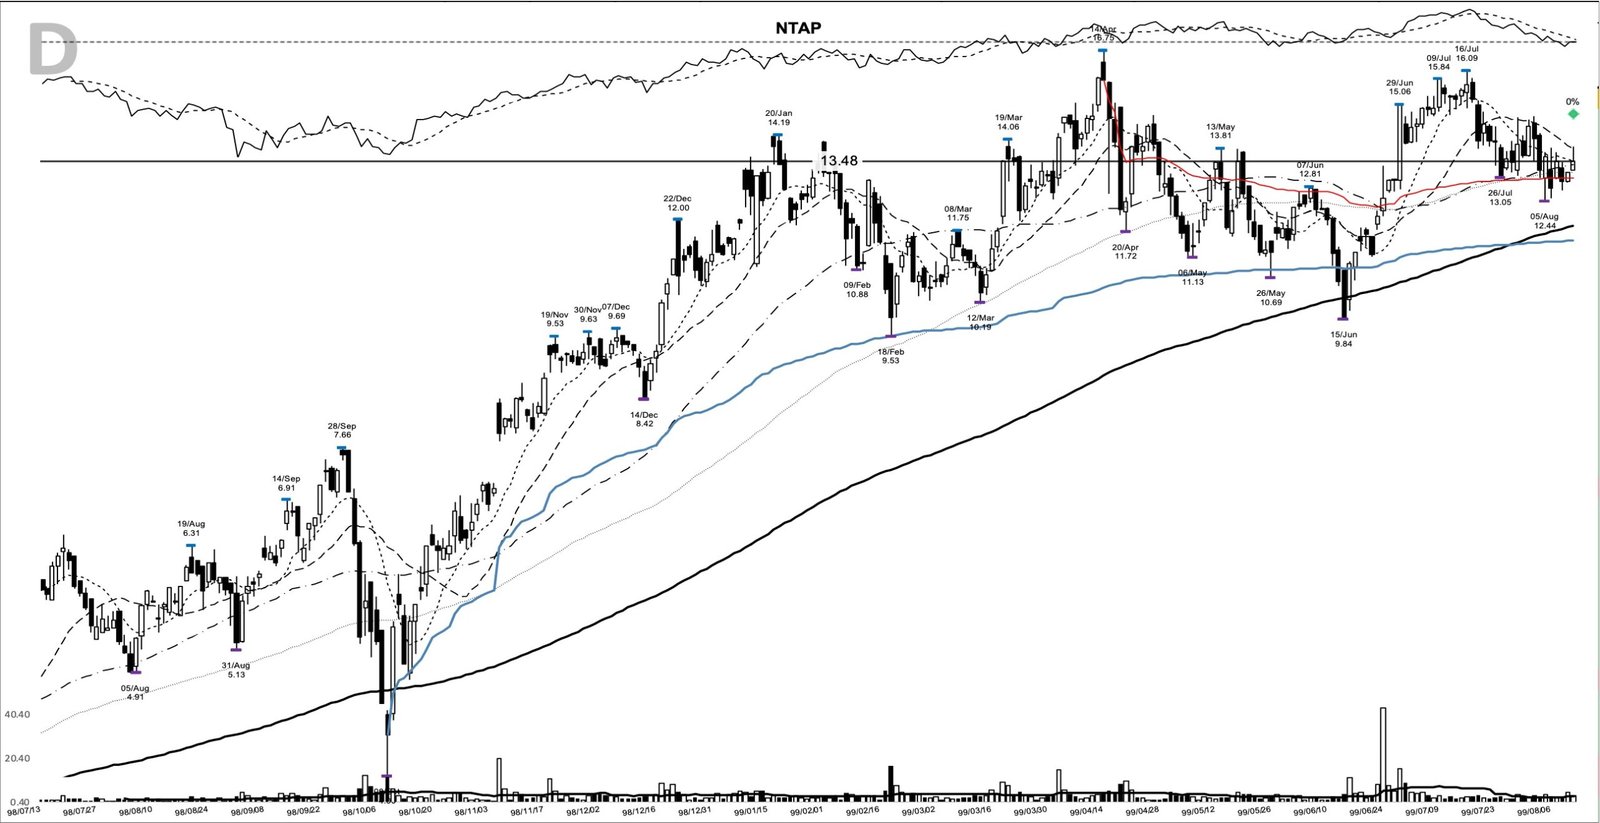
The chart covers about a year of daily bars. Price had tripled off the October 1998 low near 4.00 into the 16.75 high of 14 April 1999, then spent months chopping sideways in a wide base. Into August the stock pulled back to a shelf low of 12.44 on 5 August and turned up off its rising long-term moving average, the smooth line climbing underneath the bars.
The line running across the top of the chart is the relative strength line, and it had been grinding higher through the base. When that line makes ground while price is still stuck sideways, it’s a quiet tell that the stock is leading the market rather than lagging it. The horizontal marker sits at the 13.48 entry, still a full 19.5% under the April high.
Anatomy of the NTAP base breakout: a 43% base under the 16.09 pivot
Measured across the six months into the entry, the base ran about 43% deep, from the 16.75 high on 14 April down to a 9.53 low on 18 February. The pivot, the level a trader would treat as the trigger, was the prior 20-day high of 16.09, set on 16 July. That’s the line the pattern had to reclaim before it can be called resolved.
This is an anticipatory entry. The close of 13.48 on 12 August sat about 16% below the 16.09 pivot, so nothing was cleared or broken on that bar. Volume tells the same story: it ran about 1.1 times the 20-day average, so demand wasn’t the signal here, and reading the volume honestly would have kept a trader patient. Price didn’t close back above the pivot until 27 August 1999, at 16.11, and that’s where the base actually resolved.
The moving-average posture explains why an early buyer looked at it at all. At the entry, price was pressed against its 10-day line at 13.49, had just reclaimed its 50-day at 13.39, and sat a touch under its 20-day at 13.82. The stock was reclaiming its averages after a deep correction, the classic spot where a leader’s repaired but not yet extended. In the model-book tradition of William O’Neil, that repair mattered because the business underneath it was accelerating.
Network Appliance in 1999: the storage story behind the chart
Network Appliance, now NetApp, sold network-attached storage filers into the late-1990s internet buildout, when every growing company suddenly needed somewhere to put its data. The demand was real, and it wasn’t letting up. Per the company’s fiscal 1999 annual report, net sales grew about 74% to $289.4 million, driven by the F700 filer family launched that year and a widening installed base.
That kind of top-line growth is what separates a durable leader from a story stock, and it’s exactly the fundamental backdrop the CANSLIM approach looks for behind a technical base. The base formed on top of a business growing its sales by roughly 74% a year.
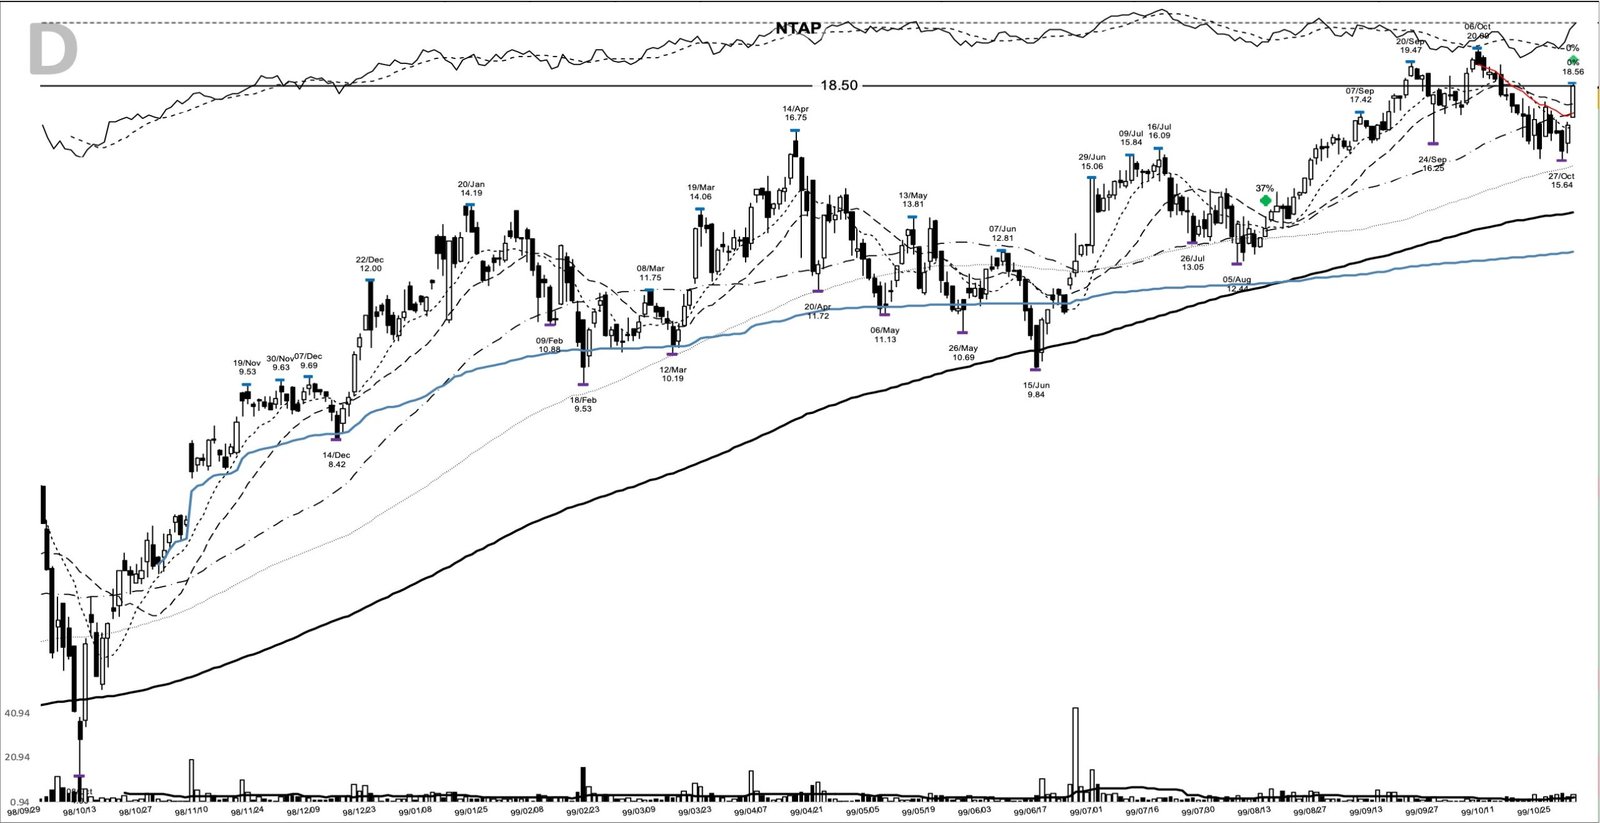
By late October the pivot was well behind price and the trend was confirmed. The close of 18.50 on 29 October sat about 37% above the August entry, and it marked the first clean chance to add into a stock that had already proven it could hold its breakout.
A Nasdaq running straight at its March 2000 top
The tape did a lot of the work here. The Nasdaq rose roughly 86% in 1999 and kept climbing into early 2000, peaking at 5,048 on 10 March 2000. It was a market that paid for leadership and momentum, and growth names extended for months at a time.
The alignment is hard to miss. NTAP’s own peak of 124.00 landed on 10 March 2000, the exact session the Nasdaq topped, and the exit came only days later. The backdrop that carried this trend for seven months is the same backdrop that ended it.
How a trend follower could have planned the NTAP entry
The watchlist tells were in place before any breakout: a leader basing above a rising long-term average, a relative strength line making ground, and a business growing revenue at 74%. Those are the conditions that put a name on a list, so you’re ready when the pivot gives way.
The plan a trend follower could have written that day used only levels the chart already gave. Enter on a close back above the 16.09 pivot. Set the initial stop below the 12.44 shelf from 5 August, or, for a wider structural stop, below the 9.53 base low from 18 February, the level where the whole pattern fails. Then trail the 10-day moving average, widening to the 20-day once the trade is well advanced.
The chart’s early entry took a different path. It bought at 13.48, roughly 16% below the pivot, off the 12.44 shelf, before the 16.09 clearance ever printed. That earns a lower cost basis, but it also demands a wider stop and more room to be wrong. The planned entry waits for proof; the early entry pays for a discount with added risk. They’re both defensible, and they aren’t the same trade.
How NTAP’s 216-day run played out
A trader using this pattern might have watched for the pivot to clear, then treated pullbacks toward the rising 10-day line as spots to hold through. That’s roughly how the record reads. The 16.09 pivot cleared on 27 August at 16.11, price worked up into the high teens by October, and the trend kept setting higher lows.
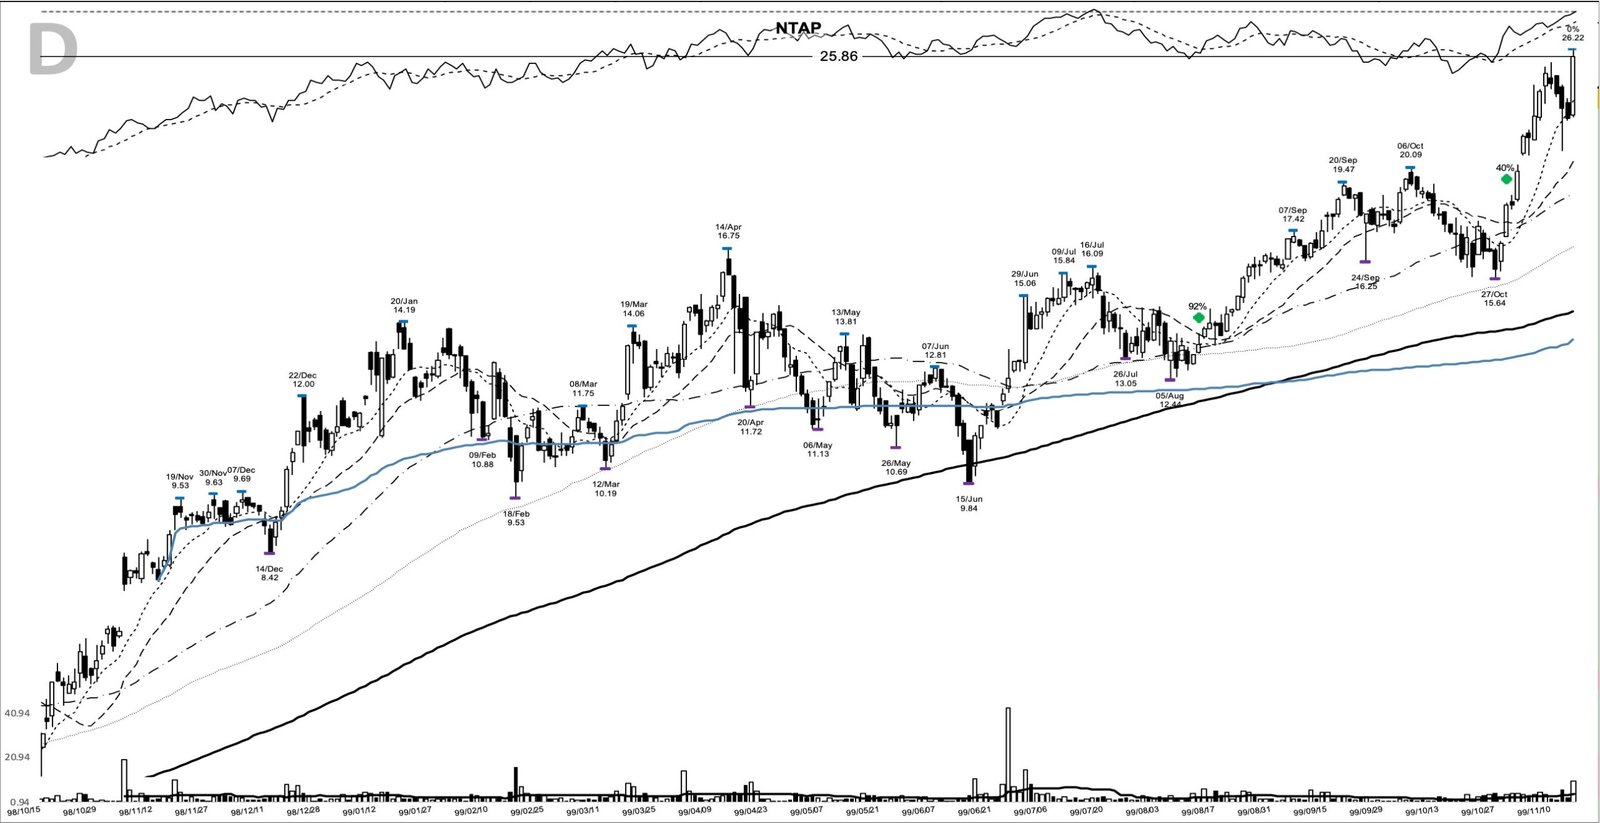
November brought a violent leg higher. The 16 November close of 25.86, on about 10.5 million shares, already sat 92% above the entry, and the next session ran to 31. That kind of gap is where pyramiding into a position gets tempting and dangerous at the same time, because the reward is real but the shakeout risk climbs with every extended add.
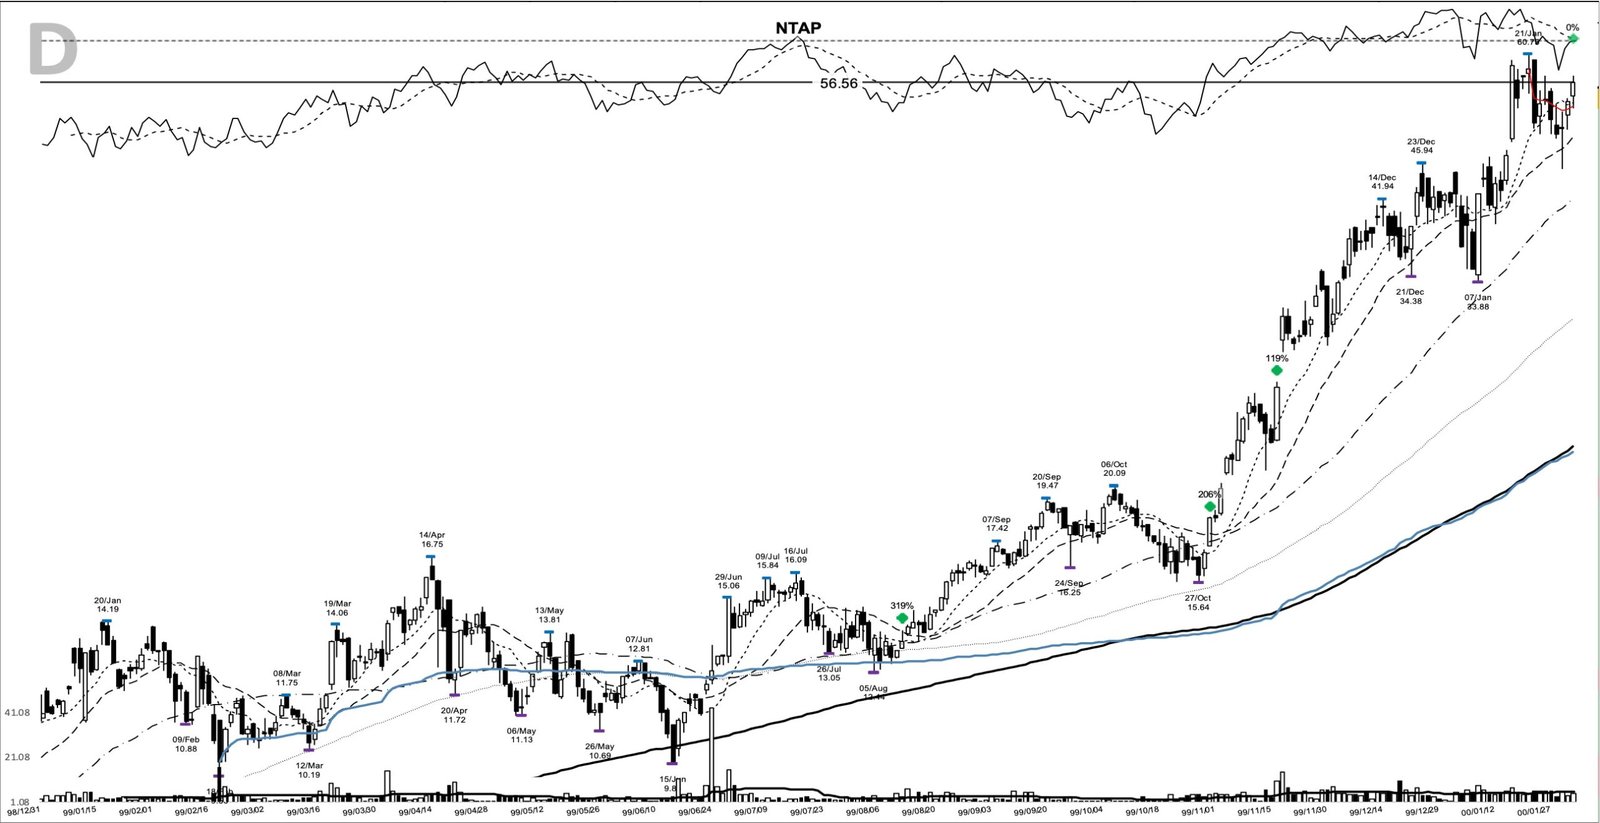
The trend didn’t stop there. The 2 February 2000 close of 56.56 was already about 320% above the August entry, and the stock kept extending into the froth of early 2000. Price reached its peak high of 124.00 on 10 March, 819.6% above the entry.
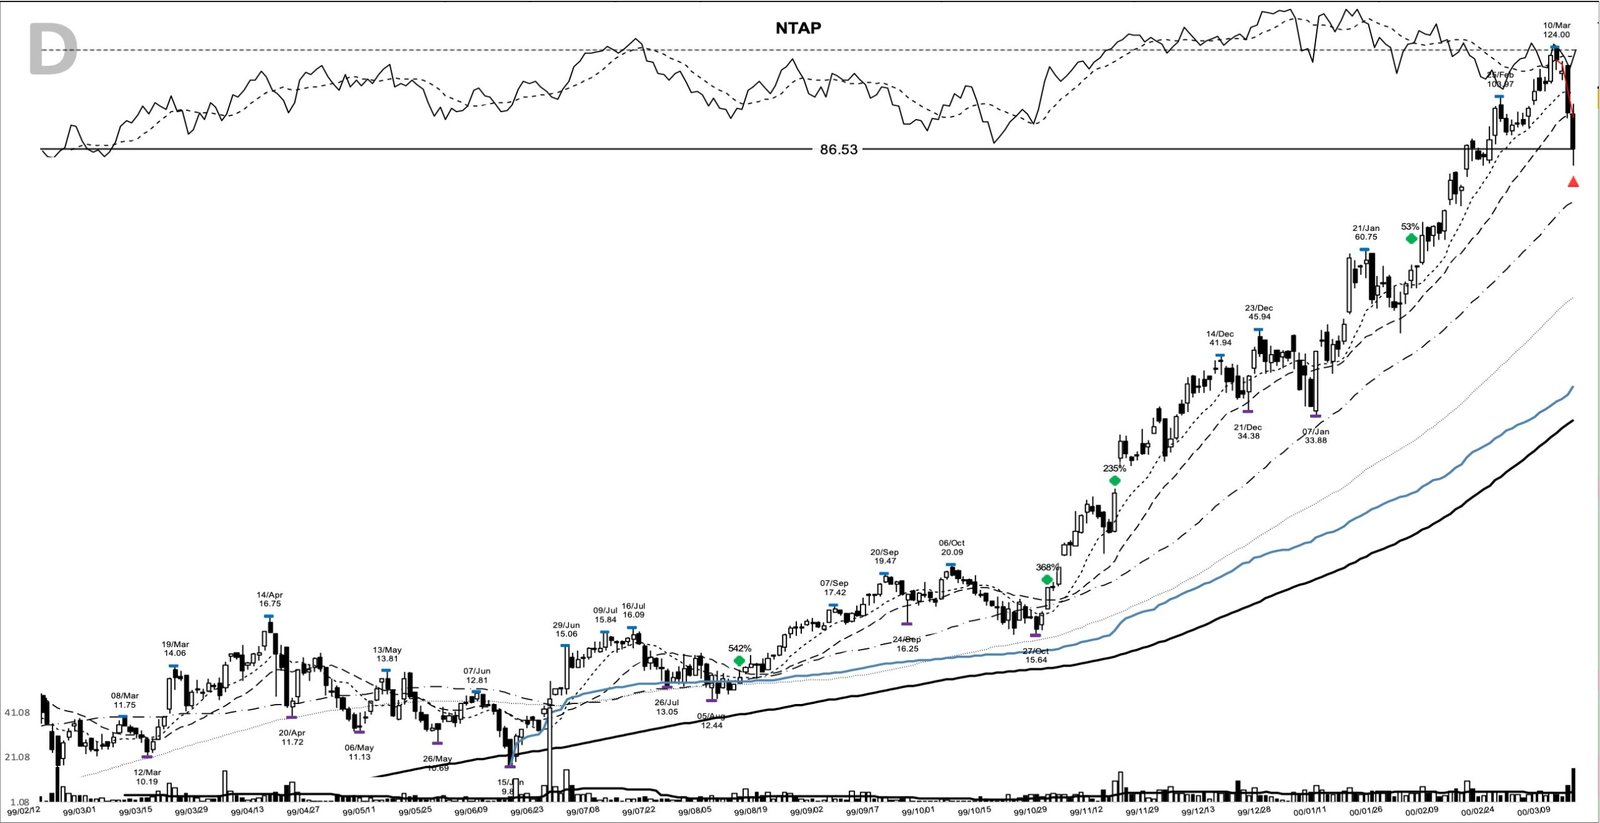
Then the character changed. On 15 March the stock opened at 98, traded down to 81.75, and closed at 86.53 on 16.5 million shares, the heaviest volume of the entire run. The marked exit closed the move there, up 541.7% from the entry. $1,000 riding the advance to the exit would have become about $6,417.
Where a setup like NTAP gets misread
The first misread is treating the entry bar as a breakout. Volume was only around 1.1 times average, price sat 16% under the pivot and 19.5% under the April high, and the base didn’t resolve until 27 August. Anyone who called 12 August a confirmed breakout was reading a signal that wasn’t there.
The second misread is chasing the vertical adds. By 16 November the stock was already up 92% and gapping on huge volume, and buying size into that kind of extension invites a sharp, fast pullback. A run to 31 the very next day is exactly the sort of action that punishes late buyers who mistake momentum for a low-risk entry.
The last one is underrating the base itself. A 43% correction is deep, and a deep base can keep failing instead of resolving. That is why the early buy needed the wider stop below 12.44 or 9.53, and why an early entry here carried real downside if the pattern rolled over.
Ride the leader, not the entry bar
The money in NTAP came from holding a 216-day trend in a real leader and adding into confirmed strength, not from nailing the 13.48 entry, which was early and imperfect. Get the leader right, respect the pivot, and let the trend and the stop do the heavy lifting. Learn the pattern. Ride the trend. Keep the gains.
Related studies worth a look: the MSTR base breakout from the same August 1999 window, the INCY base breakout of 1999, and the later TSLA base breakout of November 2019. A fresh winner study lands most evenings.
Price and volume figures are computed from split-adjusted daily OHLCV data; company figures come from SEC filings where cited.
Educational content only. Not investment advice. Trading involves risk. You are responsible for your decisions.
Get the free Market Wisdom e-book
Join Trends and Breakouts — historical winners, breakout studies, and risk lessons. No spam, unsubscribe anytime.