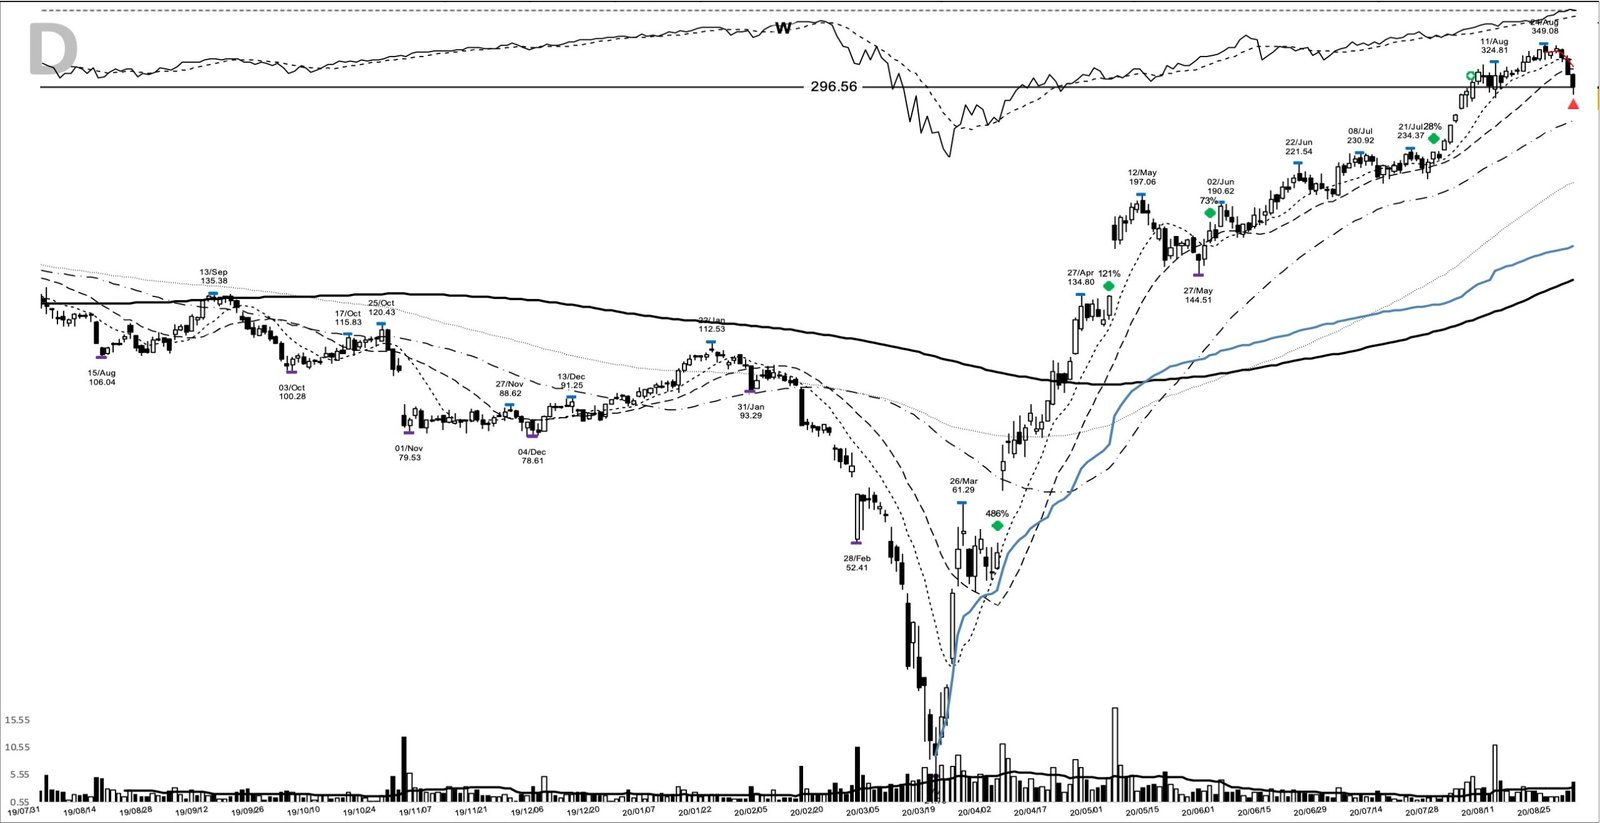
Wayfair (W) is trending again, sitting near the top of the day’s gainers on 27 July 2026 as brokers hike their price targets into the company’s 4 August earnings date and a five-day “Black Friday in July” sale pulls demand forward. When a name like this shows up on traders’ screens again, the old chart is worth pulling. The W base breakout of April 2020 turned an 82% COVID-crash washout into one of the sharpest trend moves on record: an entry on 3 April 2020 at a 50.63 close that ran to a 296.56 exit close on 31 August, up 485.7% over 150 calendar days.
It’s a useful case because almost nothing about the fundamentals said “leader” at the time. The company was losing money and its revenue growth was slowing. What it had was a violent oversold base, a demand shock, and a trend a follower could hold and add to. That’s the whole lesson here.
Key takeaways from the W trade
- The pattern was a base breakout out of an 82% decline. The pivot to clear was the 61.29 high of 26 March 2020.
- The entry sits on 3 April 2020 at a 50.63 close. By the 296.56 exit close on 31 August it was up 485.7%, a 150-day hold.
- At its best the stock ran to a 349.08 peak on 24 August, 589.5% above the entry.
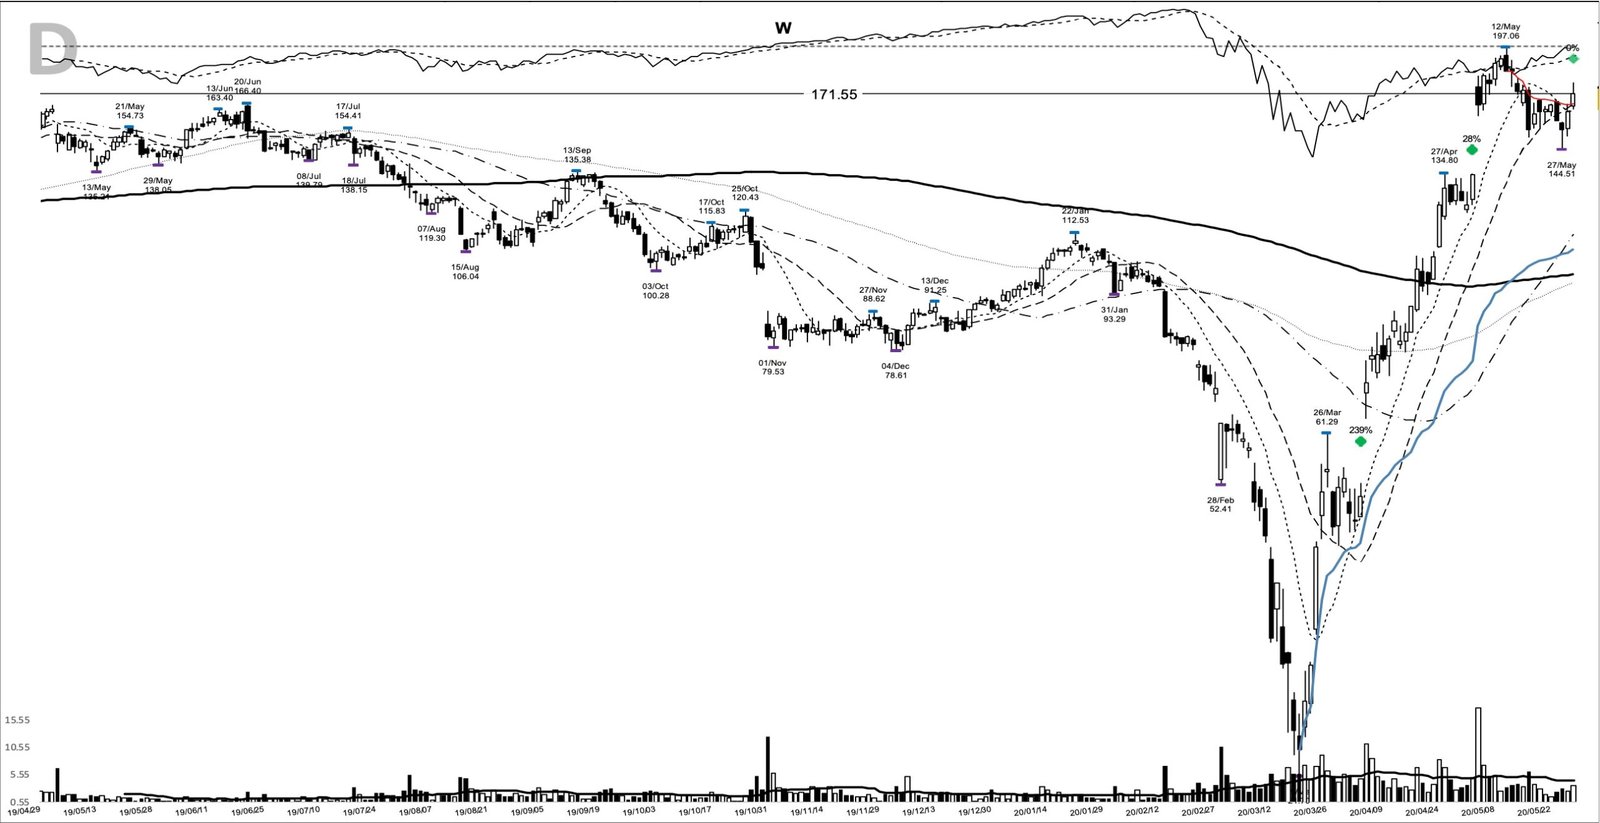
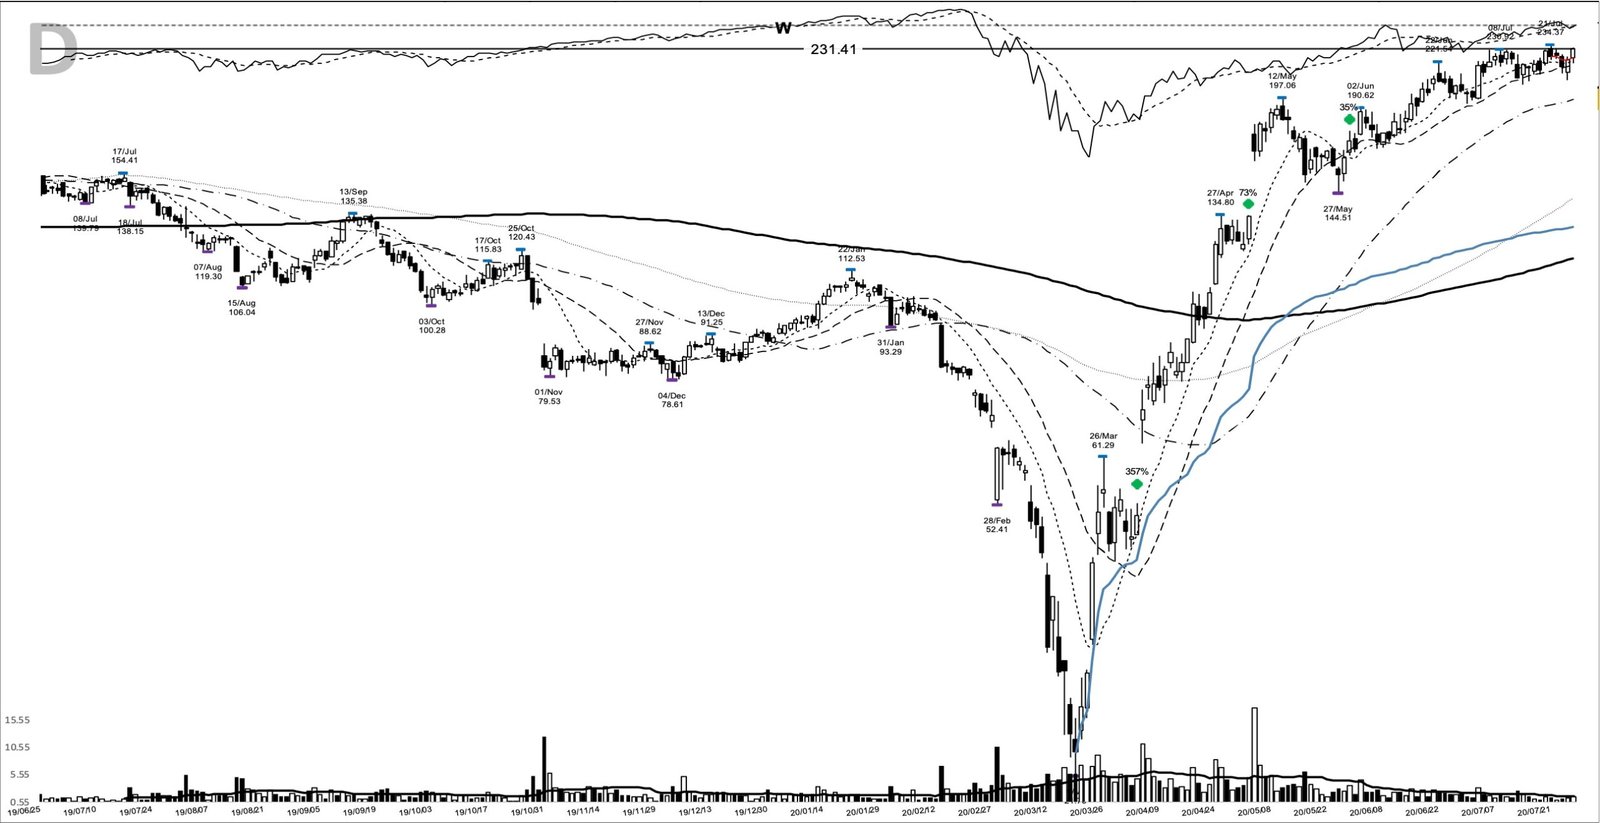
- There were three points to add on strength as the trend extended: 134.11 on 4 May, 171.55 on 29 May, and 231.41 on 27 July.
- The move followed price, not profits. Earnings stayed deeply negative through the setup, so this rewarded trend following over forecasting.
The W trade at a glance
| Ticker | W |
|---|---|
| Study entry date (anticipatory) | 3 April 2020 |
| Entry close | 50.63 |
| Pivot | 61.29 |
| Pivot cleared | 6 April 2020 at a close of 71.5 |
| Volume vs 20-day average | 0.9x |
| Exit date | 31 August 2020 |
| Exit close | 296.56 |
| Gain | +485.7% |
| Calendar days | 150 |
| Peak before exit | 349.08 (24 August 2020) |
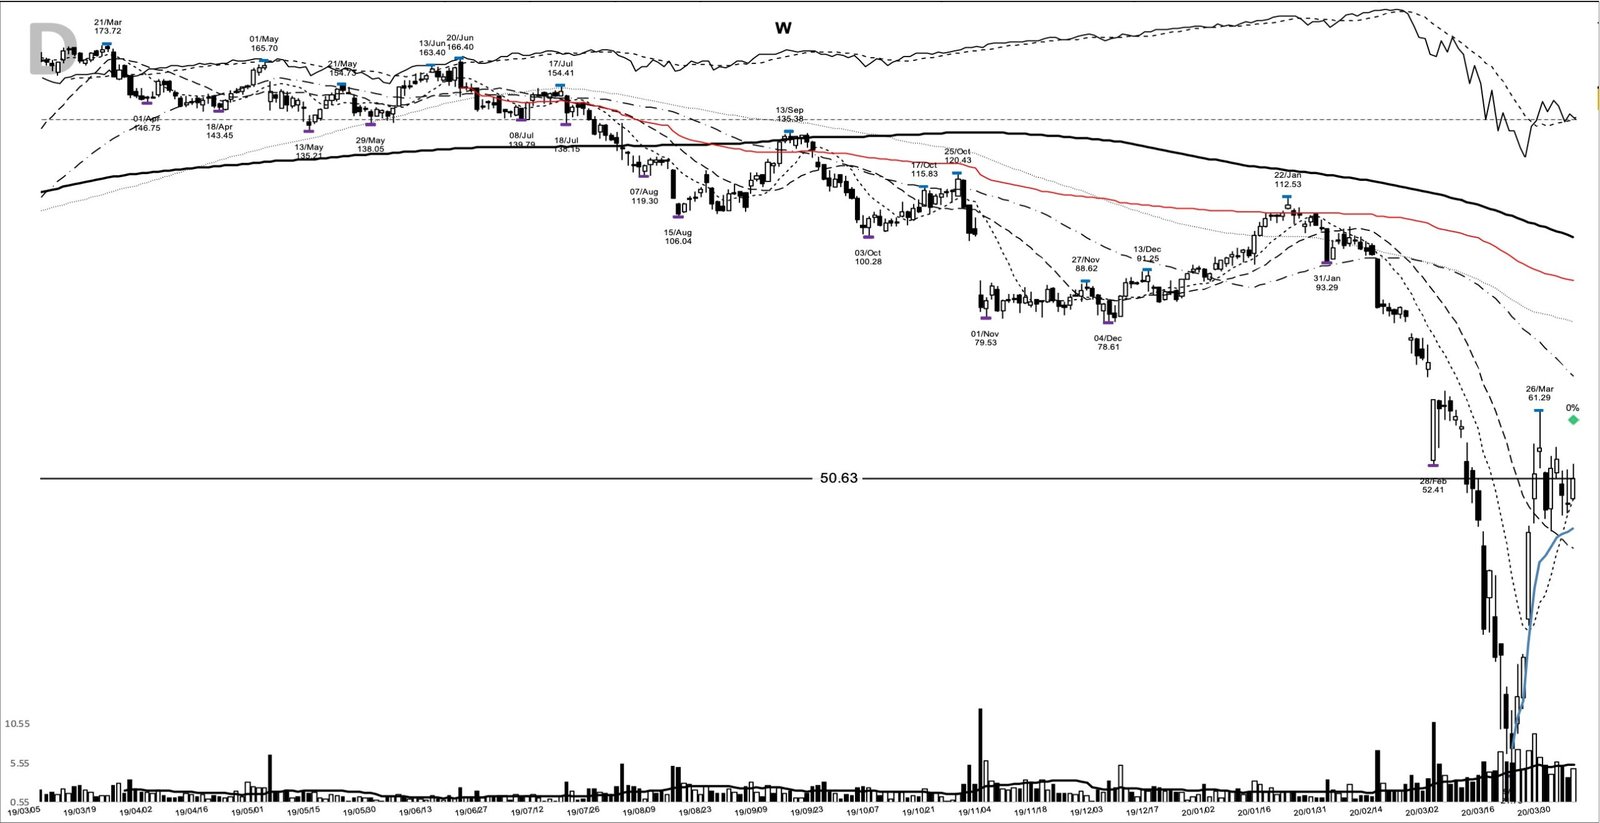
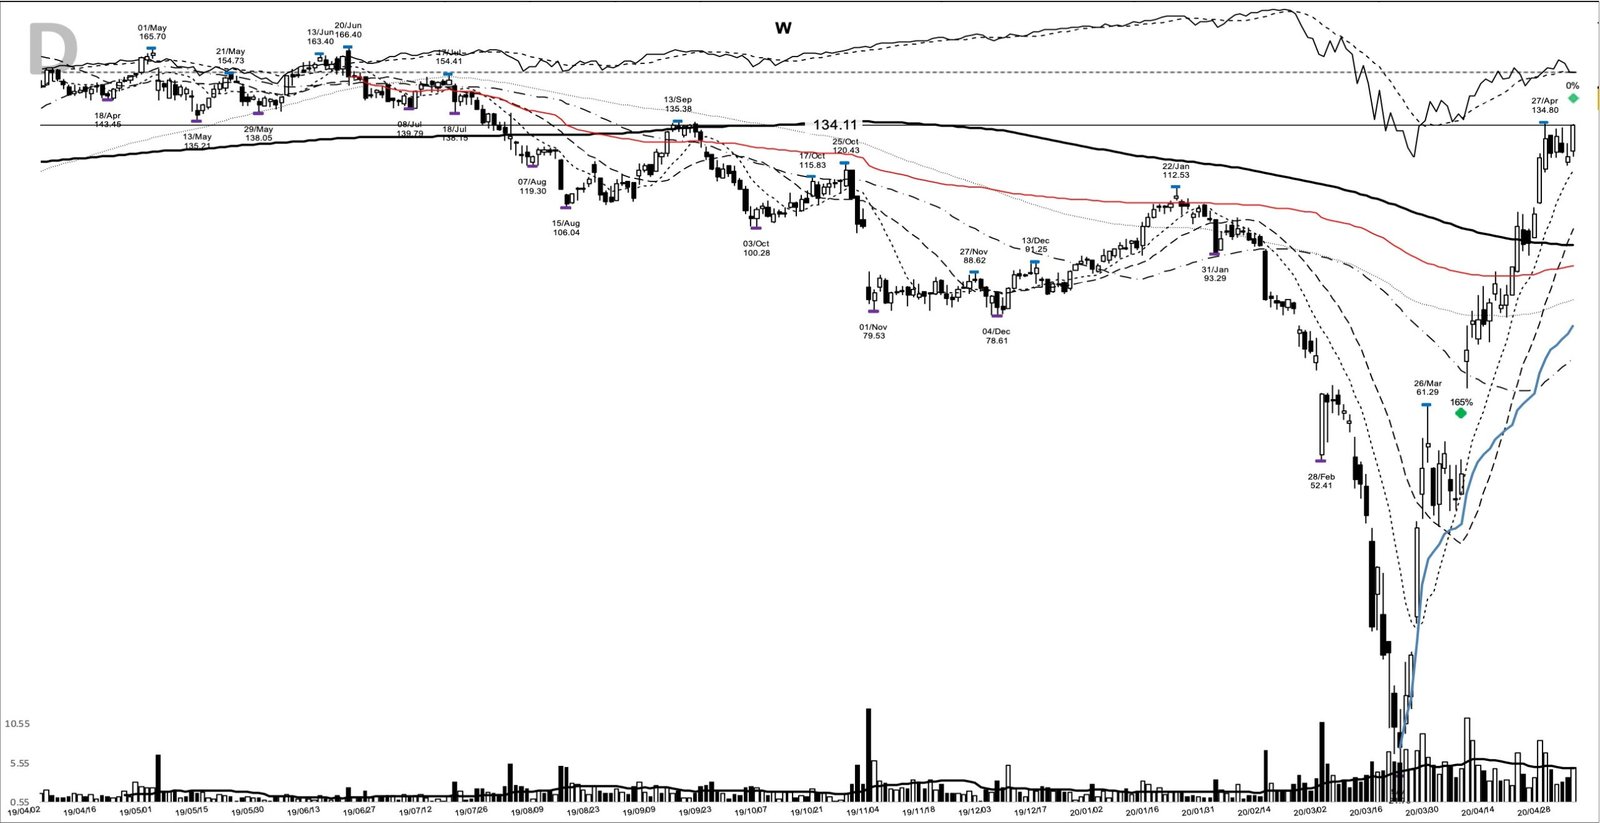
The chart below comes from my study archive. It runs from early 2019 through the entry day, so the whole decline and the turn sit in one frame.
How the W base breakout formed out of an 82% washout
Call the base what it was: a crash. Over the prior six months the stock fell 82%, from a 120.43 high on 25 October 2019 to a 21.70 low on 19 March 2020. The prior 52-week high was 166.40, set back on 20 June 2019, so the entry came 69.6% below where the stock had traded a year earlier.
Off the 21.70 low the reversal was fast. Price bounced to the 61.29 pivot, the 26 March high, then pulled back to a shelf at 43.61 on 30 March. The 3 April entry closed at 50.63, back above its rising 10-day line but still below that 61.29 pivot. The marked entry was therefore anticipatory: it preceded the pivot clearance, which price only reached on 6 April at a 71.50 close. Volume on the entry bar ran 0.9x the 20-day average, so the marked day itself was a quiet one.
The real thrust came two sessions later. On 6 April price gapped and closed at 71.50 on about 11.2 million shares, more than double the recent pace, and that’s where it cleared the 61.29 pivot. A gap like that on heavy volume is the demand shock printing on the tape. The classic template William O’Neil built, and that traders still study through his methods, pairs a tight base with accelerating earnings. This chart had the price structure. The earnings leg was missing, which is exactly what makes it worth studying.
What Wayfair’s business looked like in early 2020
Wayfair (NYSE: W) sells home goods online. Into the entry the revenue line was still growing, but the growth rate was fading: year-over-year revenue growth ran 47.4% in the second quarter of 2018, 41.6% a year later, 35.2% in the third quarter of 2019, and 19.8% by the first quarter of 2020, when revenue reached 2.33 billion dollars. On the bottom line the company was unprofitable and the losses were widening, with reported EPS of -1.98 and -2.94 in the second and third quarters of 2019.
So the setup carried a decelerating top line and no profits, the opposite of the accelerating-earnings leader the model book prefers. What changed was demand. Once stay-at-home orders spread in March 2020, spending shifted hard into home offices, kitchens, organization and children’s furniture, and Wayfair sat right in the path of it. Shares jumped about 37% on 6 April 2020 as that pull became visible. On 5 May the company flagged a sharp pickup, with online sales running roughly 90% above the prior year since 1 April, and the stock gapped again to a 165.88 close, one session after the first add point.
The tape that made the move possible
None of this happened in a vacuum. The broad market bottomed on 23 March 2020 and turned up hard through April, and in a recovery that violent the tape rewarded the most oversold, highest-beta names that also had a real demand story. Wayfair had both. That’s textbook Stage 2 behaviour after a Stage 4 decline, the sequence Weinstein stage analysis lays out. A trend this strong is a market call as much as it’s a call on one stock.
The calendar deserves honesty here. In the first days of April, disciplined trend followers were largely still out of a market classed as a deep correction, building watchlists for the next uptrend rather than buying it early. A marked entry that early carried correction-phase risk, which is why the stop under the shelf mattered more than usual; the confirmation that lets a position breathe arrived only as the recovery broadened through April.
Reading the setup before the pivot cleared
The trend posture into the entry was already constructive. Price had closed above its rising 10-day moving average for nine straight sessions and finished 5.9% above it, 50.63 against a 47.81 line. It had reclaimed the 20-day at 41.55 while still sitting under the falling 50-day at 67.57, which is what an early Stage 2 turn looks like.
The map was simple. The 61.29 pivot from 26 March was the level to clear. The 43.61 shelf from 30 March and the 21.70 base low from 19 March were where the structure would fail. Here’s the plan a trend follower could have written that day: buy the clearance of the 61.29 pivot, set the initial stop below the 43.61 shelf, or under the 21.70 base low for a wider structural stop, then trail the 10-day moving average and widen to the 20-day once the move was well advanced. As price extended, there were opportunities to add on strength, and the chart marks three of them at 134.11 on 4 May, 171.55 on 29 May, and 231.41 on 27 July. Sizing each add against the same risk unit is the discipline that keeps a pyramid from turning top-heavy, and it’s where position sizing earns its keep.
How the run actually unfolded
A trader using this pattern might have watched for the pivot to clear on expanding volume, then held while price stayed above its rising short-term averages. That’s close to what happened. From the 50.63 entry the stock ran with barely a real pause, through 134.11 by 4 May, to a 197.06 high on 12 May, and past 231 by late July.
The path wasn’t a straight line. After the 197.06 high on 12 May, price fell to a 153.84 close by 18 May and a 144.51 intraday low on 27 May, a pullback of roughly a quarter that would have shaken out anyone who chased the move extended and set a tight stop right underneath. Holding through that dip was the hard part, and it was also the whole trade. Price then pushed to a 349.08 peak on 24 August, 589.5% above the entry at its best. The exit closed the move at a 296.56 close on 31 August, up 485.7% over 150 calendar days. A 1,000 dollar stake riding the full move would have become about 5,857 dollars at that exit.
The exit’s timing had its own logic. By the very end of August the recovery had matured into a powerful but frothy uptrend, with unusually fast portfolio gains, stretched valuations and climax-style behaviour in the most-loved names, and the working discipline was to trim what had run hardest on its own deterioration. Selling a stock up seven-fold into that kind of heat is that discipline, applied.
Where this setup fools people
The first trap is volume. The entry bar didn’t come on heavy trade, running 0.9x the average, and the real volume expansion arrived two sessions later on the 6 April gap. Reading the 3 April bar itself as a volume breakout would have been wrong, and reading volume correctly is what separated the clearance from the coil.
The second trap is the fundamentals. This pattern promised nothing about profitability. The business was losing money with a slowing top line, and the whole advance ran on a demand shock while earnings stayed weak. Demand shocks fade, and many of the 2020 stay-at-home names gave much of the move back over the following two years.
The third trap is the base itself. An 82% washout is high-risk terrain, closer to a falling knife than a tidy consolidation, and the wide range put any sensible structural stop far below the entry. That distance forces smaller size, and it’s the price of buying an early reversal off a crash. Before you size a trade like this, remember that the smooth curve on the finished chart hides the mid-May drawdown and the daily noise that made holding uncomfortable in real time.
What the W base breakout teaches
The edge here was a reaction, not a prediction. Price reclaimed its short-term averages, cleared the 61.29 pivot on real demand, and a trend follower held and added while the trend kept its line. The earnings were ugly and the base was a crash, and the move still paid 485.7% because the trade tracked price through the advance and let the weak fundamentals sit in the background. That’s the pattern worth keeping when W flashes across the screen again.
Learn the pattern. Ride the trend. Keep the gains.
Related studies and lessons: support and resistance for anchoring the pivot and the shelf, survivorship bias in backtesting for why the winners we remember look inevitable, and the Kelly criterion for swing traders for sizing the risk on a wide-range setup. A new winner study lands most evenings.
Price and volume figures are computed from split-adjusted daily OHLCV data; company figures come from SEC filings where cited.
Educational content only. Not investment advice. Trading involves risk. You are responsible for your decisions.
Get the free Market Wisdom e-book
Join Trends and Breakouts — historical winners, breakout studies, and risk lessons. No spam, unsubscribe anytime.