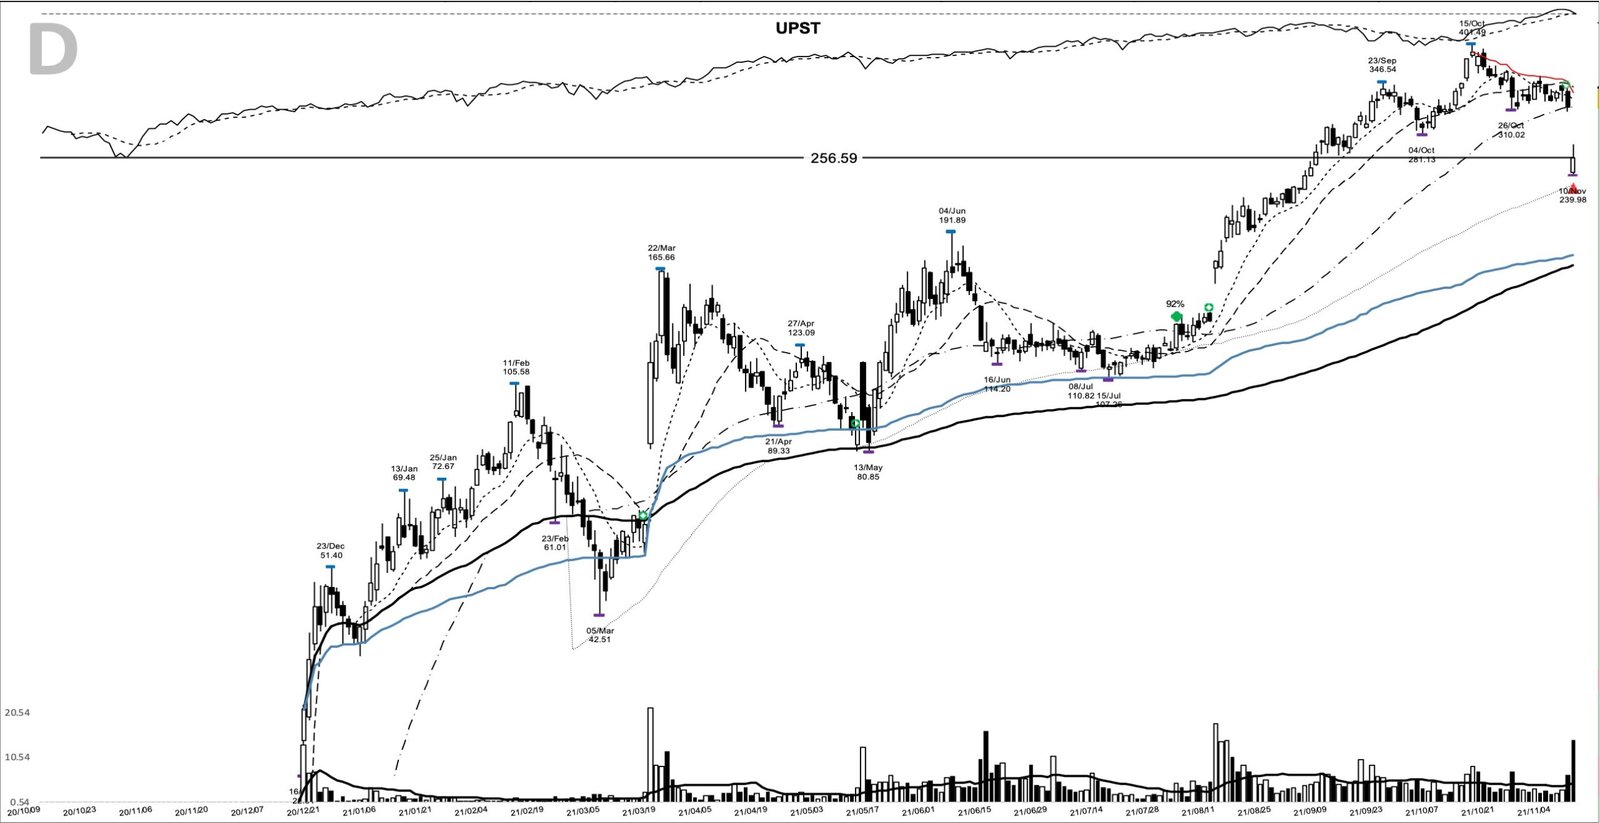
On 2 August 2021, Upstart Holdings closed at 133.41, up from 120.76 the session before and above a 130.9 high that had capped it since 12 July. Six sessions later the company reported its second quarter, and the next morning the stock opened 31.14 points higher. UPST is back on traders’ screens this week at number 70 on ApeWisdom’s mention rankings, and when it shows up there, this is the chart worth studying. The upst base breakout in one line: an August 2021 close out of a two-month base under the June high, followed by a gain of 92.3 percent in 100 calendar days.
Key takeaways from the UPST base breakout of August 2021
- The pattern: a two-month base below the 191.89 high of 4 June, with a 107.26 low on 15 July and a 130.9 pivot set on 12 July.
- The 2 August close of 133.41 cleared that pivot on volume 1.6 times the 20-day average.
- The move: +92.3 percent to a 256.59 exit on 10 November 2021, after a 401.49 peak on 15 October.
- The catalyst landed inside the trade: second-quarter revenue of 193,946,000 dollars, up 1,017.7 percent year over year, reported on 10 August.
- The lesson: two earnings gaps framed this trend, and the trailing rule picked in advance decided how much of a 200.9 percent peak gain survived the second one.
UPST’s August 2021 trade at a glance
| Field | Value |
|---|---|
| Ticker | UPST |
| Breakout date | 2 August 2021 |
| Breakout close | $133.41 |
| Volume vs 20-day average | 1.6x |
| Exit date | 10 November 2021 |
| Exit close | $256.59 |
| Gain | +92.3% |
| Calendar days | 100 |
| Peak before exit | $401.49 (15 October 2021) |
How UPST built a base under the 191.89 June high
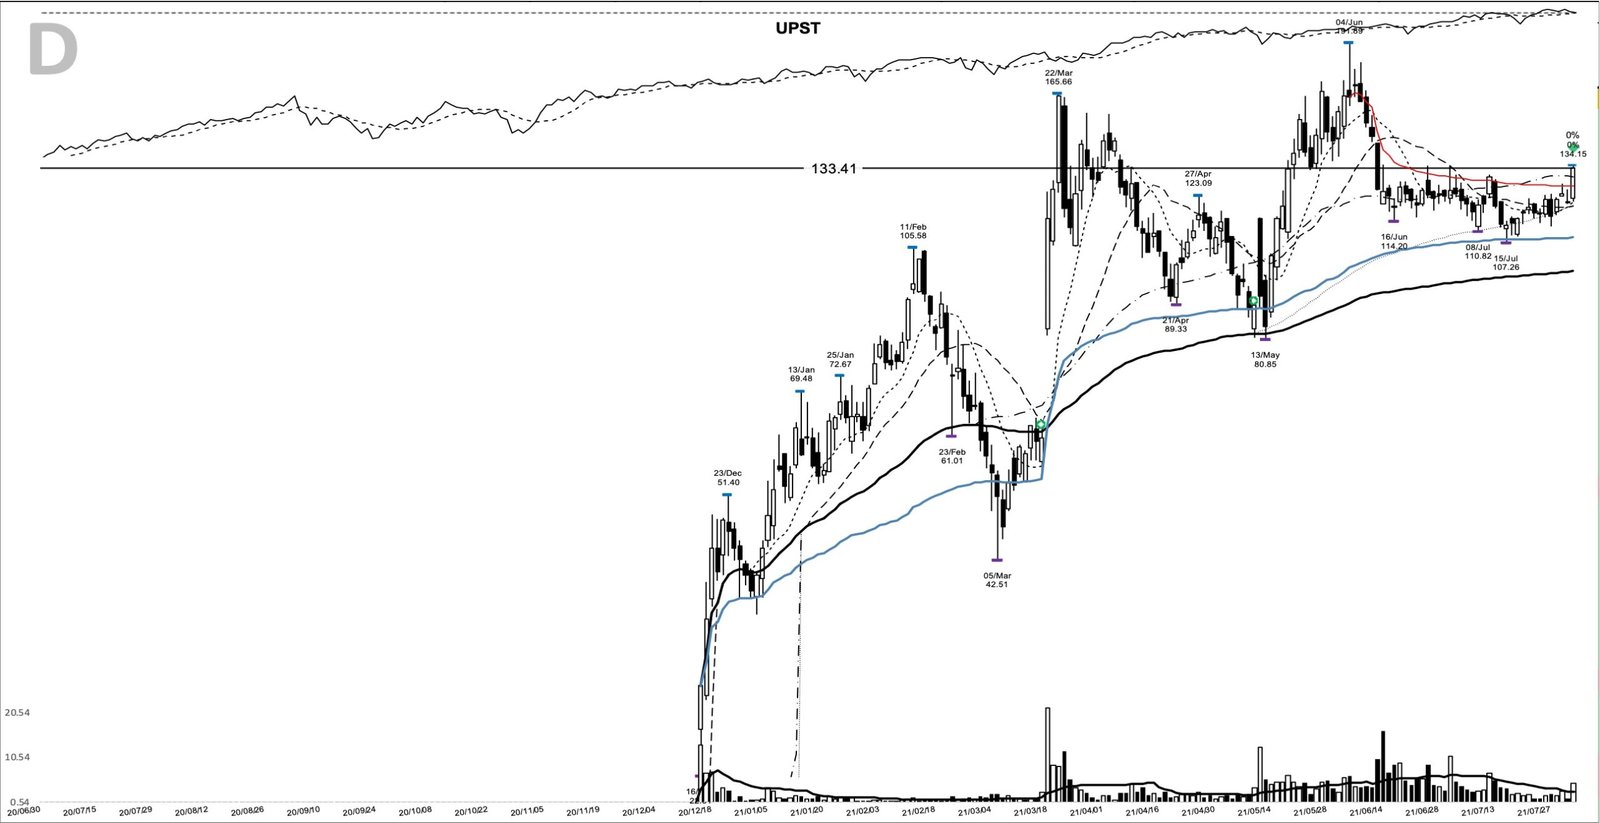
Upstart listed on Nasdaq on 16 December 2020 after pricing its IPO at 20 dollars, and closed its first session at 29.47. The stock reached 105.58 on 11 February, fell to 42.51 on 5 March, then closed at 115.09 on 18 March on 21,520,788 shares, the day after its first quarterly report as a public company. By 22 March it had touched 165.66. On 13 May it was back at 80.85.
From that May low the stock ran to 191.89 on 4 June, and the selling that followed came quickly. On 14 June it traded down to 120 on 16,323,875 shares, the heaviest volume since the March report. The lows then stepped down slowly: 114.2 on 16 June, 110.82 on 8 July, and 107.26 on 15 July, 44.1 percent under the June high. It was the stock’s first real post-IPO base above a rising long-term average.
The pivot came from a failed push. On 12 July UPST traded to 130.9 on 6,942,325 shares, closed at 129.9, and dropped to 119.38 the next day. After that, volume dried up. The stock traded 1,327,318 shares on 23 July and 1,317,666 on 30 July, against a 20-day average of 2,894,497. It’s the quiet you’d hope to see under a pivot.
The entry bar opened at 122, ranged from 121 to 134.15, and closed at 133.41, 10.5 percent above the prior close and near the top of the day. That close cleared the 130.9 pivot, so this one counts as a confirmed breakout. Volume of 4,736,552 shares ran 1.6 times the 20-day average, above normal without being a surge. The stock still sat 30.5 percent below its 52-week high.
Upstart in 2021: an AI lender that kept raising its forecast
Upstart ran a lending platform that used machine-learning models to approve personal loans for partner banks, which funded the loans and paid Upstart fees. In its first report as a public company on 17 March 2021, it also announced a deal to buy Prodigy Software, a dealership software provider, to push into auto loans.
The numbers moved fast. Per SEC filings, revenue for the March 2021 quarter was 121,345,000 dollars, up 89.6 percent year over year, with EPS of 0.11. With that report on 11 May, the company lifted its full-year revenue forecast from 500 million to 600 million dollars. That was the latest quarter public on 2 August. The June quarter, reported on 10 August, came in at 193,946,000 dollars, 1,017.7 percent above a pandemic-hit 17,353,000 a year earlier, with EPS of 0.39 against a loss of 0.42. The full-year forecast went to 750 million.
That is the earnings acceleration the William O’Neil school screens for, with one caveat. Upstart’s growth depended on banks and investors keeping their appetite for its loans, and the stock swung hard on each report.
Summer 2021: index records over a thinning rally
The broad tape was mixed. Per Oppenheimer’s August 2021 market update, the S&P 500 and Nasdaq set records several times that month, and growth and technology shares outperformed cyclicals. Under the surface it was harder going. Bespoke’s July review noted a concern among bulls that the rally was thinning. Against that backdrop, UPST’s own catalyst was six sessions away.
Preparing for the 130.9 pivot
On the entry day the 10-day, 20-day, and 50-day moving averages sat at 120.77, 119.47, and 130.21. The 133.41 close was 10.5 percent above the 10-day line, 2.5 percent above the 50-day, and the fourth straight close above the 10-day. The breakout pulled price back over the 50-day line.
Three things would have put UPST on a watchlist before 2 August: the March and May earnings reactions, which showed how hard the stock moved on results; a base that held above its rising long-term average through the June selloff; and the late-July volume dry-up under 130.9, with the June-quarter report still ahead.
A plan for that day might have been an entry on a close above the 130.9 pivot, with an initial stop below the 112.6 shelf low of 27 July, 20.81 points or 15.6 percent under the 133.41 close. The 107.26 low of 15 July marked where the July base would fail. The six-month structure low of 42.51 from 5 March sat far too deep to serve as a practical stop. Once the trade had room, a trader might trail the 10-day moving average and widen to the 20-day once the move was well advanced. Because the breakout was confirmed, the plan and the study entry coincide here. The stop was wide, so position size would have had to shrink to match it.
From 133.41 to 401.49 and the 10 November gap
The first sessions were unconvincing. UPST closed at 128.68 on 3 August and 127.98 on 4 August, back under the pivot, while the shelf held well above 112.6. By 10 August it closed at 135.68, only 1.7 percent above the entry.
Then came the report. On 11 August the stock opened at 166.82 and closed at 171.2 on 17,993,626 shares, a textbook earnings gap that held. On 13 August it closed at 203.29, its first close above the 191.89 June high. The climb reached 346.54 on 23 September.
UPST closed under its 10-day line for the first time since the entry on 30 September, at 316.44, 137.2 percent above the entry. A 10-day trail would have ended there. On 4 October it closed at 289.77, under the 20-day line, with an intraday low of 281.13. Upstart’s auto-lending software, built on the Prodigy deal, launched on 6 October, and the stock ran to its 401.49 peak on 15 October, closing that day at 390.
The peak didn’t hold. On 26 October UPST fell to 327.08 on 7,312,937 shares, back under the 20-day line for the first time since early October and still 145.2 percent above the entry. On 9 November, after the close, the company reported third-quarter revenue up 250 percent. Its fourth-quarter outlook pointed to flat revenue from the third quarter, and on 10 November the stock opened at 242.75, traded down to 239.98, and closed at 256.59 on 14,442,647 shares, down 18.2 percent on the day. That was the exit: 92.3 percent above the entry, 100 calendar days later, 36.1 percent under the peak. A thousand dollars riding the full move would have become 1,923 dollars.
Where the UPST chart can mislead
The first trap is the week after the entry. Closes at 128.68 and 127.98 put price back inside the base, and that reads like a failed breakout. The 112.6 shelf low was never threatened, so a stop below it survived.
The second is the pivot itself. A 20-day high is a short window, and the late-June highs of 134.5 on 24 June and 134.38 on 30 June still sat above the 133.41 close. The first close above both came on 9 August at 137.19. Measuring extension from the pivot helps, but on this chart overhead supply sat just a few points higher.
The third is the credit for the gain. Before the report the breakout had produced 1.7 percent. The base timed the entry, and the August earnings gap supplied the move. A trail can’t protect against a gap like 10 November either: every one of the moving-average exits above, at 316.44, 289.77, or 327.08, would have kept more than the 256.59 close.
What UPST teaches about holding a leader through earnings
The setup on 2 August was ordinary on the surface: a two-month base, a modest volume pickup, and a close over 130.9. What made it work was the report six sessions later, and what cut it back was the report three months after that. With a stock that moves this hard on results, the trailing rule and the stop distance have to be settled before each report, because the gap decides the price you actually get.
Learn the pattern. Ride the trend. Keep the gains.
Related studies: the CAR base breakout of 2021 and the AMC base breakout of 2021 from the same market. A new winner study lands most evenings.
Price and volume figures are computed from split-adjusted daily OHLCV data; company figures come from SEC filings where cited.
Educational content only. Not investment advice. Trading involves risk. You are responsible for your decisions.
Get the free Market Wisdom e-book
Join Trends and Breakouts — historical winners, breakout studies, and risk lessons. No spam, unsubscribe anytime.