FSLY is back on traders’ screens this week, climbing the StockTwits trending list, so it’s a good moment to pull up the chart that made it worth studying in the first place. Look past the ticker and you get a clean lesson in what a real leader looks like the day it clears resistance: the FSLY base breakout of May 2020. From the 7 May 2020 entry at a close of 33.58, this move ran 96 calendar days for a realized gain of 123%, and handed more than a triple at its peak.
The setup was not subtle. Fastly reported first-quarter results after the close on 6 May 2020, and the next session the stock gapped straight through months of overhead supply on its heaviest volume since listing. What followed is a case in trend following: an entry on the breakout, a chance to add on the way up, and an exit when the trend finally cracked. When FSLY surfaces on the trending list again, this is the chart worth having in front of you.
Key takeaways from FSLY’s May 2020 breakout
- The pattern was a base breakout that resolved on an earnings gap, clearing the 25.23 pivot and closing at 33.58 on 7 May 2020.
- Volume on the breakout day ran 9.1 times the 20-day average, the clearest tell that real demand stood behind the move.
- The entry-to-exit move was 123.2% over 96 calendar days, from 33.58 to 74.96.
- The 15 June 2020 session, with the stock already up about 55% from the entry, offered a chance to add into strength.
- Price peaked intraday at 117.79 on 5 August 2020, up 250.8% from the entry, before the trend broke.
FSLY at a glance: May to August 2020
| Field | Value |
|---|---|
| Ticker | FSLY |
| Breakout date | 7 May 2020 |
| Breakout close (entry reference) | $33.58 |
| Volume vs 20-day average | 9.1x |
| Exit date | 11 August 2020 |
| Exit close | $74.96 |
| Gain | +123.2% |
| Calendar days held | 96 |
| Peak before exit | $117.79 (5 August 2020) |
How the FSLY base breakout formed under 25.23
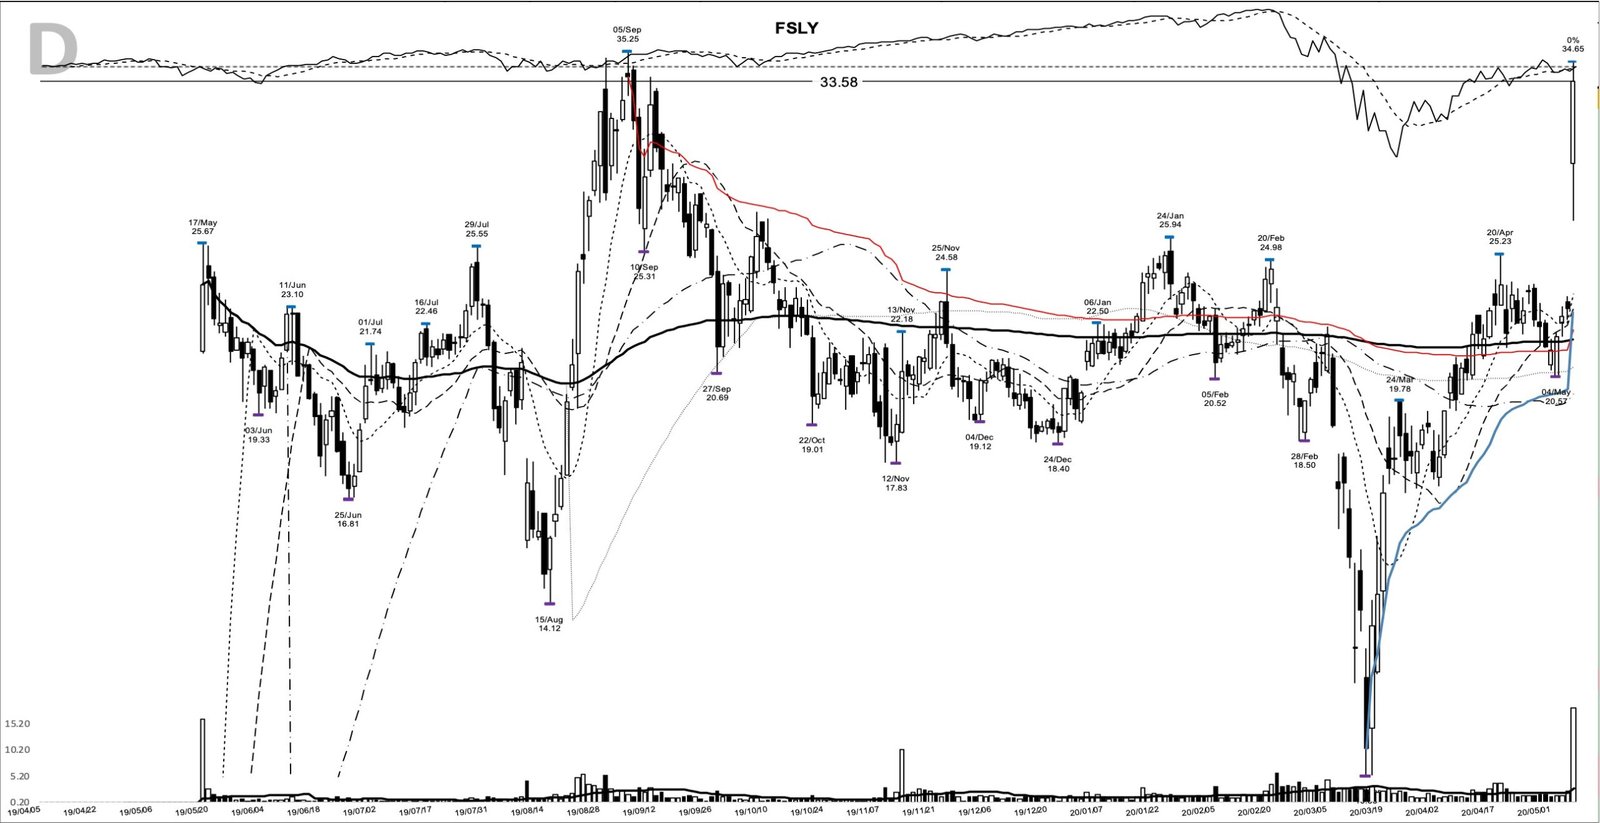
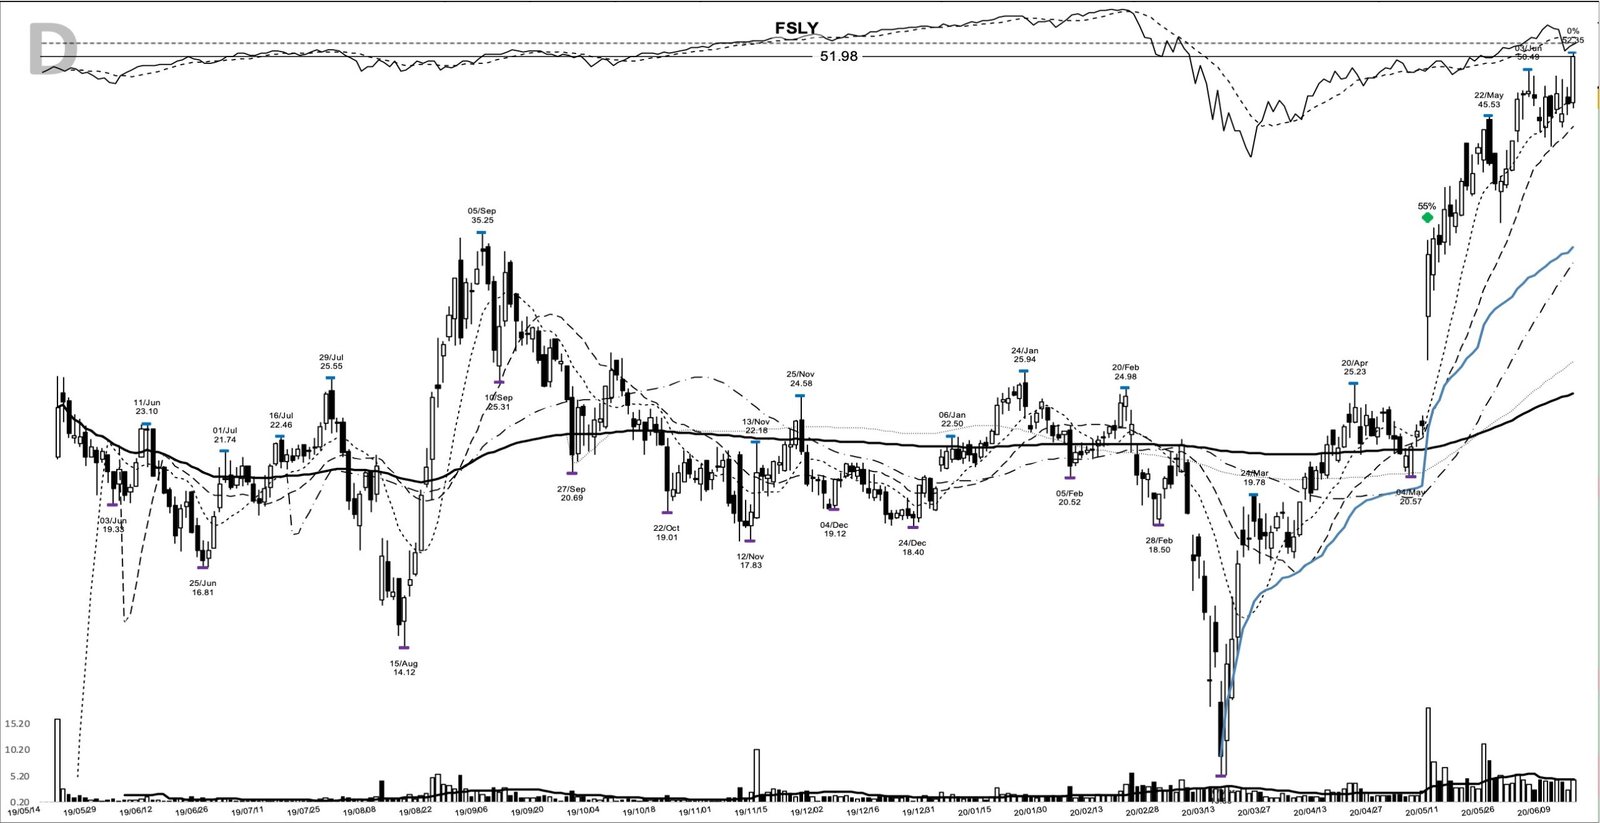
The chart above comes from my study archive, marked at the 7 May breakout. Read it left to right and the story is all there. Fastly listed in May 2019, chopped through the back half of the year, and set a prior high of 35.25 on 5 September 2019 that would sit as resistance overhead for months.
Then came the crash. The COVID selloff drove the stock from a January high of 25.94 down to 10.63 on 16 March 2020, a base 59% deep measured top to bottom. That is not a tidy flat base, and the depth matters later. Price then recovered in a sharp V through April and coiled, putting in a 20-day pivot high of 25.23 on 20 April and a shelf low of 20.57 on 4 May.
The breakout bar did the rest. On 7 May the stock gapped from the prior close of 23.05, opened at 29.30, ran to 34.65, and closed at 33.58, near the top of its range. Volume printed 18.2 million shares against a 20-day average near 2.0 million, or 9.1 times normal. A close that clears the pivot on that kind of participation is the demand signature a leader leaves behind.
What Fastly’s business was doing in spring 2020
The story behind the gap was direct. Fastly runs an edge cloud platform, the plumbing that delivers websites and apps quickly, and its first-quarter report landed just as the world moved indoors. Management pointed to a jump in platform traffic from social-distancing orders in late March, and the quarter came in well ahead of expectations. Analysts responded in kind, with one desk lifting its target after what it called a “wow” quarter and guide.
That is the model-book frame: a leading product in a group the market suddenly needed, with demand accelerating into the report. What matters for the chart is that the fundamentals gave the move a reason to keep going, so the tape and the volume did the talking rather than a single quarterly figure.
The tape behind the 7 May gap
Context made the breakout tradable. The broad market was rebounding hard off the late-March 2020 crash low, and high-growth software names were leading the bounce rather than lagging it. A breakout into a rising market has the wind at its back; the same gap in a tape that is rolling over is far more likely to fail. You can see the recovery on the chart itself, in the near-vertical climb from the March low back toward the old highs.
By early May the rebound had graduated from bounce to confirmed advance, and the telling detail was how fresh growth breakouts kept surviving their own earnings reports. Trust in the economy was scarce that spring, so the discipline fell back on stops, and FSLY’s gap gave a clean level to hang one under.
Spotting the FSLY setup before the 7 May gap
Could a trend follower have been ready for this? The posture into the pivot said yes, with one honest caveat. Into early May, price had reclaimed its moving averages after the crash, sitting above the 10-day (23.62), 20-day (23.07), and 50-day (20.00) lines, with three straight closes above the 10-day into the pivot. The shelf between the 20.57 low and the 25.23 pivot was the tell: a stock coiling just under resistance in a recovering market.
The plan almost writes itself. A trader using this pattern might have set an alert on a move through the 25.23 pivot, with an initial stop below the 20.57 shelf low, or below the 10.63 base low where the whole structure would fail. Above the pivot, the trailing job belongs to the 10-day moving average early, widening to the 20-day once the move is well advanced.
Here is the caveat, and it is the load-bearing part. The breakout was a gap, so the clean 25.23 trigger was never available at 25.23. The stock opened the session at 29.30, already well through the pivot and 42% above its 10-day line. Buying a gap that extended is chasing, and it changes the math: the entry sits higher, the stop sits further away, and the position has to be sized down to hold the risk steady.
How the FSLY trade played out, 33.58 to 117.79
From the entry, the trend did the heavy lifting. The stock pushed higher through late May and June, and the 15 June session, closing at 51.98 with the position already up about 55%, was a textbook chance to add into a proven trend rather than a hopeful one. Adds work when the trend is confirming itself, and this one was.
The advance accelerated into the summer. FSLY tagged an intraday high of 117.79 on 5 August, up 250.8% from the entry, and closed that day at 108.92. Then the fundamental crack showed up. On its 5 August earnings call, Fastly disclosed that a single customer, TikTok, accounted for about 12% of first-half revenue, at the exact moment a US ban on the app was being floated.
The tape reacted at once: 108.92 on 5 August, then 89.64, 79.33, 78.18, and 74.96 as the trend broke. The exit closed the move at 74.96 on 11 August, up 123% from the entry over 96 calendar days. A trend follower does not need to call the top; the job is to hold while the trend holds and step aside when it does not. On a conditional basis, $1,000 riding the full move would have become about $2,232.
August’s wider tape endorsed the quick exit. The advance was still standing but visibly being tested, with the indexes diverging and enough distribution on the books that the working judgment had become stock-by-stock rather than market-wide. When a leader snaps its trend inside a tape like that, the trend follower’s answer is already written.
Where the FSLY breakout could have fooled you
The first trap is the base itself. A 59% base is deep enough that most breakouts out of it fail, because a decline that steep usually signals real damage to the business. This one worked because a genuine earnings catalyst met a recovering market, a rare pairing. Treat every deep V-base as a green light and most of them will hand you a loss.
The second trap is the straight-line illusion. The move was jagged. Within two weeks of the entry the stock ran to 44.25 on 21 May and closed back at 41.08 the next day, and the eventual decline from the 117.79 peak erased more than a third of the price inside a week. A breakout tells you demand showed up on one day. It promises nothing about the days after, which is why the stop and the trail matter more than the entry ever will.
What the FSLY chart leaves you with
Strip it down and the trade rests on three plain facts: a pivot at 25.23, a close of 33.58 on 9.1 times average volume, and a market that let the trend run. The entry got you in, the trailing average kept you in, and a broken trend got you out near 74.96. Everything between was noise to sit through.
The lesson travels well past one ticker. Find a leader clearing resistance on real volume, define where you are wrong before you act, and let the trend decide how long you stay. Learn the pattern. Ride the trend. Keep the gains.
Related studies
More on the ideas behind this setup: trend following, William O’Neil on base breakouts in market leaders, and price gaps explained for the earnings-gap entry. A new winner study lands here most evenings.
Price and volume figures are computed from split-adjusted daily OHLCV data; company figures come from SEC filings where cited.
Educational content only. Not investment advice. Trading involves risk. You are responsible for your decisions.
Get the free Market Wisdom e-book
Join Trends and Breakouts — historical winners, breakout studies, and risk lessons. No spam, unsubscribe anytime.