AXSM is back on traders’ screens this week, after the FDA accepted Axsome Therapeutics’ filing for a new narcolepsy drug in mid-July 2026. The chart that’s worth studying, though, is the one from 2019, the run that first put the stock on the map. Back then Axsome was a small, pre-revenue biotech whose value rode on whether a depression drug would read out well in trials. The AXSM base breakout that resolved in March 2019 ran +865% over 308 calendar days, a trend-following move off a deep base and a string of clinical wins.
Here’s the uncomfortable part of that story: the tape led the whole way, and no earnings model could have, because there weren’t any earnings. The charts below come from my study archive.
Key takeaways from the AXSM base breakout
- A base breakout off a deep six-month base, its low sitting 82% beneath the 10.80 pivot. The entry was an early 9.04 reclaim off the 7.64 shelf, a week before the pivot gave way.
- The realized move was +865% over 308 calendar days, from the 7 March 2019 entry at 9.04 to the 9 January 2020 exit close of 87.24.
- The stock peaked at 109.94 on 30 December 2019, so the paper gain briefly cleared 1,100% before the trend rolled over.
- The chart offered several add points as price broke to new highs, among them a 15.48 close in April and 20.63 in October.
- The company had no revenue and no profit. Following price and a defined stop caught this move, not the fundamentals.
The AXSM trade at a glance, March 2019 to January 2020
| Field | Value |
|---|---|
| Ticker | AXSM |
| Study entry date (anticipatory) | 7 March 2019 |
| Entry close | 9.04 |
| Pivot | 10.8 |
| Pivot cleared | 15 March 2019 at a close of 10.9 |
| Volume vs 20-day average | 1.8x |
| Exit date | 9 January 2020 |
| Exit close | 87.24 |
| Gain | 865.0% |
| Calendar days | 308 |
| Peak before exit | 109.94 (30 December 2019) |
How the AXSM base breakout formed after the depression-data gap
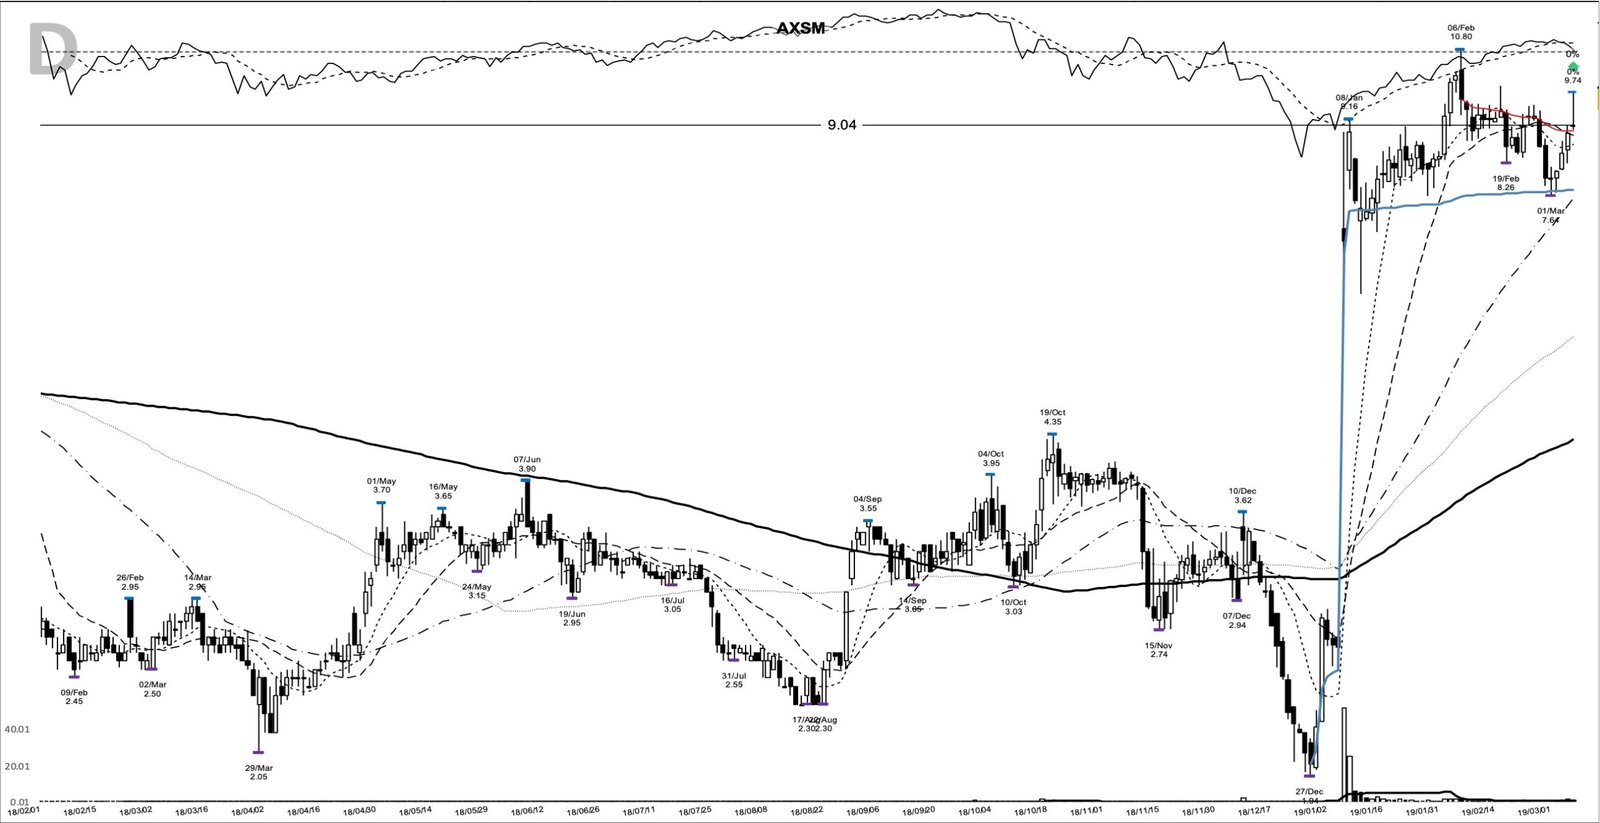
Read this chart left to right and the base tells its story in two acts. Through all of 2018 the stock ground sideways and lower, drifting to a 1.94 low on 27 December 2018. Then a single vertical bar changes everything: on 7 January 2019 it gapped from a 2.63 Friday close straight to an 8.89 intraday high on roughly 52 million shares, its heaviest volume ever. That was the ASCEND depression-drug readout, and it reset the whole base higher.
What formed over the next eight weeks is the setup that mattered. Price built a tight range between a 7.64 shelf low on 1 March and the 10.80 high from 6 February, digesting the gap without giving it back. The evidence marks the entry at the 9.04 close on 7 March, an early reclaim as the stock turned up off that shelf on volume running 1.8 times its 20-day average. That reclaim, not a clean break of the old high, is what the study flags.
The study classifies this as an anticipatory entry: the 9.04 buy came ahead of the 10.80 pivot, which price did not clear until a 10.90 close on 15 March. At 9.04 the stock was still 16% below the pivot, inside the top of the base. The advance pressed on, an 11.47 close on 18 March and a 12.95 close on 19 March on 3.6 million shares. For the mechanics of that opening bar, price gaps and reading volume are worth understanding before the entry, not after.
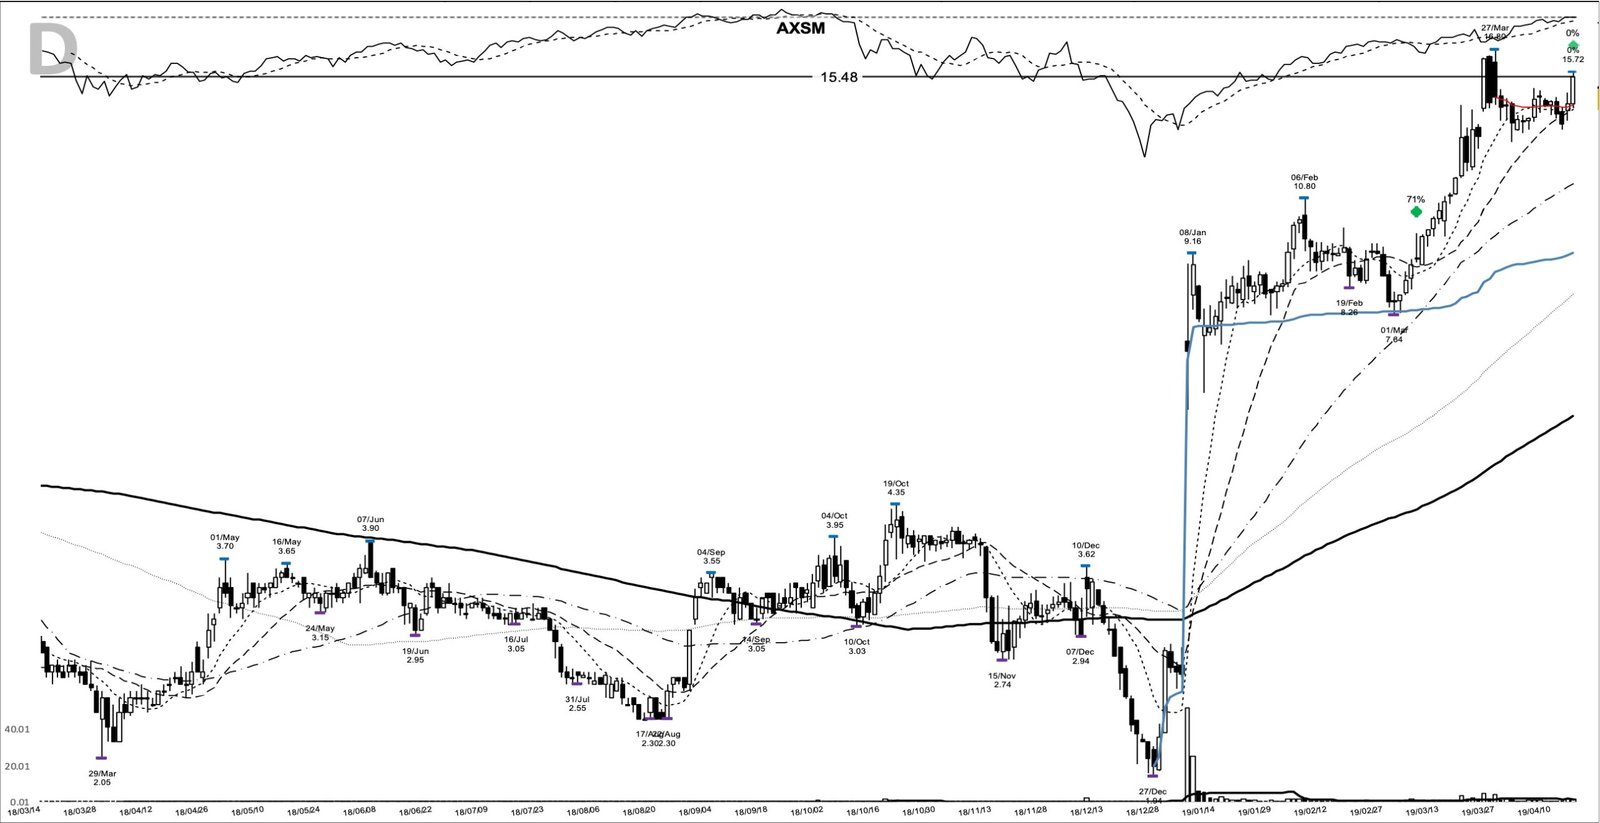
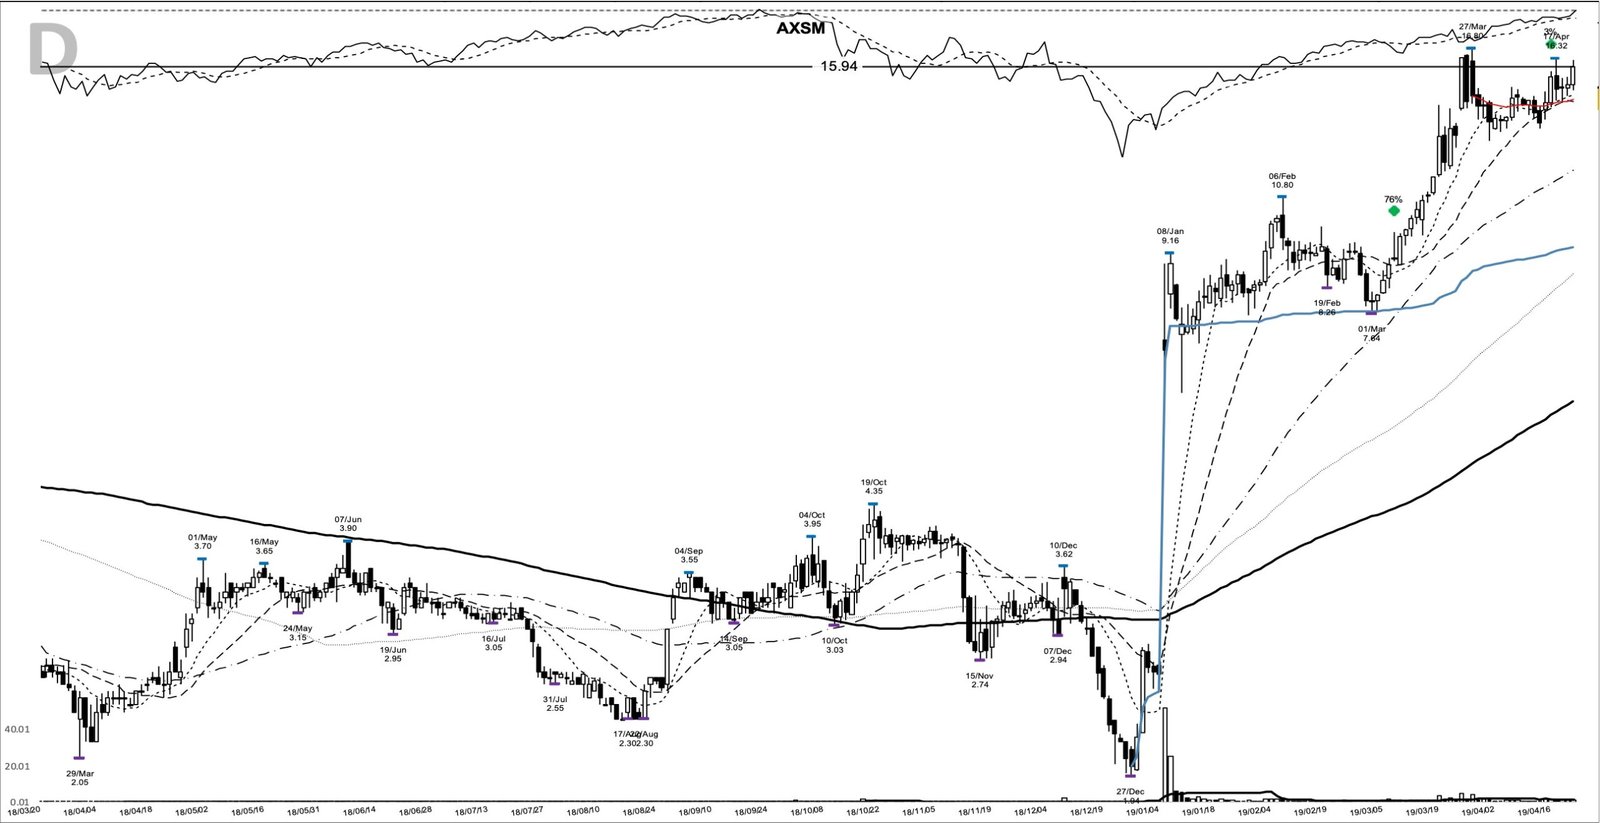
By mid-April the trend had already done real work. On 16 April the stock closed at 15.48, up roughly 71% from the entry and breaking cleanly to new highs. There was an opportunity to add right there, into the volume thrust the early entry could only wait for. A week later a 15.94 close on 23 April held the advance and gave the chart a second add point.
A biotech with no earnings to model
The model book usually wants accelerating earnings and revenue behind a leader. Axsome offered neither. It was a clinical-stage company with no product, no sales, and steady losses, so there’s no EPS line to point at here. Its value was a bet on trial outcomes, and through 2019 those outcomes kept landing.
The January gap came from the ASCEND Phase 2 trial, where the lead drug AXS-05 met its primary endpoint in major depressive disorder. On 27 March the FDA granted the drug Breakthrough Therapy designation for that indication, and in early May the company reported an expedited, pivotal development path. Each milestone lines up with a leg higher on the chart. An earnings screen like the CANSLIM system would have skipped this name outright; what it had instead was a catalyst calendar, and a chart that front-ran it.
For a trend follower, none of that biology mattered. The chart was making higher highs on rising volume, a stop defined the risk, and you couldn’t build a cash-flow case for a company with no cash flow anyway.
The tape that carried it in 2019
Backdrop matters, and 2019 was a helpful one. After the sharp selloff of late 2018, the broad market spent the year in a strong uptrend as the Federal Reserve turned to cutting rates. Speculative small-cap biotech with binary catalysts was being rewarded rather than shunned.
The March 2019 tape gave the entry a specific character. The recovery off the late-2018 low had been confirmed only weeks earlier, the indexes had reclaimed their recent highs while still working on older resistance, and the sensible posture was gradual buying as valid setups appeared. A biotech clearing the 10.80 pivot on volume was precisely the kind of setup that posture existed for.
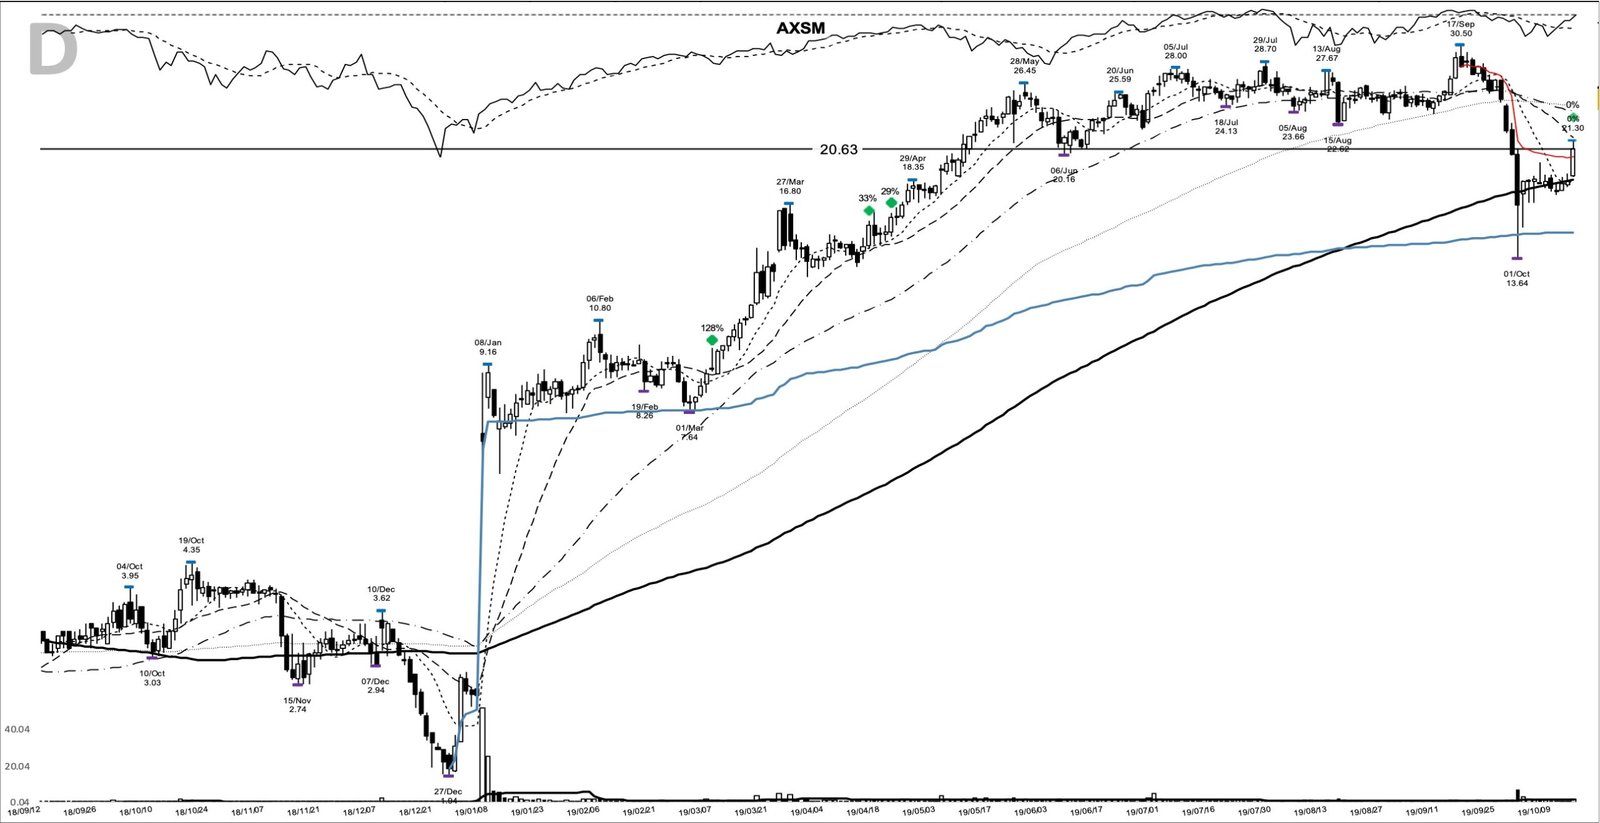
The move wasn’t a straight line, and October is the proof. On 1 October the stock plunged intraday to 13.64 before closing at 16.71 on nearly 6.9 million shares, a shakeout that would have knocked out anyone trailing a tight stop. It recovered within two weeks. The 20.63 close on 15 October reclaimed the trend and gave the chart another add point, up about 128% from the entry.
Spotting the AXSM setup before the 10.80 pivot
The trend posture into 7 March was readable in advance. Price had closed above its 10-day line near 8.64 for a second straight session, sitting about 4.6% above it, with the 20-day near 8.83 and the 50-day near 7.59 both curling up underneath. A short-term average stack that points up, off a shelf, above a rising 50-day, is the posture a watchlist trader wants before a base resolves.
The levels drew the plan. The base ran from the 1.94 low to the 10.80 ceiling, with a near-term 7.64 shelf beneath the current price. A trader could have written the trade off those anchors: an entry through the 10.80 pivot, an initial stop below the 7.64 shelf, and the 1.94 base low as the level where the structure fails. From there the exit was mechanical, trailing the 10-day moving average and widening to the 20-day once the move was well advanced. Settle the size first, so the entry-to-stop distance is a fixed, survivable risk; that’s the job of position sizing.
How the AXSM trend ran into January 2020
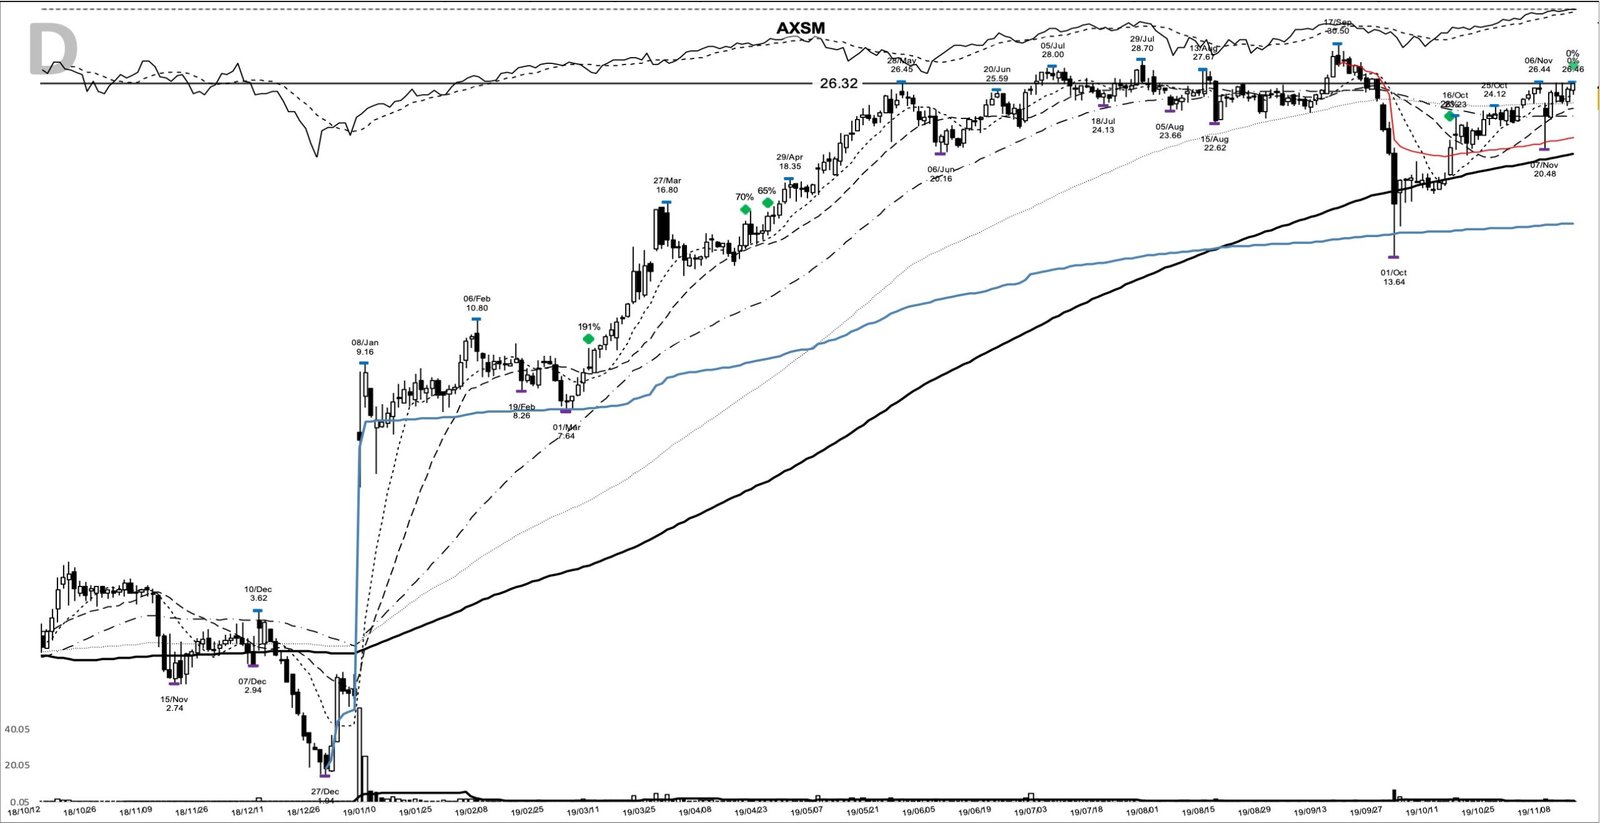
A trader using this pattern might have watched for higher highs holding above a rising 10-day line, and that’s what the record shows. From the 9.04 entry the stock stair-stepped up through spring and summer, offering a fourth add point at a 26.32 close on 14 November. Then came the largest catalyst of all.
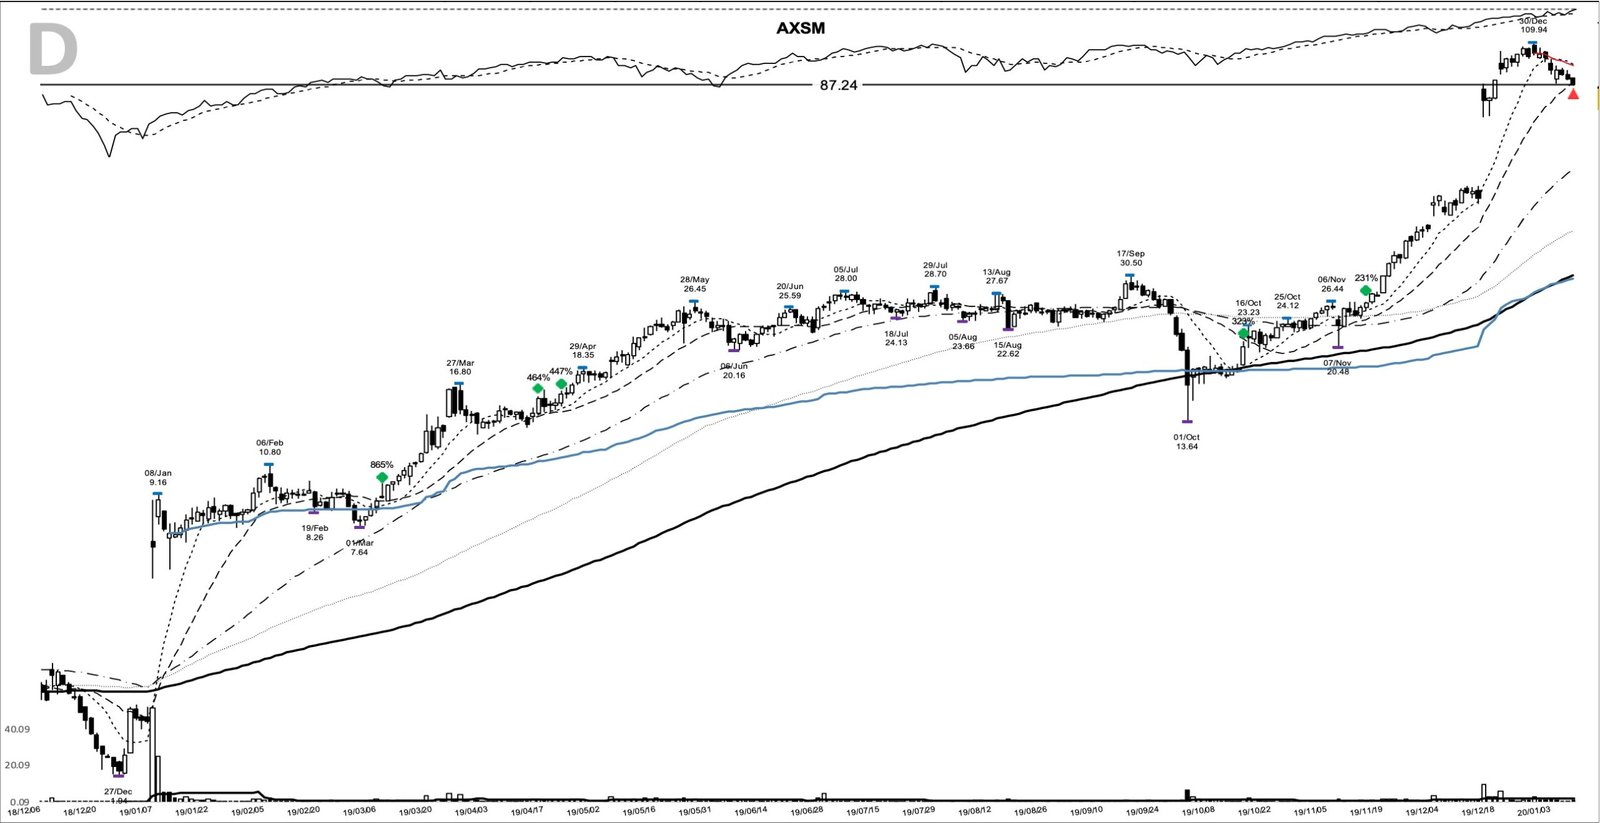
On 16 December 2019 the stock gapped from a 46.79 close to a 79.80 close on nearly 9.6 million shares, after the GEMINI Phase 3 trial of AXS-05 met its primary endpoint in major depressive disorder. That vertical leg carried the move to its 109.94 peak on 30 December, a paper gain north of 1,100%. The exit’s the honest part. By 9 January 2020 the trend had cracked and the close was 87.24, a realized +865% from the entry over 308 calendar days. The gap between the 109.94 peak and the 87.24 exit is why a trailing stop, not a price target, ends this kind of trade: you give back the top, and you keep the trend. Held across the full move, 1,000 riding it would have become about 9,650. That’s the Livermore lesson: sit through a big advance, and let the market call the finish.
The tape at the turn of the year framed that exit well. The market itself entered January as a confirmed bull, strong enough to shrug off an overnight geopolitical shock, and the practical counsel of that moment was to start the year light and respect risk into event-heavy stretches. Taking a cracked trend off the table days into January, rather than defending a paper peak, matched the environment.
Where this AXSM base breakout fools people
The first trap is the pivot itself. Buying the 9.04 reclaim looks obvious in hindsight, but the stock sat 16% under its 10.80 pivot that day, and an early entry inside a base is a riskier trade than a confirmed breakout above it. Insisting on the pivot cost a week and a few points; jumping in early meant more chop. Both are defensible; pretending the entry was a clean breakout isn’t.
The second trap is the trailing stop, and October showed why. A stop trailed too tightly under a fast-moving biotech would have been swept out on the 1 October plunge to 13.64, well before the biggest gains arrived. Widening the trail as a move matures is what lets you survive a shakeout like that.
The last trap is survivorship. This is one chart that worked, pulled from a library precisely because it ran. For every clinical-stage biotech that gaps on good data and trends for a year, many more gap the other way on a failed trial and never come back. A base breakout on a binary-catalyst stock fails hard when the data disappoints, so it’s worth remembering how survivorship bias flatters any single winning chart before you treat this one as a template.
Follow the chart, not the trial data
AXSM in 2019 is a clean reminder that trend following is a method for acting on price and risk when the fundamentals give you nothing to hold. A company with no revenue and no earnings produced a nine-fold move, and the only way to have caught it was to trade the base in front of you, add on confirmation, and let a trailing stop end the trade. Learn the pattern. Ride the trend. Keep the gains.
Related studies: see William O’Neil on base breakouts, why an earnings screen like the CANSLIM system would have skipped this pre-revenue name, and how survivorship bias shapes a single winner’s read. A new winner study lands most evenings.
Price and volume figures are computed from split-adjusted daily OHLCV data; company figures come from SEC filings where cited.
Educational content only. Not investment advice. Trading involves risk. You are responsible for your decisions.
Get the free Market Wisdom e-book
Join Trends and Breakouts — historical winners, breakout studies, and risk lessons. No spam, unsubscribe anytime.