First Solar’s back near the top of the trending lists this week. Second-quarter results are scheduled for 30 July 2026, and there’s a U.S. polysilicon trade ruling pending, both drawing coverage. The FSLR base breakout of March 2007 is a model-book example of a young leader leaving its first post-IPO base. The stock had been public for barely four months, capped near 30 through the winter, before it pressed back toward a 52.70 pivot on rising volume. From the 51.87 entry on 8 March 2007, price ran 356.6% in 305 calendar days, peaked at 283.00 near the end of December, and offered six add-on points on the way up.
Key takeaways from the FSLR base breakout
- The pattern was a post-IPO base breakout: the 52.70 pivot from 26 February cleared in the two sessions right after a 51.87 entry close on 8 March 2007.
- The move ran 356.6% from the entry to the 7 January 2008 exit at 236.84, held for 305 calendar days.
- Price topped at a 283.00 peak on 27 December 2007, a 445.6% maximum gain before the exit handed part of it back.
- The chart marked six add-on points, from a 66.70 close in May to a 266.40 close in December, each into fresh strength.
- The entry tick mattered less than staying with the trend and adding as the leader made new highs.
The FSLR trade at a glance
| Item | Value |
|---|---|
| Ticker | FSLR |
| Study entry date (anticipatory) | 8 March 2007 |
| Entry close | 51.87 |
| Pivot | 52.70 |
| Pivot cleared | 12 March 2007 at a close of 57.91 |
| Volume vs 20-day average | 1.5x |
| Exit date | 7 January 2008 |
| Exit close | 236.84 |
| Gain | 356.6% |
| Calendar days held | 305 |
| Peak before exit | 283.00 (27 December 2007) |
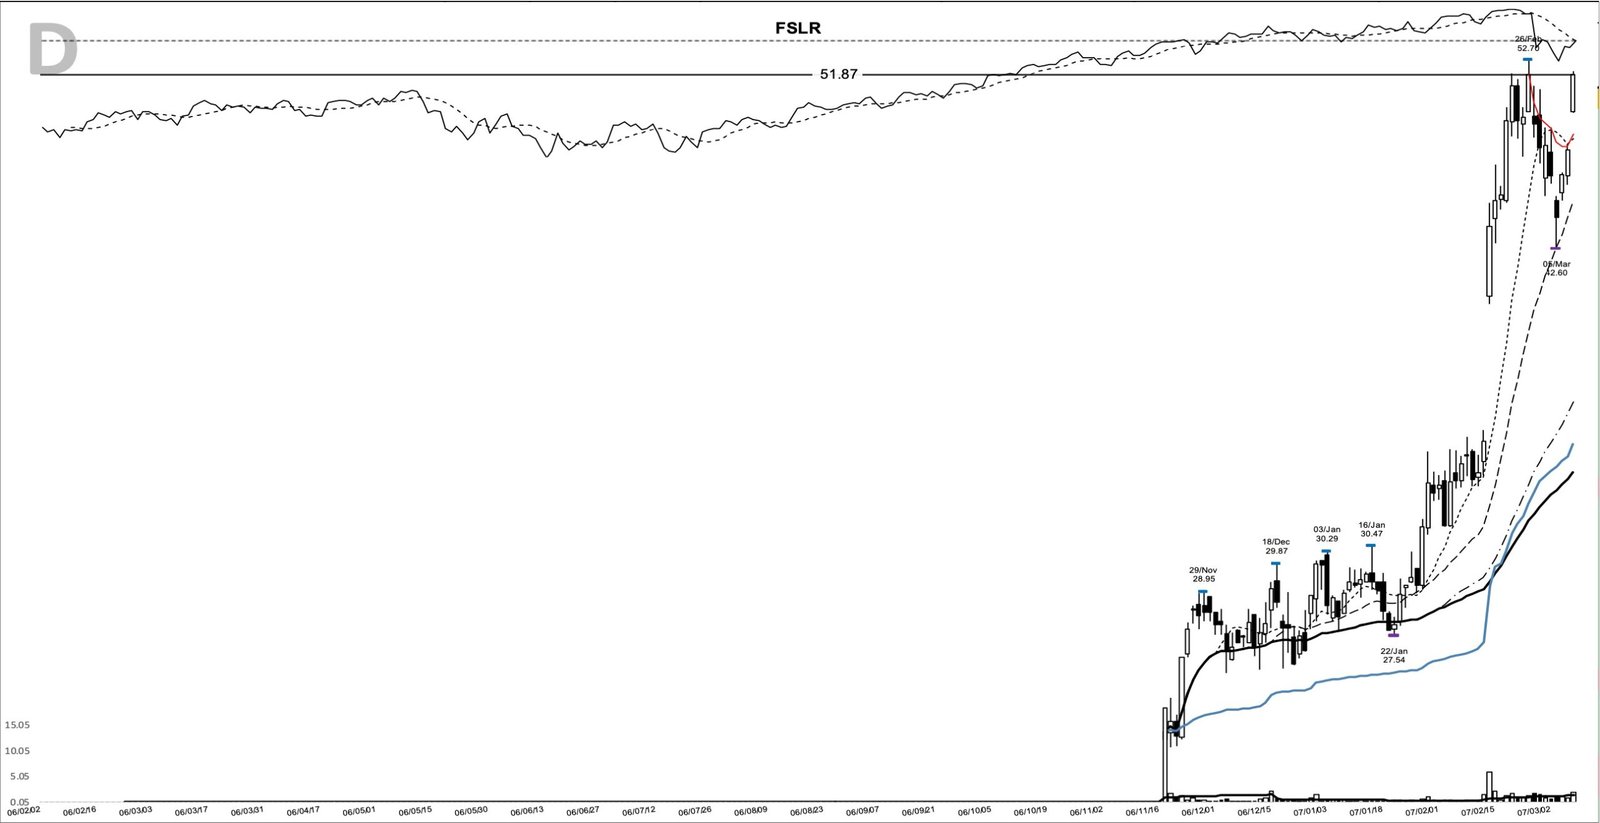
The chart below comes from my study archive, marked up at the entry.
How FSLR’s first base formed under the 52.70 pivot
First Solar came public in mid-November 2006 and spent its opening months building structure. The stock coiled beneath roughly 30 through December and January, printing swing highs near 28.95, 29.87 and 30.47 while holding a 27.54 low on 22 January. That’s a young base doing its job, on steady, unhurried volume.
The character changed in mid-February. A strong advance carried price to a 52.70 high on 26 February, and that’s the pivot for the setup. A brief two-week shelf followed, dipping to a 42.60 low on 5 March. Then the 8 March session closed at 51.87 on about 1.9 million shares, roughly 1.5 times the 20-day average, snapping price back to the top of the range.
This study classifies the 8 March entry as anticipatory: the marked buy preceded the pivot clearance, which did not arrive until the 57.91 close on 12 March 2007. Read the sequence carefully, because the entry sat just under the pivot rather than through it. The 51.87 close was about 1.6% below the 52.70 high, an anticipatory push into resistance on expanding volume. The pivot gave way over the next two sessions: 9 March traded to a 54.10 high, and the 12 March close of 57.91 put the breakout beyond doubt. The reclaim could’ve failed at the pivot, and that’s the honest cost of buying strength before confirmation. Reading the volume tilts the odds here: the range came back on a clear pickup in turnover, the footprint of demand rather than drift.
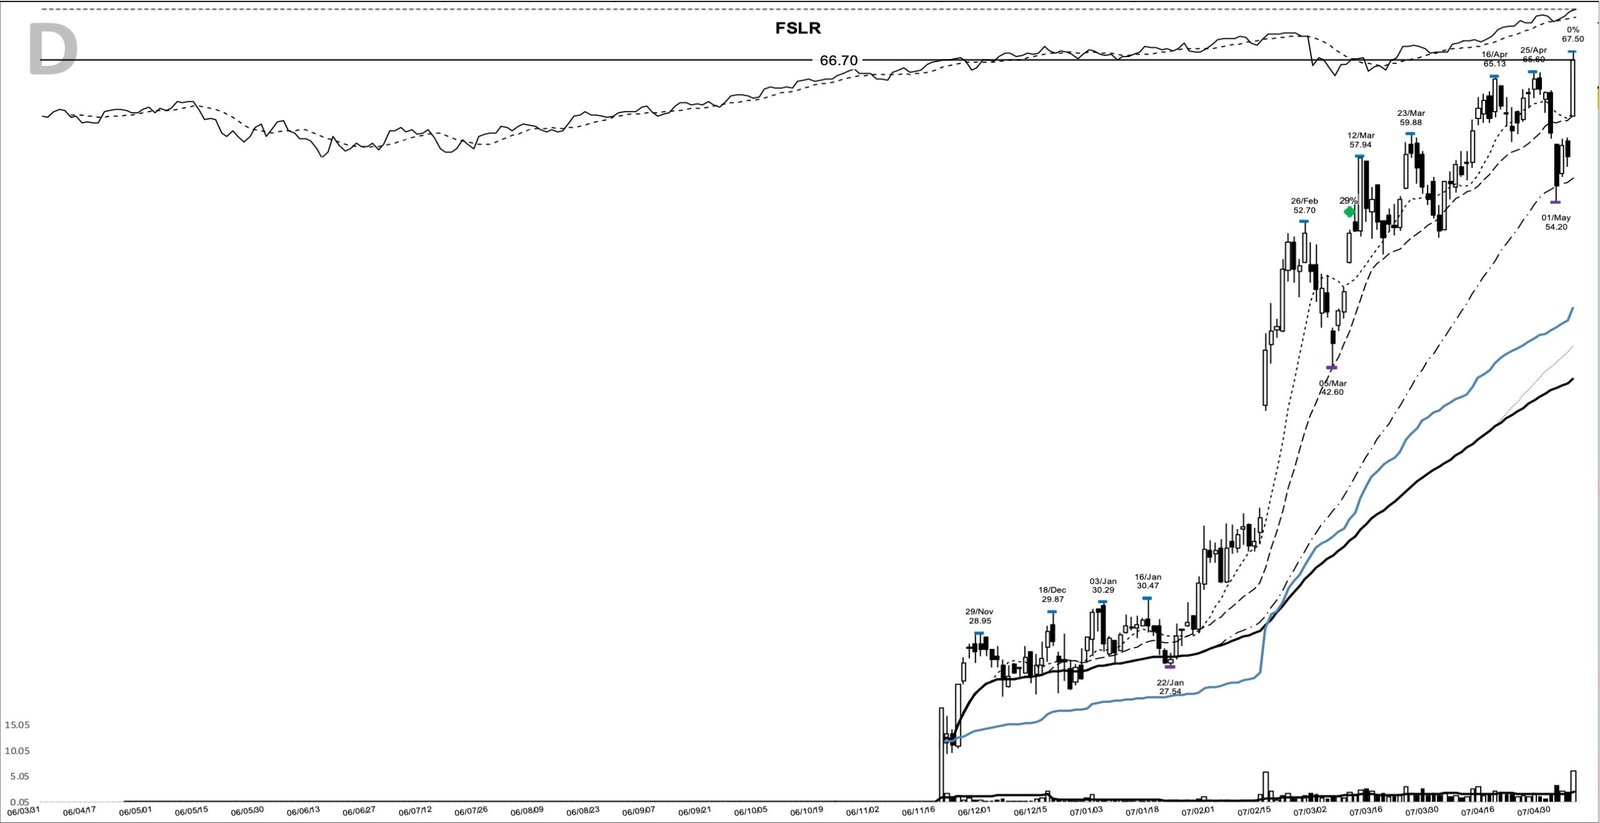
What First Solar was in early 2007
First Solar makes thin-film solar modules built on cadmium telluride, and here’s its edge in this era: cost. It built panels cheaper per watt than the crystalline-silicon field. The company priced its IPO at 20 dollars a share on 17 November 2006, and the stock closed its first session near 24.74. At this breakout it had been listed for under four months, and that’s exactly the window in which a new leader often builds its first base.
The chart had a live catalyst behind it. First Solar reported its first quarterly results as a public company on 13 February 2007, and the reaction was immediate: the stock gapped from a 34.28 close to a 43.72 close the next day on about 5.9 million shares, far above its quiet post-IPO pace. That’s the fuel behind the February advance to the 52.70 pivot. The demand story underneath it was Europe: Germany’s feed-in tariff had turned solar into one of the fastest-growing industrial markets on the planet, and a low-cost module maker was a direct way to own that growth.
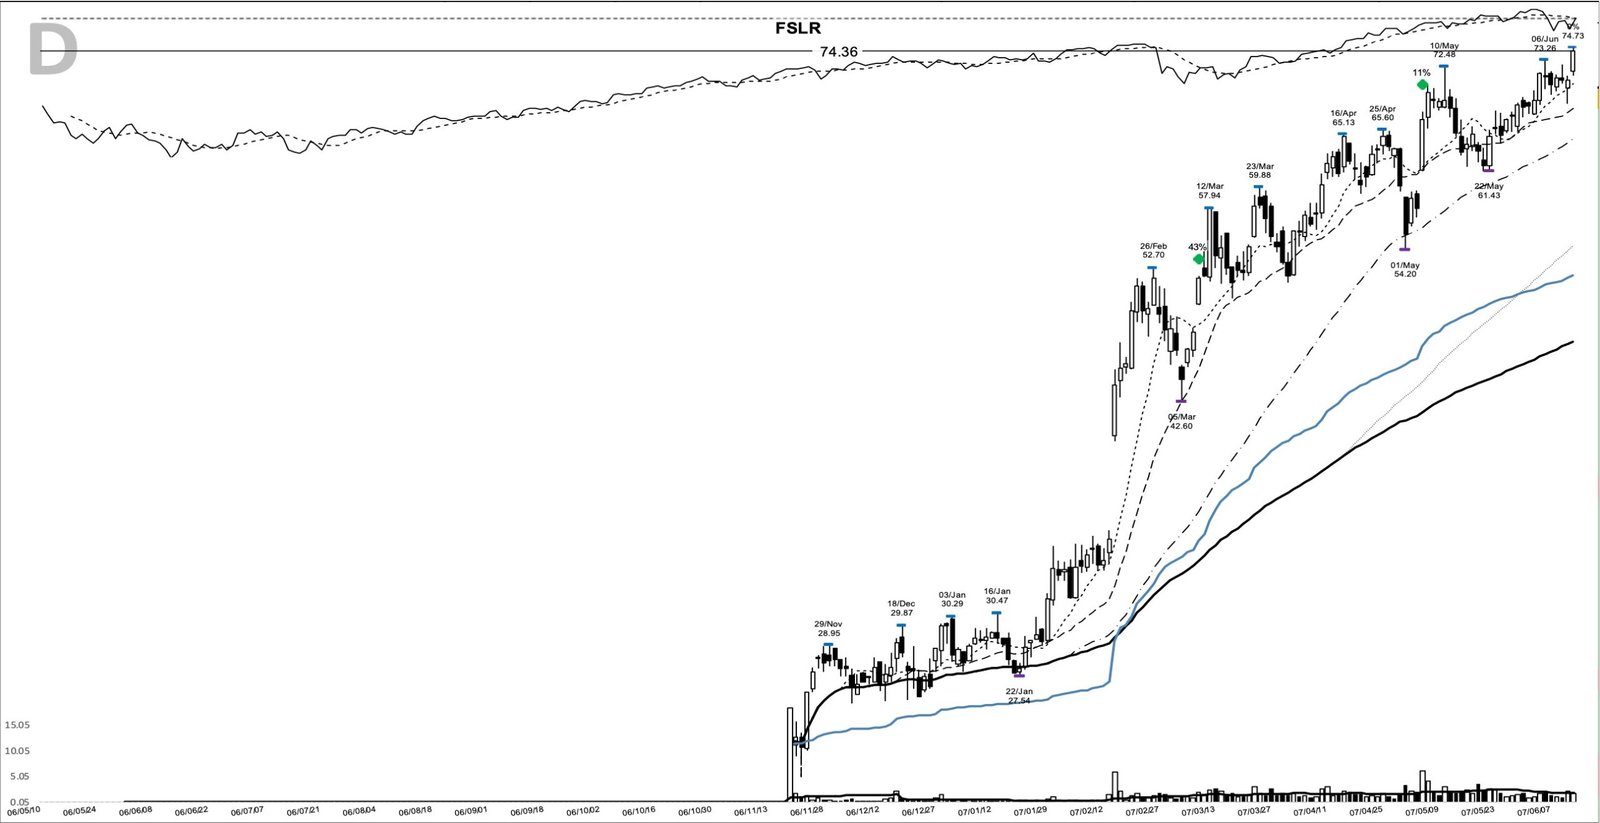
The 2007 tape behind the move
Context helped. The broad market was still rising through the first half of 2007, and solar was one of its loudest themes, so a breakout in a leading name had the wind at its back. The tape didn’t stay calm: an August 2007 credit scare dragged the whole market lower, and First Solar was caught in it. Markets then pushed to new highs into October before the 2008 bear began to form, and the FSLR exit in early January 2008 landed as that broader top rolled over. This run happened inside a market that rewarded strength until it stopped.
Building the watchlist case for FSLR before the breakout
The structural read at the entry was clean. Price had just reclaimed its 10-day line and sat about 7.6% above it, with the 10-, 20- and 50-day averages stacked in order and rising. The 50-day, near 35.85, was climbing hard beneath price, and that’s the signature of a trend already in motion. The pivot was the 52.70 high from 26 February; the line that would say the setup had failed was the 42.60 shelf low from 5 March.
What would’ve put this stock on a watchlist ahead of time is worth naming: a recent IPO in a hot industry, an earnings gap that showed real demand, a pullback that held above rising moving averages, and a pivot sitting just overhead. That’s the model-book profile of a leader coiling for a move.
From there the plan writes itself, and it’s educational rather than a recommendation. A trader using this pattern might have set the trigger on a push through the 52.70 pivot, with initial risk placed below the 42.60 shelf, the level that would’ve invalidated the base. After that the management is mechanical: trail the rising 10-day line while the move is young, then give it room by shifting to the 20-day once the stock is well advanced. The entry’s a decision; the trail’s a discipline. That framing rests on the pivot and the shelf, plain support and resistance.
How the FSLR trade played out
The trend did what trends in real leaders do: it ran further and longer than felt reasonable. Price cleared the pivot within days and didn’t look back at the base. A 66.70 close on 4 May came on roughly 6.1 million shares, the first heavy add-on point; a 74.36 close on 13 June marked the next as the stock made new highs through the summer.
Then came the test. Into late July the stock spiked to a 123.21 intraday high, and the August credit scare knocked it back to a 74.77 low on 16 August. The 14 August sell marker sits at a 91.55 close, inside that drop, about 39% off the high, just before the stock more than tripled again.
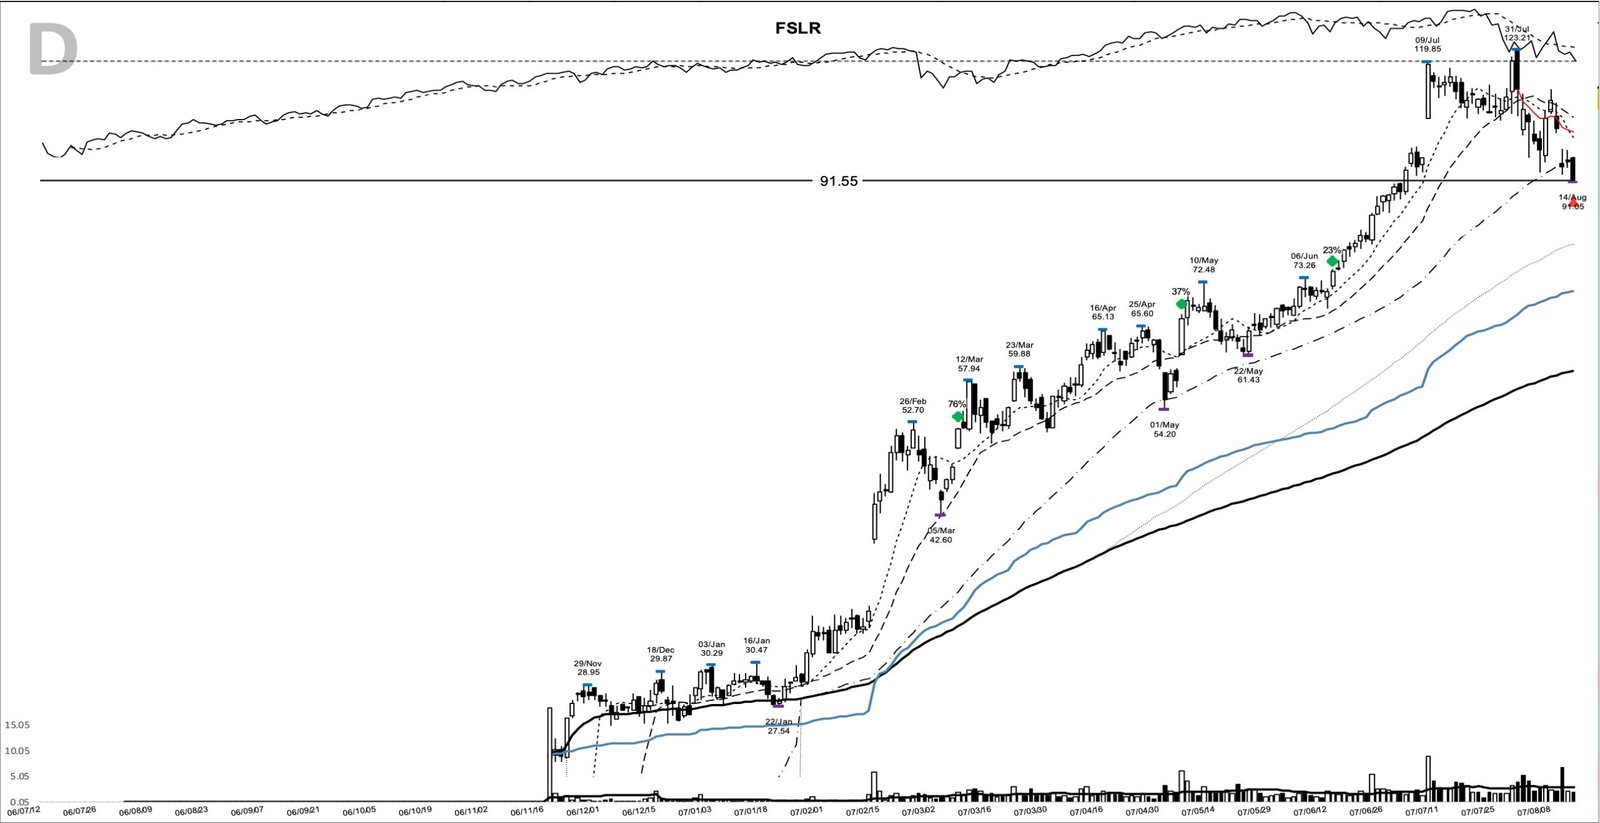
The stock repaired the damage and broke out again. A 112.55 close on 21 September, on about 4.1 million shares, marked the re-breakout to new highs and the add-on point in the middle of the hold. From there the trend accelerated: a 126.96 close on 1 October, a 150.16 close on 23 October, and a run through November into a parabolic December.
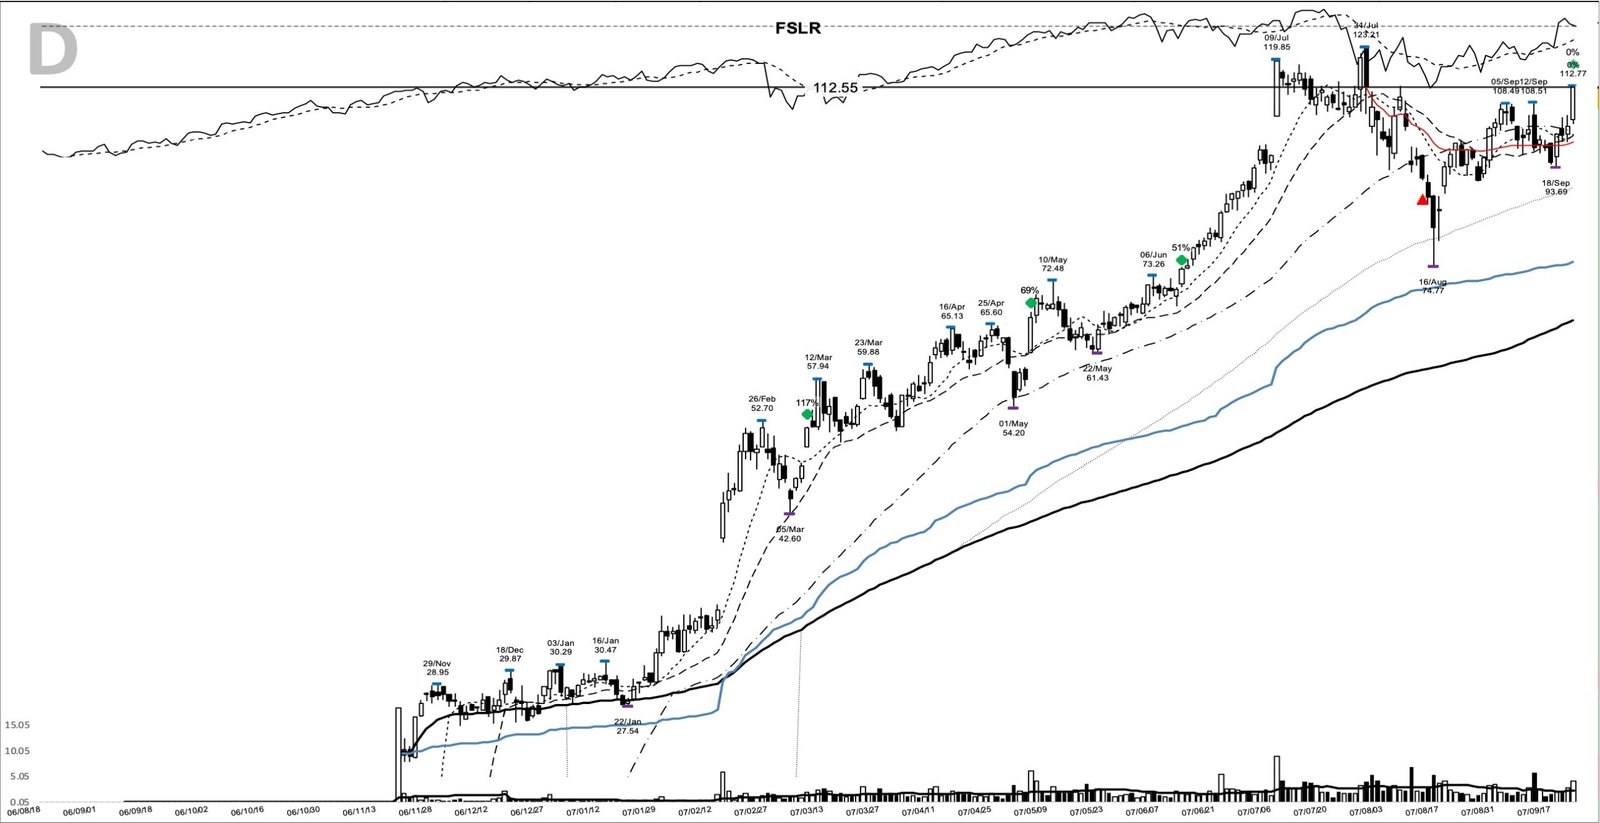
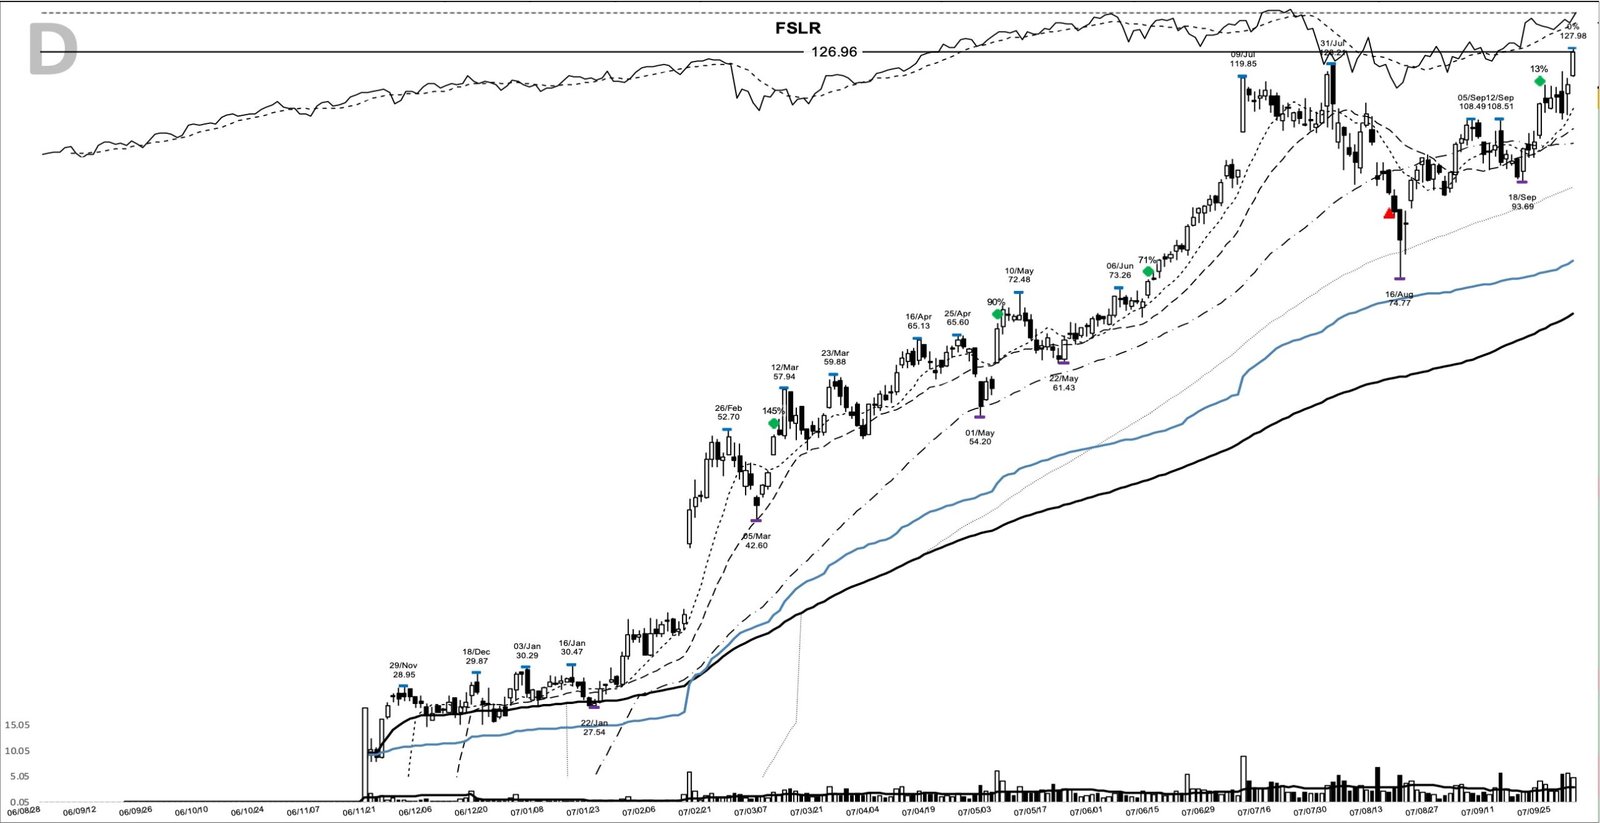
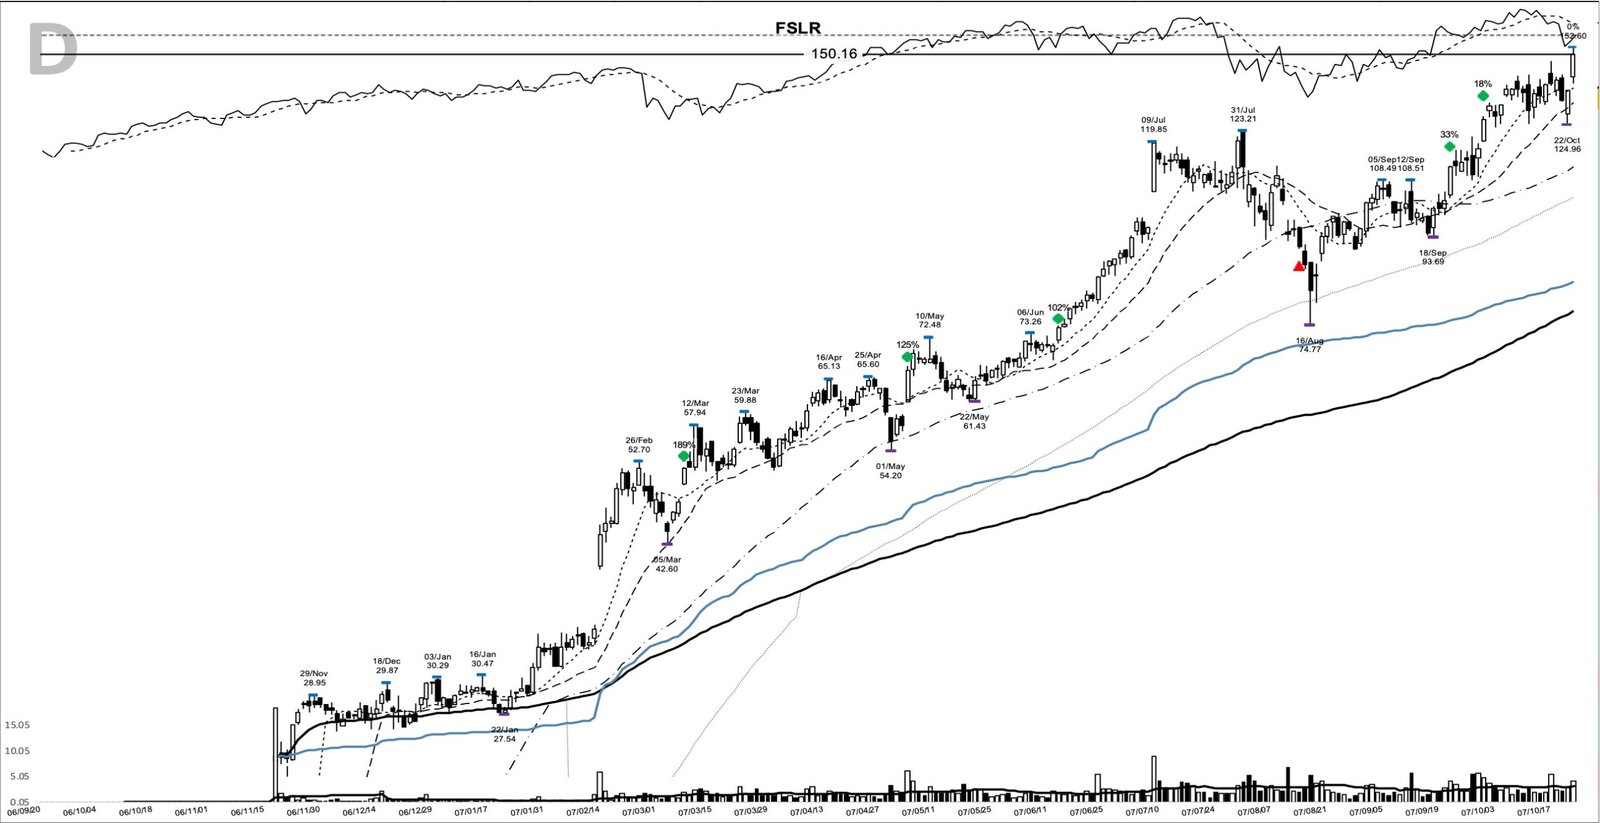
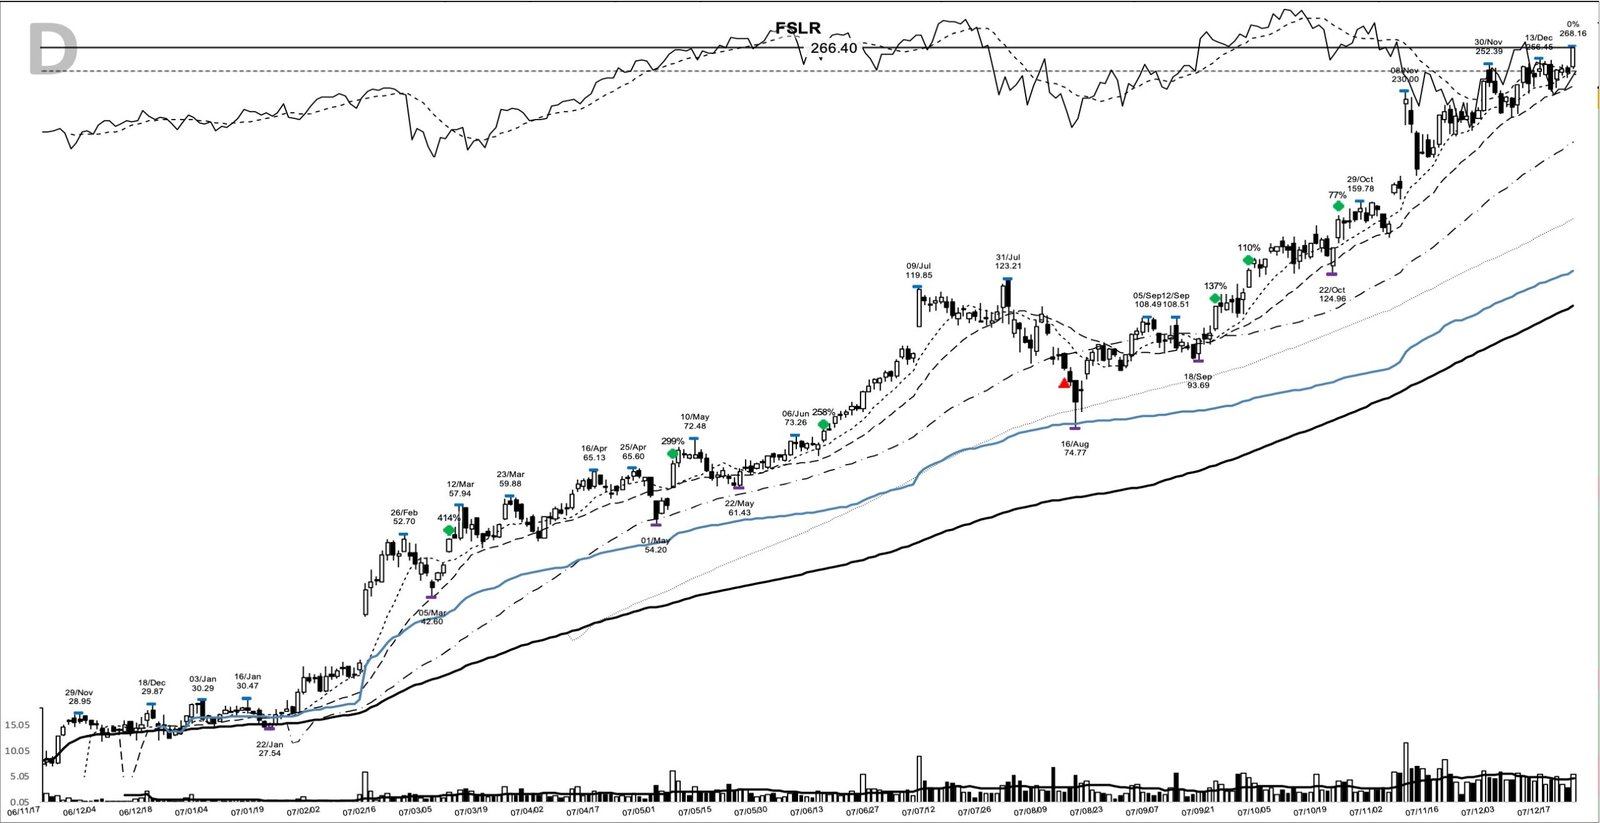
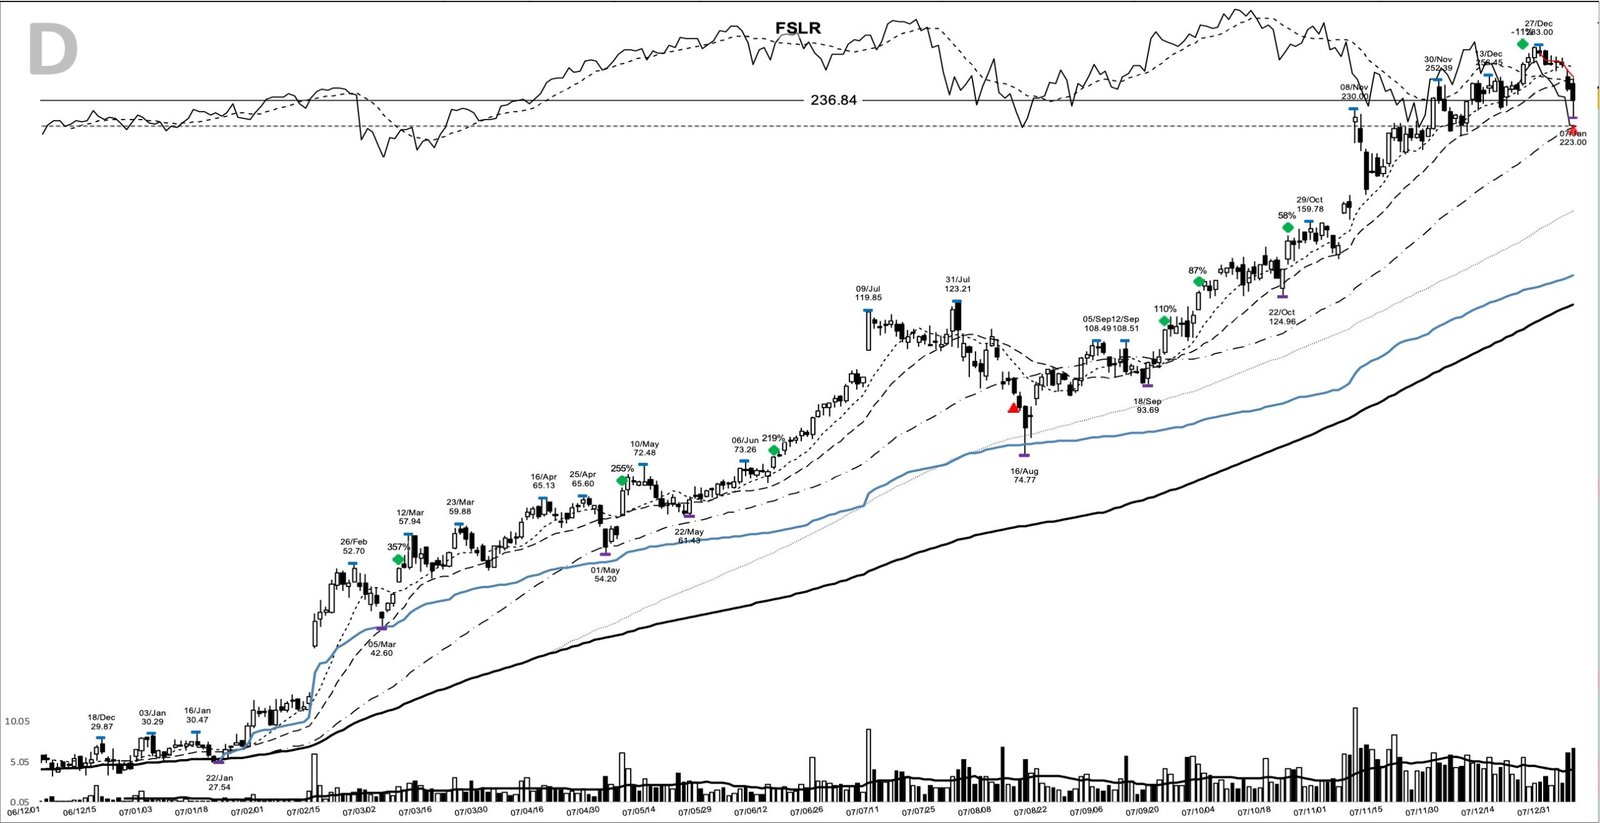
The final add-on point on the chart is a 266.40 close on 21 December. Price peaked at 283.00 on 27 December, a 445.6% maximum gain from the entry. The top rolled over into the new year, and the 7 January 2008 exit closed the move at 236.84, up 356.6% from the entry over 305 calendar days. In round terms, 1,000 dollars carried from the entry to the exit would’ve become about 4,566 dollars.
What the FSLR base breakout did not promise
Three honest negatives sit inside this winner. The first is the entry itself. Buying the 51.87 reclaim meant buying under the 52.70 pivot, and the pivot could’ve rejected price. The confirmed breakout only arrived with the 57.91 close on 12 March, and a trader who waited for it paid up for cleaner evidence. The pattern didn’t guarantee the reclaim would hold.
The second is the August drawdown. A stock that runs to a 123.21 high and then falls to a 74.77 low in about two weeks isn’t an easy hold, and that 39% shakeout came right before the biggest part of the advance. Trend following pays because most people can’t sit through exactly that stretch.
The third is adding late. The 266.40 add on 21 December was the one that didn’t work: by the 7 January exit at 236.84 it was down about 11%. Adding to a position that’s already up more than 400% from the entry is where reward-to-risk turns thin.
What the FSLR chart still teaches
Here’s the durable lesson: it’s in the shape of the gain more than its size. A high-quality leader broke out of its first base with an earnings catalyst and a sector tailwind, then trended for the better part of a year, offering repeated points to press strength. The entry was one decision on one day; the return came from staying with the trend and letting the moving averages decide when the ride was over. Learn the pattern. Ride the trend. Keep the gains.
Related studies: Weinstein stage analysis for reading a stock in a Stage 2 advance, volume confirmation on breakout candles for judging the entry bar, and Gil Morales and Chris Kacher on adding to leaders. A new winner study lands most evenings.
Price and volume figures are computed from split-adjusted daily OHLCV data; company figures come from SEC filings where cited.
Educational content only. Not investment advice. Trading involves risk. You are responsible for your decisions.
Get the free Market Wisdom e-book
Join Trends and Breakouts — historical winners, breakout studies, and risk lessons. No spam, unsubscribe anytime.