
A growth stock spends 21 weeks building a base between 41.10 and 46.20. On the daily chart it looks orderly: the pullbacks are shallow, the last few weeks are tight, and the 46.20 high gives you a clean pivot. Then you zoom out to the weekly chart and there’s a 20-week trading range sitting between 52.00 and 62.00, which ended 60 weeks earlier, before the stock fell 52.03% to 29.74. That older congestion is what traders call overhead supply. This guide explains what the term describes, why it changes the context of the base underneath it, and why the chart can only ever suggest it.
Overhead supply is an inference about people
The usual explanation goes like this. Shares that changed hands at 52.00 to 62.00 left a group of holders sitting on losses once the price collapsed. Some of them may want out at breakeven, so when a recovery climbs back toward their purchase prices, their offers can slow the advance or turn it.
That’s a behavioral story, and it may well be true for a given stock. What a historical chart shows is narrower: prices and volumes that printed in the past. It can’t list who still holds those shares, what each holder paid, or what any of them intends to do. Nobody can see an inventory of resting sell orders between 52.00 and 62.00 by looking at old bars. A useful habit is to keep the two layers apart in your own notes: “heavy trading occurred in this zone” is an observation, while “holders will offer shares here” is a hypothesis about the observation.
The idea sits close to general support and resistance, with one difference in emphasis. Resistance describes a price level where advances have stalled. Overhead supply asks about the ownership history behind that level, and specifically about trading that took place above a base that’s still forming.
Reading the weekly chart of the hypothetical Example A
Example A is a hypothetical weekly series built for this guide. It moves through four stages:
- Weeks 1 to 20: an advance from 21.00 to a 58.00 close.
- Weeks 21 to 40: a prolonged range with a 62.00 high and a 52.00 low, on 8.5 million shares a week.
- Weeks 41 to 60: a decline to a 29.74 low, a drop of 52.03% from the top of the range.
- Weeks 61 to 100: a recovery and then the base, with a 46.20 high in week 81 and a 41.10 low, on 4.0 million shares a week.
The weekly closes below show the whole path, with the old congestion marked above the newer base.
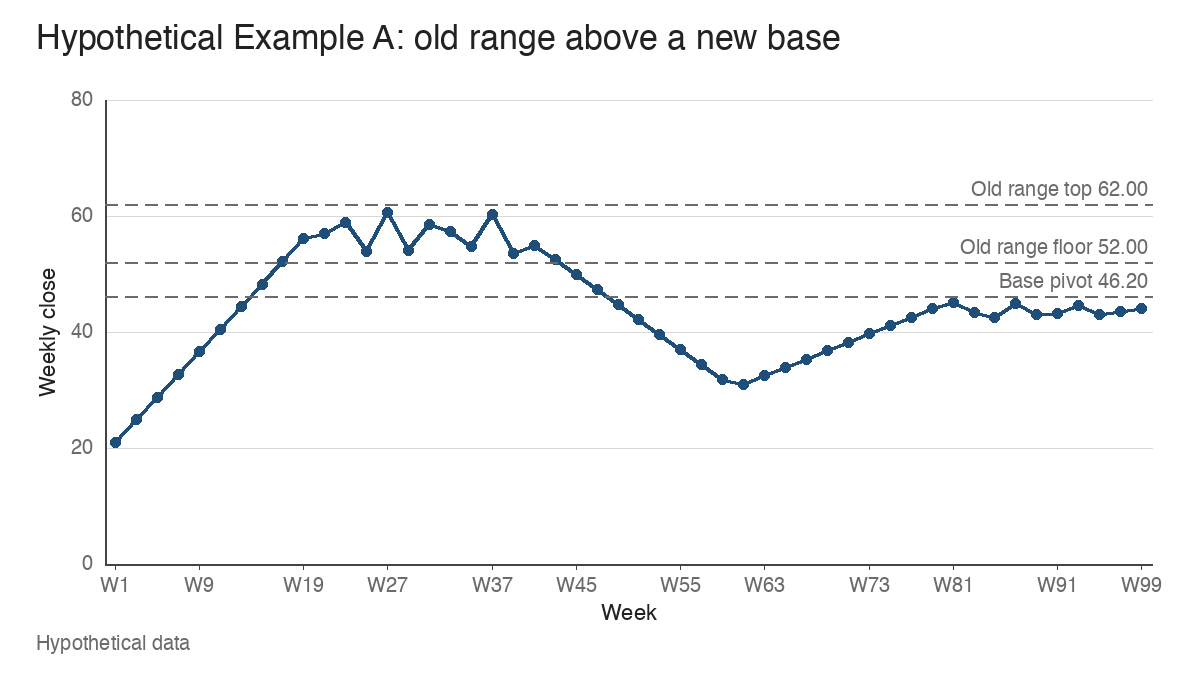
Taken by itself, the base has plenty going for it. It’s 11.04% deep from its high to its low, the stock has climbed 55.35% off the decline low to reach the pivot, and the weekly closes tighten as week 100 approaches. A trader reading only the recent daily chart wouldn’t be wrong to call it constructive.
The weekly chart adds two distances. The bottom of the old range sits 12.55% above the 46.20 pivot, and the top sits 34.20% above it. The volume gap is just as relevant: the range traded 2.125 times the weekly volume of the base. In plain terms, the stock is trying to rise into the zone where it once did the most business, on less than half the activity.
A common misread is to treat the 12.55% figure as a ceiling or a target. The number measures the distance to the nearest price where the chart shows heavy earlier trading, and that’s all it measures.
A base at an all-time high has no displayed trading above it
Compare Example A with a second hypothetical stock, Example C, whose base is otherwise similar in depth and length but has its pivot at 88.40, the highest price anywhere on its displayed adjusted series. There’s no earlier congestion above that pivot to account for. Every share that traded on the chart traded at or below 88.40, so the specific breakeven story behind overhead supply has nothing to attach to.
That’s why many base-reading traders, following the work of William O’Neil, paid particular attention to bases forming near new highs. At the pivot, nobody who bought anywhere on the displayed chart is under water. That removes one source of friction and leaves the others in place. Example C can still stall for reasons that have nothing to do with old holders: weak earnings, a soft market, or a shift in what investors expect from the business.
A 52-week high can still sit below older congestion
Here’s where scanners mislead. At week 100, the 52-week lookback in Example A runs from week 49 onward. The range ended in week 40 and the decline passed through it during weeks 41 to 44, so none of that trading falls inside the window. The highest high in the lookback is the base’s own 46.20.
If the stock clears 46.20, a screen will flag it as a new 52-week high. That label’s accurate, and it says nothing about the 52.00 to 62.00 zone, which is simply older than the window. A 52-week high and an all-time high are different readings, and only the second one tells you there’s no higher trading on the displayed series. Before treating a 52-week high as a clean breakout, a trader could check how far back the chart has to go before it finds the next congestion above the price.
Turnover and changing expectations weaken the simple story
The breakeven story quietly assumes the old holders are still there. The arithmetic of Example A argues against assuming it. With 120 million shares outstanding, the 170 million shares traded in the range equal 1.42 times the share count. From week 41 through week 100 another 290 million shares changed hands, 2.42 times the share count.
Active traders recycle the same shares many times, so turnover of that size leaves open how many original holders actually sold. What it rules out is any confident estimate of how much of the range’s ownership survived the decline. Some range buyers may have sold on the way down to 29.74. Others may have bought near the low and would hold a gain at 46.20, which gives them a very different reason to stay or leave.
Business expectations matter too. If the company’s outlook has improved since the range formed, a former holder may now value the shares above 62.00 and see no reason to exit at breakeven. If the outlook has worsened, the same holder may be glad to leave well before 52.00. Old volume records old activity, and reading volume in the present still has to come from present bars.
Two hypothetical recoveries from the same base
To show how the evidence develops, here are two invented 16-week paths that both start from the 46.20 pivot. Neither one is a forecast, and they’re here to illustrate what a trader would actually see at each stage.
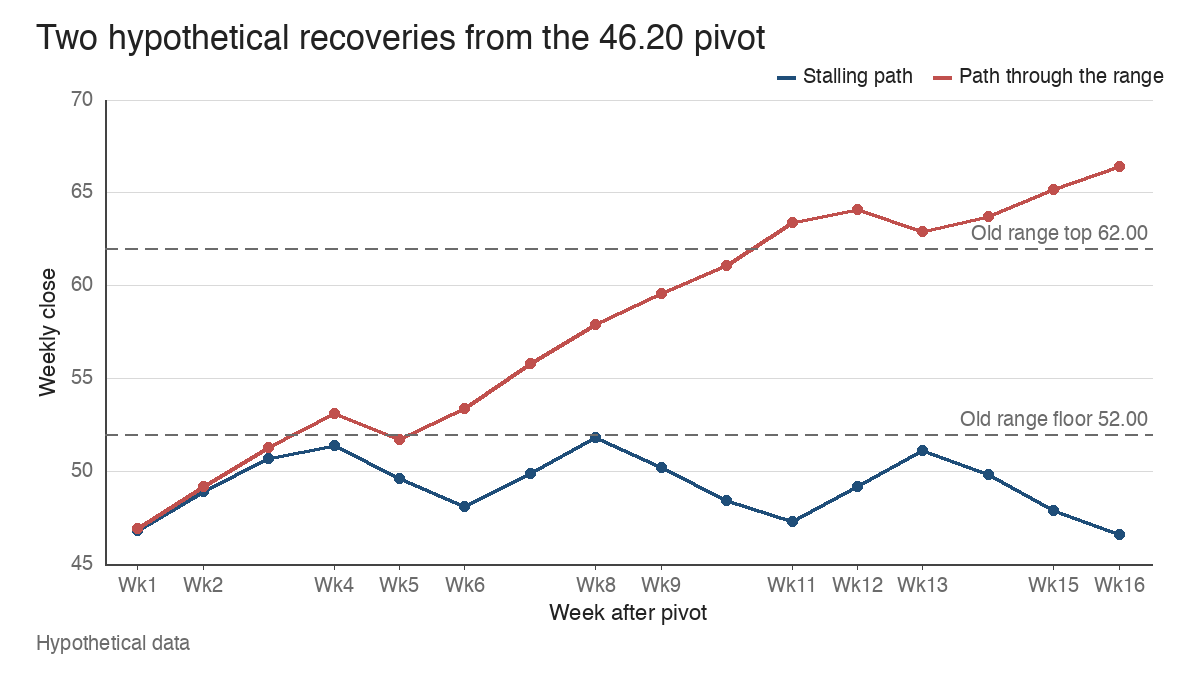
In the stalling path, the stock rallies to a 52.40 weekly high in week 4 and slips back. It returns to the zone in weeks 8 and 9 with highs of 51.90 and 51.70, then again in week 13 with a 51.80 high. The stock doesn’t manage a single weekly close above 52.00, and by week 16 the close is 46.60, just 0.87% above the pivot. Three approaches to the same floor, three turns lower.
In the second path, the stock closes at 53.10 in week 4, 2.12% inside the bottom of the range, and then dips to a 50.80 low in week 5. At that moment the two paths look much alike, and a trader wouldn’t be able to tell which one is unfolding. The second path then closes inside the 52.00 to 62.00 band in weeks 6 through 10, gets its first close above 62.00 in week 11 at 63.40, and from week 12 onward its lowest low is 62.30. By week 16 the close is 66.40.
The trap is in how these stories get told afterwards. The stalling path invites “the supply was too heavy,” and the second invites “the supply got absorbed.” Both are explanations fitted after the fact. A rally can stall at 52.00 because of an earnings miss or a weak market, and a stock can cut through a range because the business changed.
Describing the evidence without calling the outcome early
A more honest approach is to describe each stage in terms of what has printed, leaving out what it’s supposed to mean. Using the second path:
- At the pivot: “Base high 46.20. Prior heavy trading begins 12.55% higher at 52.00.”
- Week 4: “First weekly close inside the old range, at 53.10.”
- Week 5: “Low of 50.80, back under the range floor. The zone is still unresolved.”
- Week 11: “First close above the range top, at 63.40.”
- Weeks 12 to 16: “Pullback lows at 62.30 or higher, above the old 62.00 top.”
None of those lines calls the breakout a success. Even the week 16 reading describes five weekly lows above the old range top, and a failed breakout can still develop after that. The descriptions also leave room to bring in other evidence. The relative strength line shows whether the stock is outperforming the market while it works through the zone, and weekly volume shows whether the effort is growing or fading. Pattern geometry matters as well, since a cup-with-handle and a flat base set different pivots under the same old range. All of these are separate readings, and they can disagree.
Where overhead supply analysis runs out
Old volume doesn’t reveal current ownership, and it can’t. The 8.5 million shares a week in Example A’s range record transactions, and every transaction had a buyer and a seller. Who’s left holding, and at what price, is outside what the chart can show.
Corporate actions have to be adjusted consistently. Suppose the stock had split 2-for-1 after the range formed. On an unadjusted chart the range would print at 104.00 to 124.00, far above the base, and on an adjusted chart at 52.00 to 62.00. Mixing the two, for example by reading an old high off an unadjusted source while charting the base on an adjusted one, produces congestion that never existed at the stated prices.
And apparent overhead supply can do either job. It can hold a recovery under 52.00 for months, or it can be gone within weeks, as in the second path. There’s no universal distance at which old trading stops mattering and no fixed quantity that has to be worked off first. The value of marking the zone is that it tells you where to look harder, and which question to ask when the stock gets there.
Learn the pattern. Ride the trend. Keep the gains.
Educational content only. Not investment advice. Trading involves risk. You are responsible for your decisions.
Get the free Market Wisdom e-book
Join Trends and Breakouts — historical winners, breakout studies, and risk lessons. No spam, unsubscribe anytime.