
An index climbs 8.54% over fourteen sessions of a recovery. The 21-day exponential moving average has just crossed above the 50-day simple moving average, the last eight daily lows sit above the shorter line, and the tape feels like the start of something durable. Eight sessions later the low slips under the 21-day, and eight sessions after that it closes at 4,084.37, less than 1% above where it started. Under the power trend convention, that rally never qualified, and the reason is visible on the chart while it is happening. This guide walks through the exact rules, what each input contributes, and a hypothetical index that fails once, qualifies, rides out a pullback and then switches off.
The power trend rules, stated exactly
The power trend is a market-classification rule developed within Investor’s Business Daily’s MarketSchool work on the early stages of large uptrends. It describes an index that has advanced with enough persistence to be treated as an unusually strong backdrop. It switches on the first session on which all four of these hold:
- The index’s daily low has been above its 21-day exponential moving average for at least 10 consecutive sessions.
- The 21-day EMA has been above the 50-day simple moving average for at least 5 consecutive sessions.
- The 50-day moving average is in an uptrend.
- The index closes up for the day.
It switches off when the 21-day EMA crosses back below the 50-day moving average.
Three conventions need pinning down before any counting starts, and this article holds them fixed throughout. Session counts include the current session, so “10 consecutive sessions” means today plus the nine before it. “Above” uses the daily low against the 21-day value for the same session, so an intraday dip under the line breaks the count even when the close recovers. And “uptrend” for the 50-day means its value today is higher than yesterday’s. Some practitioners judge the slope over a longer stretch. Whichever reading you choose, you’ll need to apply it the same way every time, or the activation date moves around with your mood.
The up-close requirement is the least intuitive condition. It reflects a habit in the method’s lineage of adding exposure on strength, never into a falling session, so the label can only switch on during a day the index finished higher.
What each input contributes, and where they overlap
Each condition describes a different feature of the same advance.
The low holding above the 21-day exponential moving average for 10 sessions describes persistence. Pullbacks during that stretch have been shallow enough that sellers never pushed price under a fast-moving average, even intraday. Two weeks is long enough that it can’t be a three-day squeeze.
The 21-day sitting above the 50-day describes intermediate structure. The shorter average weights recent sessions more heavily, so it rising through the longer one says that the last month has been stronger than the last ten weeks.
The rising 50-day supplies context. An index can bounce hard while its 50-day is still falling, which means the ten-week picture still contains the decline. Requiring an upward slope makes the rule wait until enough of the old damage has rolled out of the window.
All four inputs come from the same price series. The 21-day EMA and the 50-day SMA are both smoothed views of the index’s own closes, the low is part of the same daily bar, and an up close is the bar itself. When the conditions line up, you’ve learned that one series has behaved consistently across several time scales. You haven’t received four independent confirmations. Volume, breadth, leading-stock behaviour and your own trade results are separate evidence; the power trend inputs are one piece of evidence viewed through four lenses.
A recovery that never qualifies
The hypothetical index in this guide starts at a close of 4,058.07 on day 1, with the 21-day EMA at 4,097.02 and the 50-day at 4,249.35. The 50-day is falling, having been 4,259.49 the session before. None of the conditions is satisfied yet. The chart below tracks the close and both averages across all 160 sessions of the example.
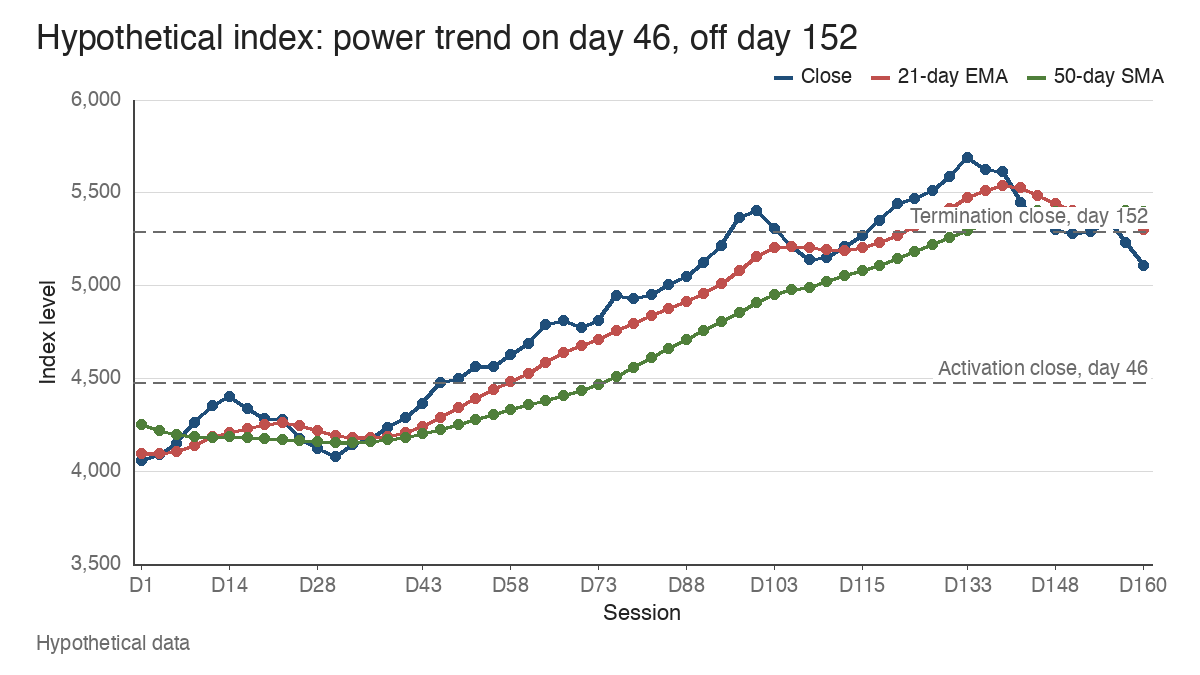
The bounce is quick. Day 7 is the first session with the low, 4,107.35, above the 21-day at 4,106.34. On day 13 the 21-day EMA, at 4,186.03, edges above the 50-day at 4,184.17. On day 14 the index closes at 4,404.72, up 8.54% from day 1, and the 50-day ticks up for one session, from 4,184.17 to 4,184.88. On that day the low count stands at 8 and the alignment count at 2, so the slope arrives too early to coincide with the other two.
By day 17 the other two conditions are met. The low has held above the 21-day for 11 sessions and the 21-day has been above the 50-day for 5. The 50-day, though, has turned down again, from 4,183.53 to 4,181.96. Days 18 through 21 look the same: two conditions satisfied, the slope missing. On day 21 the low count reaches 15 sessions and the 50-day is still drifting lower, at 4,174.06.
Day 22 ends the attempt. The low, 4,257.20, undercuts the 21-day at 4,261.61, and the count resets to zero. Eight sessions later, on day 30, the index closes at 4,084.37.
The value of this stretch lies in what could be known at each point. On day 21 an observer could see 15 sessions of lows above the 21-day and a clean crossover. What they couldn’t see was whether the 50-day would turn up before the low gave way. The rule’s answer on day 21 was simply “not yet”, and the stretch never moved past that. A trader who called it a power trend anyway because “two out of three is close” would have been treating a bounce under a falling 50-day as a sustained trend.
The second recovery: when each condition switches on
The index makes a higher low on day 31, at 4,055.78 against the day 1 low of 4,024.76. Since the 21-day never fell back below the 50-day after day 13, the alignment condition stays satisfied through the decline. That detail’s easy to miss, and it shows how little the crossover alone says.
| Day | Event | Levels |
|---|---|---|
| 17 | 21-day above 50-day for a 5th session (stays satisfied) | EMA 4,241.47, SMA 4,181.96 |
| 33 | 50-day turns up and keeps rising | SMA 4,155.44 to 4,155.67 |
| 37 | First low above the 21-day in this recovery | Low 4,197.87, EMA 4,188.70 |
| 45 | Low count reaches 9 | Low 4,347.69, EMA 4,273.57 |
| 46 | Low count reaches 10, up close: power trend on | Close 4,475.66 vs 4,453.45 |
Day 46 is the first session on which the full state qualifies. The low of 4,434.75 is above the 21-day at 4,291.94 for the 10th straight session, the 21-day has been above the 50-day (4,223.27) for 34 sessions, the 50-day has risen for 14 straight sessions, and the close of 4,475.66 is up from 4,453.45.
The rule fires 15 sessions after the day 31 low, with the index already 9.70% above that day’s close of 4,079.76. That lag is built in. A rule that demands 10 sessions of lows above a moving average can only describe strength after it has been on display for two weeks.
Through a pullback, and the session it switches off
The index climbs to a close of 5,405.36 on day 100, then slides for six sessions to 5,138.60 on day 106, a 4.94% decline. On day 105 the low of 5,184.66 dips under the 21-day at 5,210.36, the first undercut since activation. Day 106 goes lower, to 5,096.20, but that low is still 2.11% above the 50-day at 4,990.87, and the 21-day remains 212.97 points above the 50-day.
Under the stated rules nothing changes. The low condition only matters for switching the state on. Once it’s on, only the 21-day crossing below the 50-day ends it. A common misread treats the first close under the 21-day as the end of a power trend, which mixes up the switch-on test with the switch-off test. The pullback is information, and a trader might reasonably tighten up, but the classification itself holds.
The advance resumes and peaks at a close of 5,689.69 on day 133, 27.13% above the activation close. Then a slower decline begins. The low falls under the 21-day on day 141 and stays there. On day 147 the 50-day turns down, from 5,404.08 to 5,402.64. Still no change of state, because a falling 50-day isn’t part of the switch-off rule.
Day 152 ends it. The 21-day EMA, at 5,393.83, slips below the 50-day at 5,394.62. The close that day is 5,292.73, 6.98% below the peak close and, for what it’s worth, an up day. The power trend held from day 46 through day 151, 106 sessions.
Notice how slowly the switch-off rule reacts. By the time it switched off, the low had been under the 21-day for 12 straight sessions, days 141 through 152. A crossover of two moving averages is a lagging event by construction, so the state describes the past several weeks rather than the latest bar.
Rally confirmation and the power trend answer different timing questions
A follow-through day answers an early question: has a rally attempt off a low shown enough institutional demand to be treated as a confirmed uptrend? It comes from a single strong session, on higher volume, several days into the attempt. This price-only example carries no volume series, so it cannot place a follow-through day, but that signal comes early in a rally attempt while the power trend needs at least 10 sessions of lows above the 21-day.
The power trend answers a later question: has the confirmed advance persisted long enough, across several time frames, to be described as sustained strength? It needs weeks of evidence. The two can disagree in both directions. A rally attempt can earn a follow-through day and still fail before it ever qualifies, and days 1 to 22 show what that failure looks like on the price side. And a power trend can stay on while a stack of distribution days builds up, since the switch-off rule reads moving averages and ignores volume entirely.
That’s why the labels sit beside each other rather than replacing one another. The same goes for stretch. An index can be in a power trend and also be extended well above its 50-day moving average. On day 100 the close of 5,405.36 sat 10.15% above the 50-day at 4,907.11, and six sessions of selling followed. The power trend label said nothing about that stretch. An extension measure looks at that distance from the 50-day directly, which the label does not.
Reading the backdrop alongside leaders, breadth and your own results
A power trend describes the index. Whether it’s a good environment for your own trading is a separate question, and other evidence has to answer it.
The first is leading stocks. William O’Neil’s approach treated the market’s direction and the behaviour of its leaders as two readings that should agree. If the index qualifies while recent breakouts in leading names keep failing, the label and the stocks you actually trade aren’t telling the same story.
The second is your own results. A trader using progressive exposure, raising position size only as recent trades work, can use the power trend as background while letting the trade results set the pace. Under that approach, a qualifying index paired with a string of stopped-out trades would typically leave exposure where it is.
Breadth deserves its own check because cap-weighted indexes can rise on a few large names. Take a hypothetical five-member index weighted 40%, 25%, 15%, 10% and 10%, where the members return +45%, +30%, +2%, -4% and -6% over the same stretch. The cap-weighted index gains 24.8%. The median member gains 2%, the equal-weighted average is 13.4%, and the two largest names alone contribute 25.5 percentage points, more than the whole index return. That index could pass every power trend condition while three of its five members barely move or fall. Comparing the index with an equal-weighted version, an advance-decline line or a count of industry groups making new highs shows whether the gains are broad or concentrated.
What a power trend label can’t tell you
The classification follows price progress by design. In this example it switched on 15 sessions after the low and switched off 19 sessions after the peak close, and any rule built on 10-session counts and moving-average crossovers will behave the same way.
It can also flip in choppy conditions. When the 21-day and the 50-day run close together, small moves can push the 21-day above and below the 50-day in quick succession, turning the state on and off without the market doing anything meaningful.
It doesn’t predict duration. The day 46 activation carried no information about whether the state would last 106 sessions or 10. The hypothetical figures in this guide demonstrate the mechanics only and say nothing about historical results.
And it doesn’t vouch for any single chart. A stock breaking out during a power trend still needs its own base, volume and relative strength to justify the trade. A strong backdrop doesn’t turn a weak setup into a sound one.
Use the power trend as a description of how the index has behaved, check it against breadth, leaders and your own results, and let it change your expectations without making the decision for you.
Learn the pattern. Ride the trend. Keep the gains.
Educational content only. Not investment advice. Trading involves risk. You are responsible for your decisions.
Get the free Market Wisdom e-book
Join Trends and Breakouts — historical winners, breakout studies, and risk lessons. No spam, unsubscribe anytime.