
An index has fallen 14.91% from its peak. For three weeks, every bounce has been sold, and the growth stocks on your watchlist have spent that time getting hurt. Then the index closes higher for a day, and then for another. At some point you have to decide whether this rebound is the start of something or another pause on the way down. The follow-through day is a rule-based answer to that question, and it gives a weaker answer than its reputation suggests.
The idea comes from the growth-stock method associated with William O’Neil. It sets out a specific sequence of index sessions after a decline, and one kind of session within it that counts as confirmation. This guide builds that sequence one session at a time, using hypothetical index data, so each reading uses only what was known on the day.
The rally attempt and its reference low
A follow-through day can only happen inside a rally attempt, so the attempt comes first. After a decline, the rally attempt begins on the first session the index closes higher. That session is day 1. The lowest price of the decline, the low that came just before day 1, becomes the reference low.
The reference low is the attempt’s tripwire. While the index stays above it, the count keeps running, even through down days. If the index trades below it, the attempt is over, the count resets, and a new rally attempt can only begin with a later up day. Some versions of the method also start a rally attempt on a down session that closes in the upper half of its range, which marks the low a session earlier. Either convention works if it’s stated and applied consistently.
In the hypothetical index used below, the decline bottoms on a session with a low of 4,180.20 and a close of 4,205.60, after a peak close of 4,912.40. Everything that follows is measured against 4,180.20.
What makes a session a follow-through day
A follow-through day is a session within an active rally attempt, on or after a minimum day count, in which a major index closes up by at least a set percentage on higher volume than the session before. Each part of that definition has to be stated, because the published versions differ.
| Element | Common convention | Documented variation |
|---|---|---|
| Timing | Day 4 or later of the rally attempt | Earlier writing put the typical window at days 4 to 7; some versions allowed day 3 |
| Index | A major index such as the Nasdaq Composite or the S&P 500 | Some readers require more than one index to qualify |
| Price gain | A percentage close-to-close gain | Published thresholds have ranged from about 1% to about 1.7%, adjusted over the decades as volatility changed |
| Volume | Higher than the previous session’s volume | Some readers also want volume above its recent average |
None of these thresholds is universally accepted, and no single one is correct. The threshold matters most for borderline sessions. Suppose day 5 of an attempt closed at 4,308.69 from a prior close of 4,251.30. That’s a 1.35% gain. Under a 1% or 1.25% threshold it qualifies; under 1.5% or 1.7% it doesn’t. The same chart produces two different readings depending on a number that was chosen before the session began, which is why the number belongs in your notes before the session, not after it.
Why the session’s position in the attempt matters
Day 1 and day 2 of a rebound are often the most dramatic sessions of the whole move, and they’re excluded on purpose. A decline leaves short sellers with profits to take and leaves oversold stocks primed for a reflex bounce. A sharp first or second day can come almost entirely from that pressure easing. By day 4, the index has had time to fail. A strong, heavy-volume gain arriving after it has survived several sessions without breaking the reference low says more about demand than the same gain arriving straight off the bottom.
The proposed mechanism is cautious for a reason. A big up day on rising volume suggests that larger buyers may be returning, because that’s the kind of demand that moves a broad index. The bar itself can’t tell you who bought, why they bought, or whether they’ll keep buying. It records price and volume. Reading institutions into it is an inference, and it should be treated as one.
Sequence A: a qualifying day, one session at a time
All figures here are hypothetical. Volume is shown in billions of shares.
| Session | Close | Change | Volume | What is known at the close |
|---|---|---|---|---|
| Low day | 4,205.60 | 4.10 | Low of 4,180.20. No attempt yet | |
| Day 1 | 4,238.90 | +0.79% | 3.40 | First up close. Attempt starts; reference low 4,180.20 |
| Day 2 | 4,221.40 | -0.41% | 3.05 | Down day, low 4,196.10, still above 4,180.20. Attempt intact |
| Day 3 | 4,262.70 | +0.98% | 3.20 | Higher volume, but too early and under every threshold |
| Day 4 | 4,251.30 | -0.27% | 3.15 | Eligible window opens. No qualifying gain |
| Day 5 | 4,334.80 | +1.96% | 3.85 | Gain clears every published threshold; volume 1.22 times day 4. Follow-through day |
At the close of day 5, the reading is specific. The rally attempt survived four sessions without touching 4,180.20, and on day 5 the index gained 1.96% on volume 22.2% above the prior session’s. That meets the definition under any of the thresholds in the table. It’s a confirmation. It isn’t yet a market that has proved anything.
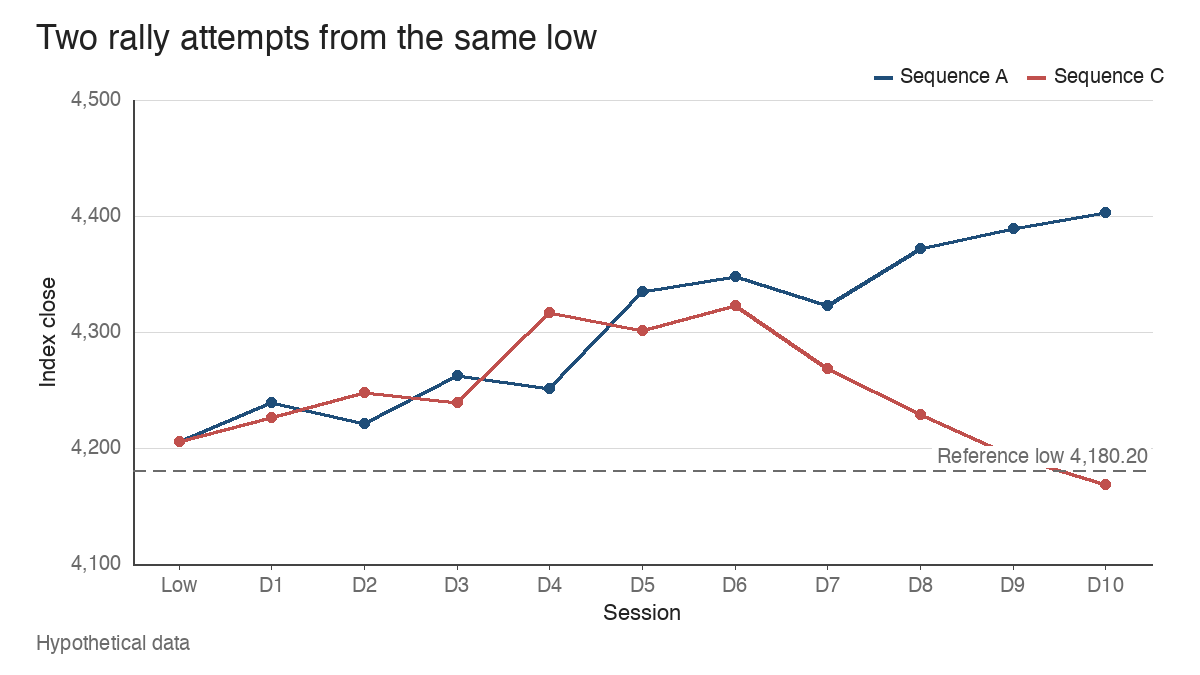
The sessions after day 5 matter just as much. In this version, the index closes at 4,348.10, 4,322.50, 4,371.90, 4,389.20 and 4,402.60 on days 6 to 10. By day 10 it sits 1.56% above the follow-through close and 5.32% above the reference low. A trader using this method might read that as the confirmation holding up so far. That’s all it is.
Sequence B: an early rebound that doesn’t qualify
Start from the same low. This time, day 1 is the loud one: the index jumps 2.30% to 4,302.40 on 4.60 billion shares, 1.12 times the low day’s volume. The gain and volume would pass any follow-through test, but the session is day 1, so the timing rule excludes it.
Day 2 adds 0.36% to 4,317.90. Day 3 gives back 1.89% to 4,236.10. On day 4 the index trades down to 4,171.50, below the 4,180.20 reference low, and closes at 4,188.40. The attempt is over before the eligible window could produce anything. The count resets, 4,171.50 becomes the new reference low, and the next up close will be a new day 1.
The common misread here is to treat the size of the first bounce as the signal. In this sequence, the biggest gain was the least informative session, because it came before the index had shown it could hold. Viewed after the fact, a chart like this can look like an obvious failure. At the close of day 1 it looked like the strongest rebound of the three sequences.
Sequence C: a qualifying day that later fails
The third version produces a textbook confirmation and then gives it back.
Days 1 to 3 close at 4,226.10, 4,247.80 and 4,239.20, with no session touching the reference low. On day 4, the index rises 1.82% to 4,316.40, on 3.70 billion shares against 3.25 billion the session before. Volume is up 13.8%. That’s a follow-through day under every threshold in the table, on the first eligible day, and at the close of day 4 it’s indistinguishable in kind from day 5 in Sequence A.
Then the next sessions turn. Day 5 slips 0.34% on higher volume. Day 7 falls 1.26% to 4,268.50 on volume 1.19 times the day before. Day 8 closes at 4,229.30, below the follow-through day’s low of 4,241.00. Day 10 closes at 4,168.90, under the 4,180.20 reference low, 3.42% below the follow-through close. The rally attempt has failed, and the method starts counting again from scratch.
Nothing on day 4 warned of this. The failure only became visible through later sessions: down days on heavier volume, a close back under the follow-through day’s low, and finally a break of the reference low. I’d treat the day 8 close under 4,241.00 as the point where the confirmation lost its footing, two sessions before the formal break.
The figure below plots Sequence A and Sequence C from the same low. For the first five sessions they’re hard to tell apart.
Confirmation and certainty are different things
A follow-through day confirms that a rally attempt has met a stated test. It doesn’t establish that the correction has ended, and it doesn’t forecast how far an advance will go. Sequence A and Sequence C both met the test. Their next five sessions went in opposite directions.
O’Neil’s work argued that major market advances have tended to begin with a session of this kind. That’s an observation from his own historical studies, made under his own definitions, and it says nothing about how often a qualifying day leads to a sustained advance. This guide doesn’t quote a success rate, because a rate depends entirely on the threshold, the index, the day window and the way “success” is defined. Change any one and the number changes.
A second point is easy to lose. The follow-through day is a statement about the index. Whether an individual stock has a sound setup is a separate question with its own evidence: the base, the pivot, volume on the breakout, the relative strength line. A confirmed market doesn’t improve a poor base, and a strong base inside an unconfirmed market is still a strong base facing a harder environment. The lesson on leading stocks in market context treats that relationship in more detail.
Leadership and breadth as supporting evidence
Once a follow-through day has printed, other evidence can strengthen or weaken the reading. It doesn’t change the definition. A trader who quietly lowers the threshold because breadth looks good, or ignores a qualifying day because leaders look weak, is running a different method without saying so. Keep the formal reading and the supporting evidence in separate columns.
Useful supporting evidence in the hypothetical sequences:
- Breadth. In Sequence A, advancing issues outnumber declining issues by 2,140 to 780 on day 5, and the advance-decline line turns higher with the index. In Sequence C, the line barely moves on the follow-through day and falls through days 7 to 10.
- New highs and new lows. In Sequence A, daily new highs rise from 41 on day 5 to 118 by day 10, while new lows shrink from 63 to 22. In Sequence C, new lows still outnumber new highs on day 8. The lesson on new highs and new lows covers how to read that crossover.
- Emerging breakouts. In Sequence A, most of the handful of stocks clearing pivots in the following week hold above them. In Sequence C, most slip back into their bases, the pattern described in failed breakouts. Leaders that can’t hold breakouts are an early sign that the index confirmation lacks support underneath.
None of these converts a confirmation into a certainty. They tell you whether the confirmation is being joined by the stocks that would have to carry a real advance.
Where follow-through readings go wrong
The limitations are specific, and each one has a recognisable shape.
False confirmations. Sequence C is the standard case. A qualifying day can be followed by distribution and a break of the reference low within a couple of weeks. The definition has no mechanism to prevent this.
Disagreement among indexes. On day 5 of Sequence A, suppose a second, equal-weighted index rose only 0.6%, from 1,862.40 to 1,873.60. The cap-weighted index confirmed and the equal-weighted one didn’t. That gap usually means a small group of large stocks did the lifting, which is exactly the kind of distortion covered in index weighting methods. Decide in advance whether one index is enough.
Volume distortions. The volume test compares one session with the session before, so anything that inflates a single day’s volume can produce a qualifying day: options expiration, an index rebalance, or a quiet holiday-shortened session as the comparison day. A trader could check whether the volume rise has an obvious mechanical cause before giving it weight.
Hindsight selection. Looking back at a chart that went on to rally, it’s easy to find the day that “confirmed” it and much harder to remember the qualifying days that failed. Reading the sessions one at a time, as in the tables above, is the simplest guard against that.
Reading the follow-through day as a filter on the market
The follow-through day is a disciplined way to stop treating every bounce as a bottom. It asks the index to survive a few sessions above its low and then show a strong, heavier-volume gain, under rules written down before the sessions happen. What it gives back is a state change, from rally attempt to confirmed rally attempt, and nothing about the outcome.
Learn the pattern. Ride the trend. Keep the gains.
Educational content only. Not investment advice. Trading involves risk. You are responsible for your decisions.
Get the free Market Wisdom e-book
Join Trends and Breakouts — historical winners, breakout studies, and risk lessons. No spam, unsubscribe anytime.