10-Week Moving Average: Reading the First Pullback

Six weeks after a breakout from a 48.20 pivot, a hypothetical stock has run to 61.80. Then it gives some back. Three weeks in a row close lower, and the…

Comments Off on 10-Week Moving Average: Reading the First Pullback

Bruce Kovner: Turn Market Views into Defined Exposure

Three hypothetical positions each carry 500 of planned risk. One depends on a stronger currency, another on lower commodity prices and a third on a related interest-rate move. The account…

Comments Off on Bruce Kovner: Turn Market Views into Defined Exposure

Brian Shannon: Put Timeframes and Anchored VWAP to Work

A hypothetical stock breaks above 42.00 on a fifteen-minute chart while its daily chart sits beneath repeated highs at 42.50. The short-term move is real, but so is the nearby…

Comments Off on Brian Shannon: Put Timeframes and Anchored VWAP to Work

Wide and Loose Base: Reading Unstable Consolidation

Picture a stock that ran from 41.20 to 84.60 in five months and then spent eight weeks moving sideways. On a zoomed-out weekly chart the pause looks respectable. Price held…

Comments Off on Wide and Loose Base: Reading Unstable Consolidation
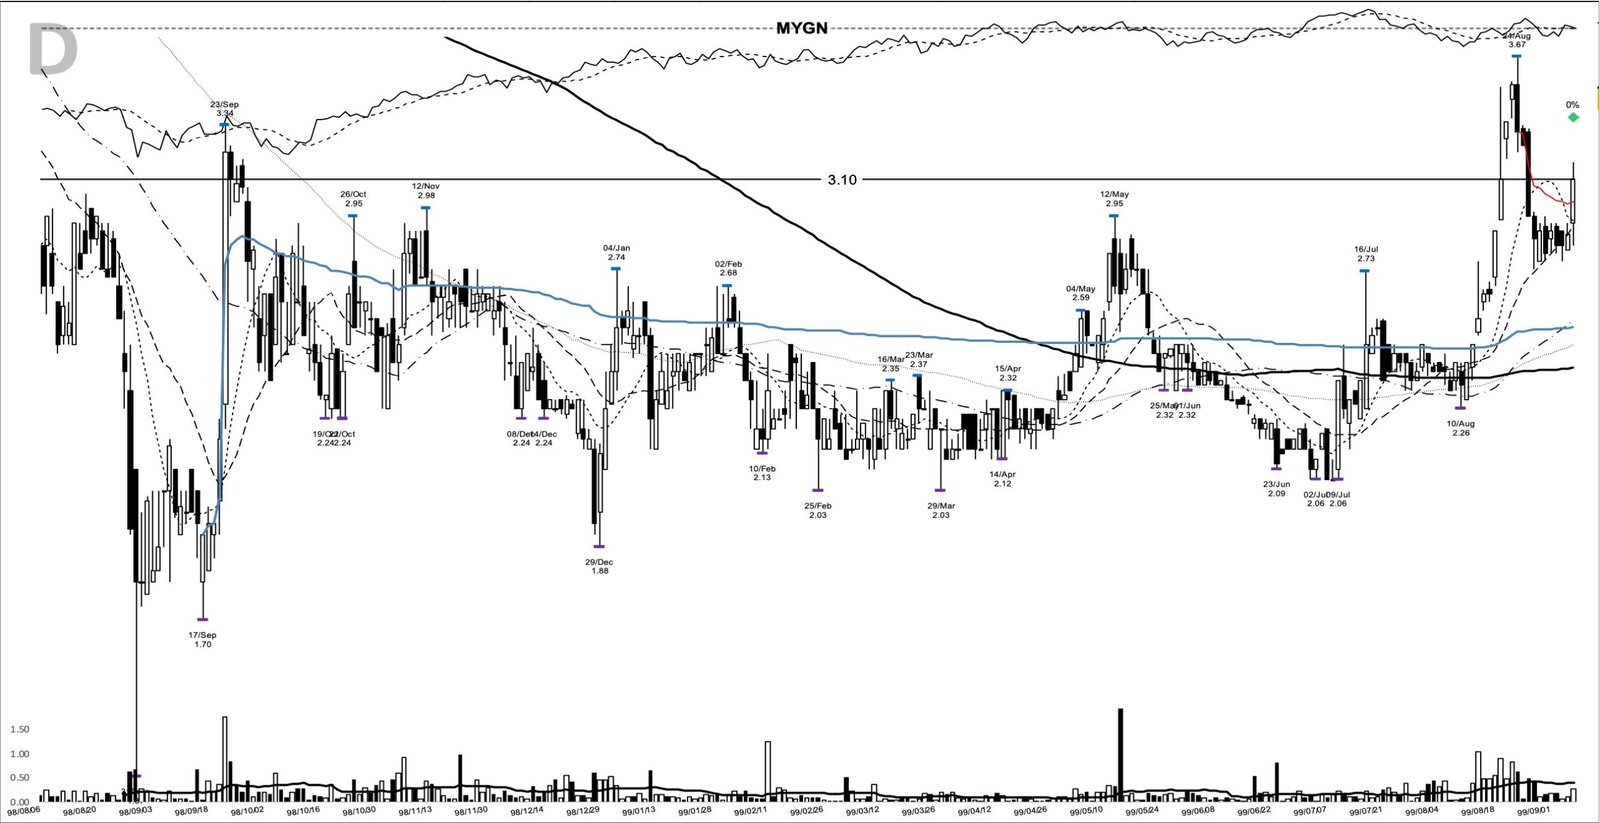
Read more about the article MYGN +1021%: the year-long base breakout of the genomics boom, September 1999
MYGN on the 1999-09-08 breakout entry, from my chart archive

MYGN +1021%: the year-long base breakout of the genomics boom, September 1999

From September 1998 to mid-August 1999, Myriad Genetics traded between a 1.70 low and a 3.34 high, a gene-discovery company whose stock had gone nowhere for eleven months. MYGN is…

Comments Off on MYGN +1021%: the year-long base breakout of the genomics boom, September 1999

Brian Gelber: How Trading Changes with the Marketplace

A hypothetical trading model earns 0.08 per share before costs. Its execution assumptions allow 0.03 per share for the complete trade, leaving 0.05. If the actual cost rises to 0.09,…

Comments Off on Brian Gelber: How Trading Changes with the Marketplace

Mental Rehearsal for Trading: Practicing the Hard Moments

The position was bought on a breakout through 48.20, and the written stop sits at 45.30, a planned risk of 2.90 a share. At 8:40 the next morning the pre-market…

Comments Off on Mental Rehearsal for Trading: Practicing the Hard Moments

Brett Steenbarger: Make Trading Practice Measurable

A hypothetical breakout reaches its planned exit at 29.00 after an entry at 30.00. The trader closes the position, records a 1R loss and immediately takes another setup that never…

Comments Off on Brett Steenbarger: Make Trading Practice Measurable

Overtrading: When Pressure Replaces Your Setup Criteria

The plan on the screen is short. A growth stock has built a seven-week base with a pivot at 52.40, the index is holding above its 50-day moving average, and…

Comments Off on Overtrading: When Pressure Replaces Your Setup Criteria

Alexander Elder: Connect Trading Rules, Mind and Risk

A hypothetical trade has an entry at 40.00, an exit reference at 38.00 and a quantity of 500 shares. The planned price risk is 1,000 before costs. If the trader…

Comments Off on Alexander Elder: Connect Trading Rules, Mind and Risk