7-8% Stop Loss Rule: An Entry-Based Loss Ceiling Explained

A stock clears its base, a trader enters at 100.00, and three sessions later the price is sitting at 95.40. The breakout volume has faded. Nothing on the chart says…

Comments Off on 7-8% Stop Loss Rule: An Entry-Based Loss Ceiling Explained

Cup With Handle Pattern: Prior Trend, Handle and Pivot

A growth stock runs from 32.00 to 60.00, pulls back to 44.40, works its way back up to 58.90, then drifts for two weeks inside a narrow range just under…

Comments Off on Cup With Handle Pattern: Prior Trend, Handle and Pivot
Read more about the article UPST +92%: the post-IPO base breakout ahead of earnings, August 2021
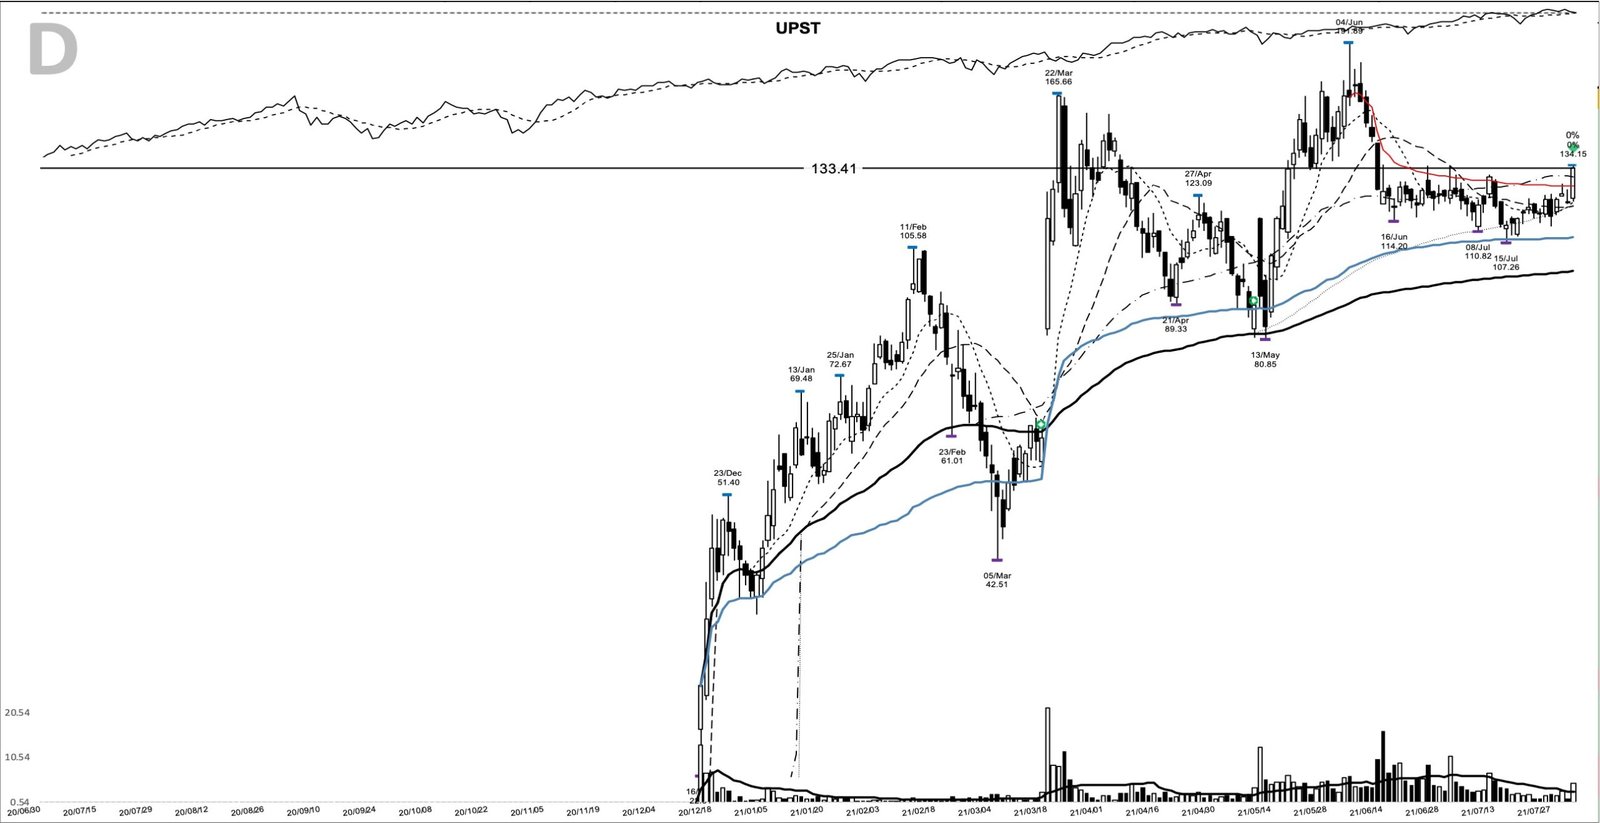
UPST on the 2021-08-02 breakout entry, from my chart archive

UPST +92%: the post-IPO base breakout ahead of earnings, August 2021

On 2 August 2021, Upstart Holdings closed at 133.41, up from 120.76 the session before and above a 130.9 high that had capped it since 12 July. Six sessions later…

Comments Off on UPST +92%: the post-IPO base breakout ahead of earnings, August 2021

Index Extension Above the 50-Day Moving Average Explained

A base breakout clears its pivot on heavy volume, and the setup on the stock's own chart looks clean. The benchmark index closed at 4,780 that same day, with its…

Comments Off on Index Extension Above the 50-Day Moving Average Explained
Read more about the article MSTR +344%: a six-month base breakout that ran on bitcoin, September 2020
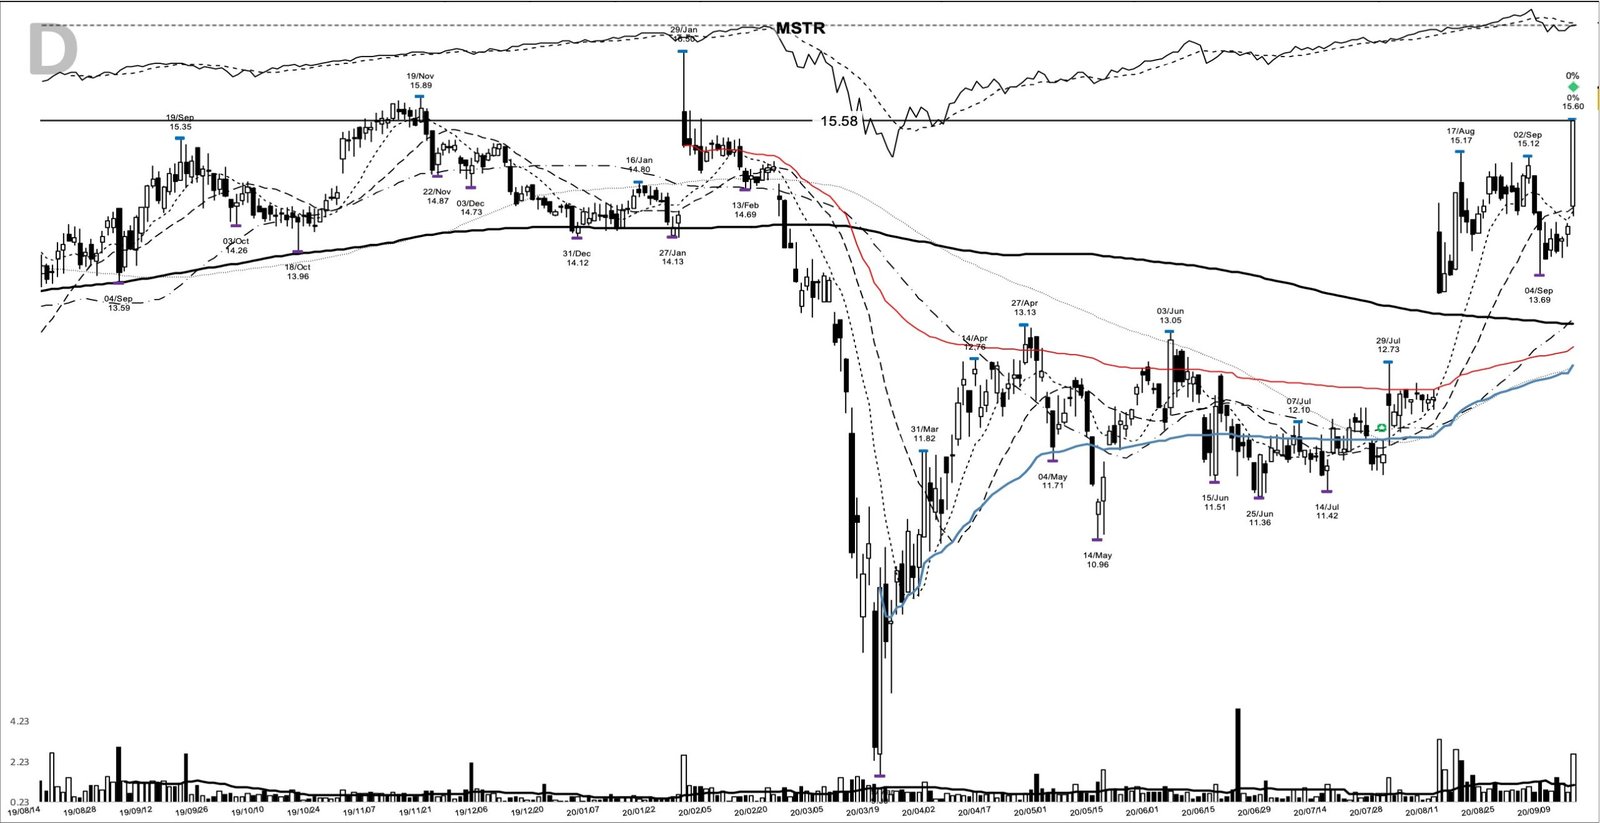
MSTR on the 2020-09-15 breakout entry, from my chart archive

MSTR +344%: a six-month base breakout that ran on bitcoin, September 2020

On 15 September 2020, the day MicroStrategy disclosed a second bitcoin purchase worth 175 million dollars, the stock opened at 14.50 and closed at 15.57. That was a week after…

Comments Off on MSTR +344%: a six-month base breakout that ran on bitcoin, September 2020

Disposition Effect: Why Purchase Price Distorts Exits

Two journal entries from the same breakout method can look almost identical at the moment of entry, and the disposition effect is often what pulls them apart later. A stock…

Comments Off on Disposition Effect: Why Purchase Price Distorts Exits

Failed Breakout: Reading the Sequence After the Pivot

A growth stock spends seven weeks building a flat base under 48.20, then closes at 49.35 on volume running 2.1 times its 50-day average. Two weeks later it might be…

Comments Off on Failed Breakout: Reading the Sequence After the Pivot

Breakout Pivot and Price Extension in Base Patterns

Two traders watch the same base. The top of the range sits at 100.00 and the nearest chart-failure level is a support area at 96.00. One gets a fill at…

Comments Off on Breakout Pivot and Price Extension in Base Patterns

Historical Chart Study: How to Learn From Past Breakouts

Two growth stocks finish their bases in the same quarter. Each one ran more than 100% in the months before, built a tidy six- or seven-week consolidation about 10% deep,…

Comments Off on Historical Chart Study: How to Learn From Past Breakouts

Pocket Pivot: How to Read Demand Before the Breakout

A growth stock has spent seven weeks moving sideways between 46.80 and 52.10. The 50-day moving average sits at 48.90 and is still rising. On a quiet Tuesday the stock…

Comments Off on Pocket Pivot: How to Read Demand Before the Breakout