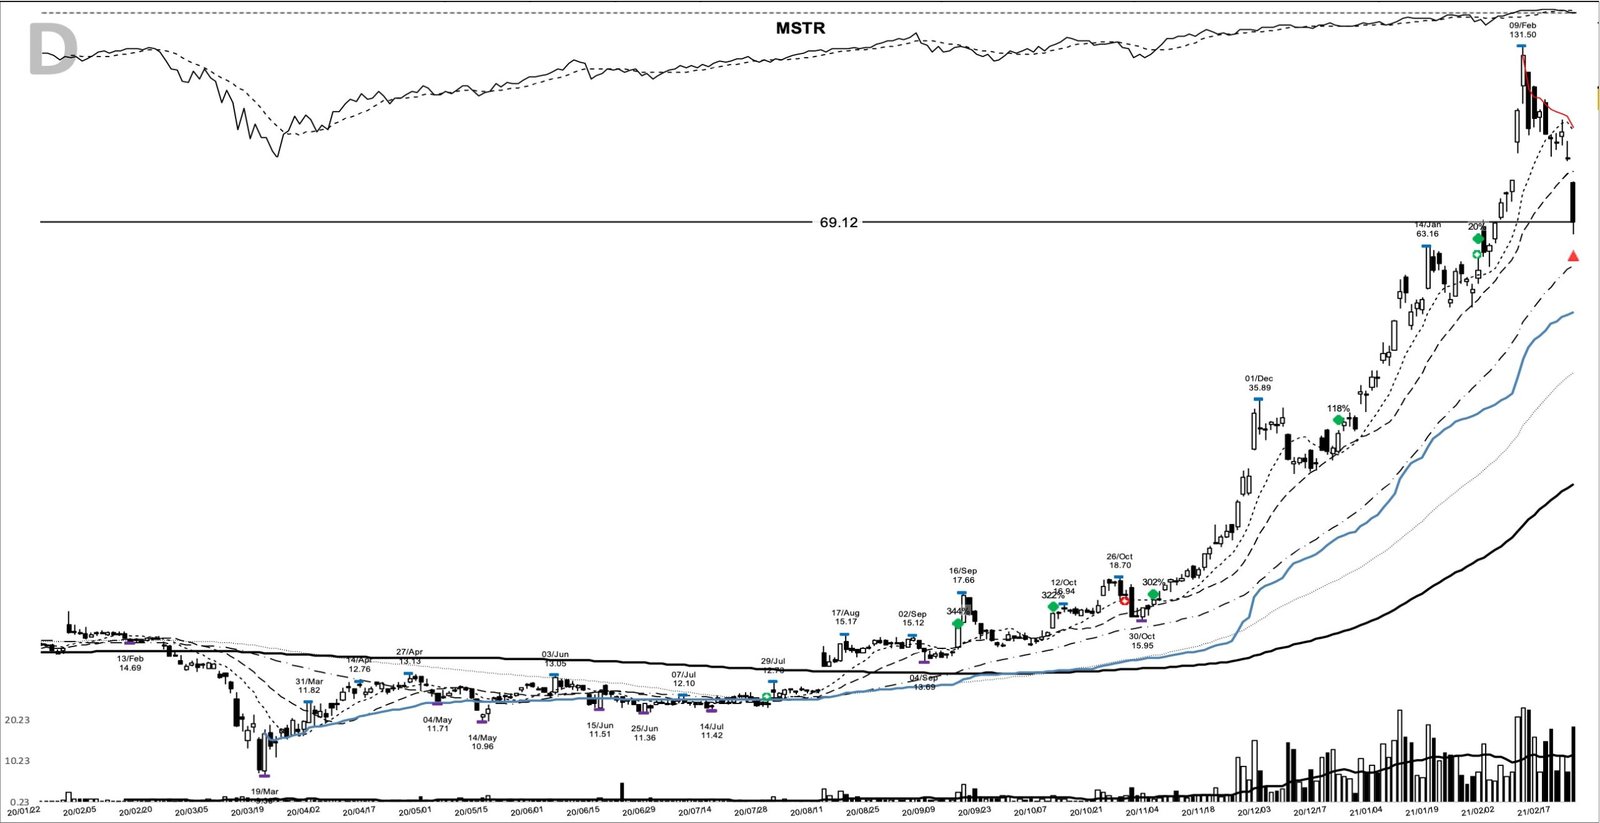
On 15 September 2020, the day MicroStrategy disclosed a second bitcoin purchase worth 175 million dollars, the stock opened at 14.50 and closed at 15.57. That was a week after the Nasdaq’s fastest-ever slide from a record into correction territory. MSTR is back on traders’ screens this week at number 66 on ApeWisdom’s mention rankings, and when it shows up there, this is the chart worth studying. The mstr base breakout in one line: a September 2020 close above a six-month range on 2.5 times average volume, followed by a gain of 343.8 percent in 161 calendar days.
Key takeaways from the MSTR base breakout of September 2020
- The pattern: a six-month recovery base from the 9.00 low of 19 March 2020, capped by a 15.17 high on 17 August.
- The entry day closed at 15.57, above that 15.17 pivot, on 2,620,670 shares, 2.5 times the 20-day average.
- The move: +343.8 percent to the 69.12 exit on 23 February 2021, after a 131.50 intraday peak on 9 February.
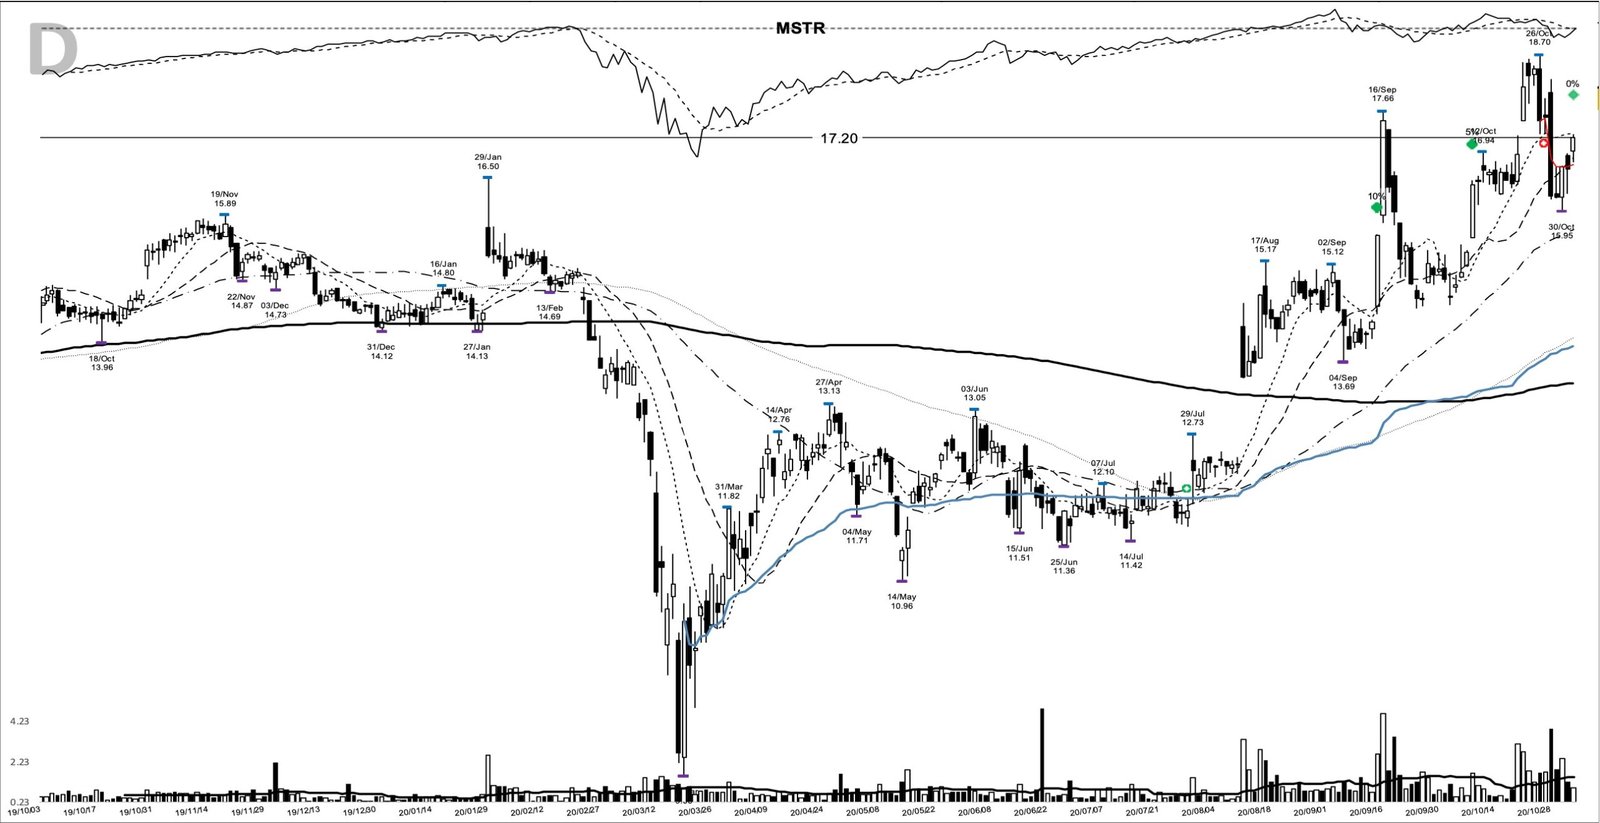
- Four add-on chances followed, from 16.39 on 8 October 2020 to 57.84 on 28 January 2021.
- The lesson: the width of the trailing rule decided whether a trader kept 86 percent or 343.8 percent of this trend.
MSTR’s September 2020 trade at a glance
| Field | Value |
|---|---|
| Ticker | MSTR |
| Breakout date | 15 September 2020 |
| Breakout close | $15.57 |
| Volume vs 20-day average | 2.5x |
| Exit date | 23 February 2021 |
| Exit close | $69.12 |
| Gain | +343.8% |
| Calendar days | 161 |
| Peak before exit | $131.50 (9 February 2021) |
How the MSTR base formed under 15.17
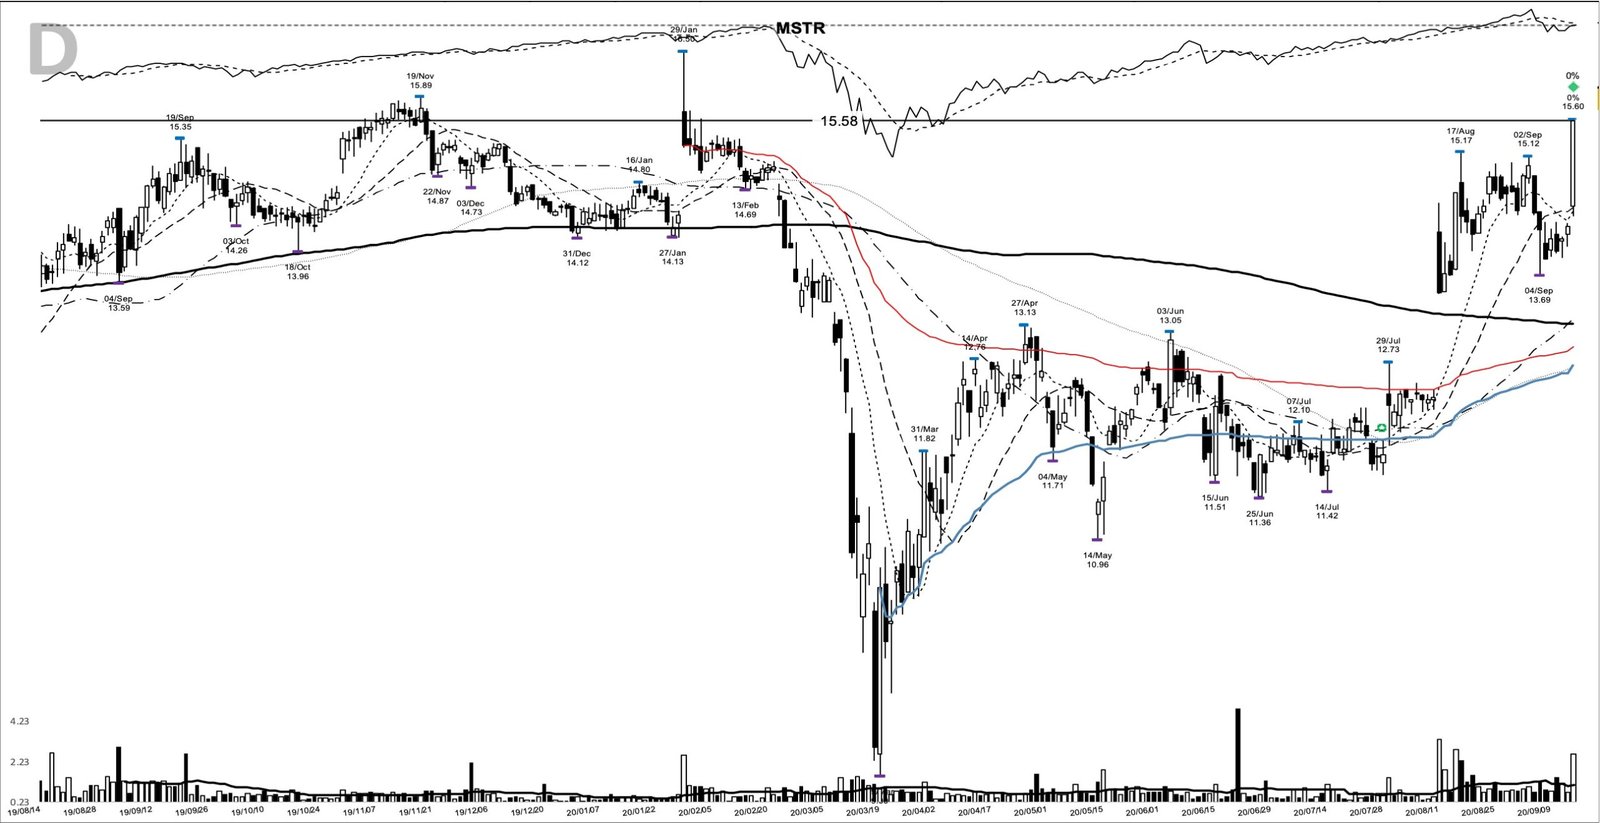
Through late 2019 and early 2020, MSTR kept running into the same ceiling: 15.35 on 19 September 2019, 15.89 on 19 November, and a spike to 16.50 on 29 January 2020 that closed back at 15.26. Then came the March crash, and the stock bottomed at 9.00 on 19 March.
The recovery was slow. From April to July the stock chopped between a 13.13 high on 27 April and a 10.96 low on 14 May, with later lows at 11.36 on 25 June and 11.42 on 14 July. On the chart the shorter moving averages flattened and knotted together through June and July, and price stayed under the heavy long-term average that had rolled over in March.
The base changed character on 11 August. MSTR had closed at 12.36 the day before, then opened at 14.20 on 3,338,920 shares, more than five times its 20-day average. That gap put price back above the long average, and the high of the following week, 15.17 on 17 August, became the pivot. Over the next month the stock built a tight shelf under it: 15.12 on 2 September, then pullbacks to 13.69 on 4 September and 13.88 on 8 September.
The entry bar of 15 September did what a breakout bar should. It opened at 14.50, traded to 15.60, and closed at 15.57, 9.2 percent above the prior close and near the top of the day’s range. The close cleared the 15.17 pivot on volume of 2.5 times the 20-day average, so this one counts as a confirmed breakout. It still sat 5.6 percent under the 16.50 peak from January, so the old overhead supply hadn’t fully cleared.
A software company that bought bitcoin in 2020
MicroStrategy, now called Strategy, was a business-intelligence software company based in Tysons, Virginia. Per its SEC filings, revenue for the quarter ended June 2020 was 110,584,000 dollars, down 6.1 percent from a year earlier, and none of the eight quarters before it had grown revenue by more than 1.2 percent. EPS was 0.35 in that quarter, down 82.3 percent, after 0.07 in the March quarter.
The story was the balance sheet. With its second-quarter results on 28 July, the company said it would put up to 250 million dollars of excess cash into alternative assets, possibly gold or bitcoin. On 11 August, the gap day, it announced the purchase of 21,454 bitcoin for 250 million dollars. The 8-K filed on 15 September added 16,796 more for 175 million dollars, and by its third-quarter report the company called bitcoin its primary treasury reserve asset. A sleepy software name was turning into a listed way to own bitcoin.
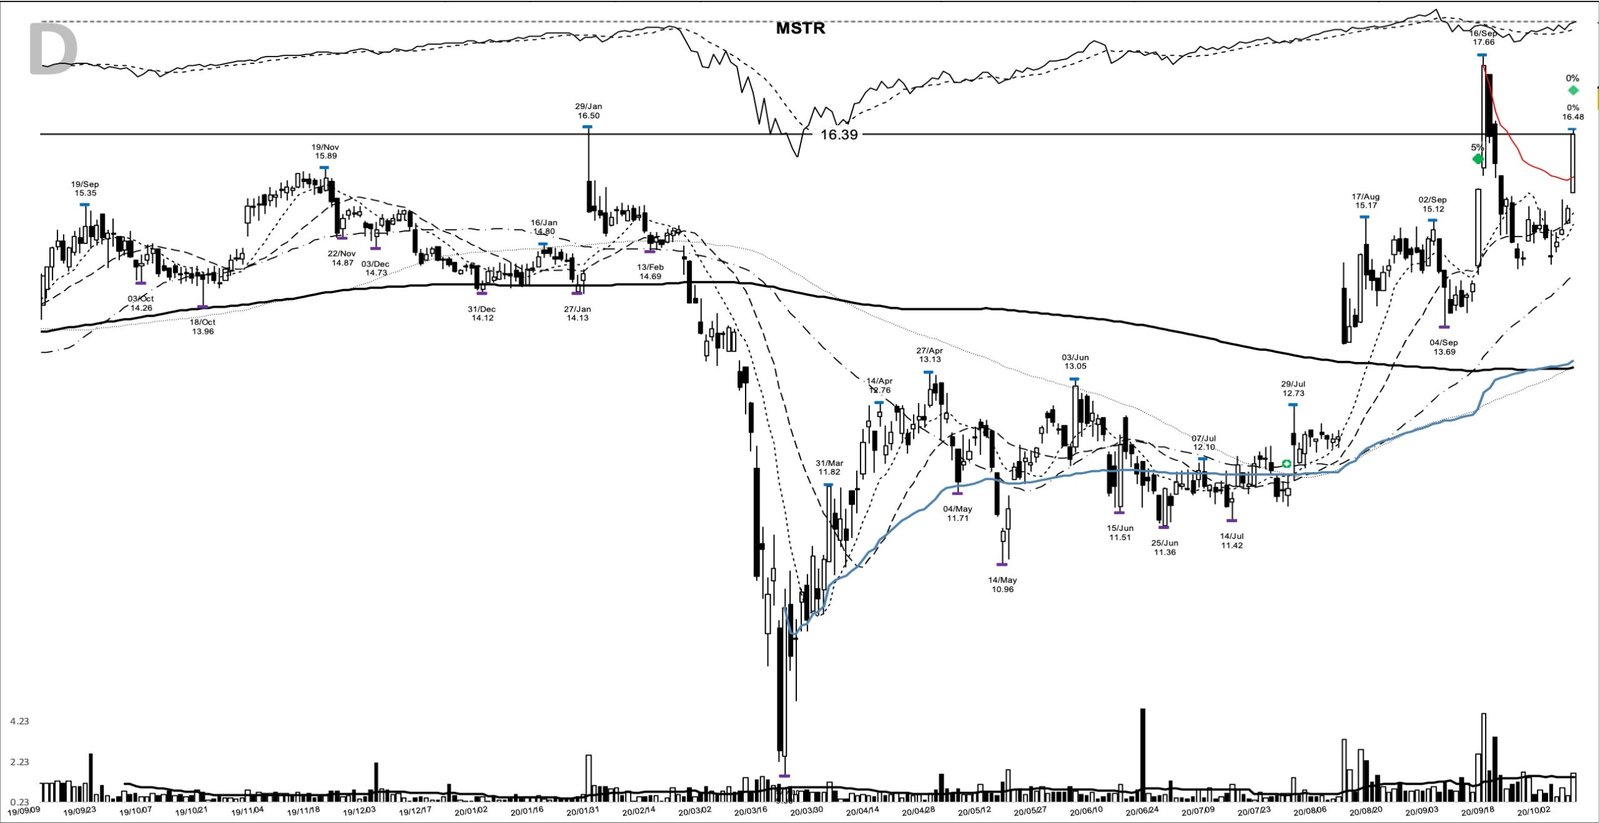
The day after those third-quarter results, 28 October, MSTR closed at 16.22 on 3,873,730 shares, down from 17.56. The drop held above the 15.17 pivot.
September 2020: a breakout inside a Nasdaq correction
The tape around this entry was hostile to growth stocks. After a record on 2 September, the Nasdaq fell 10 percent in three trading sessions, the fastest drop from a record into correction in its history, per Fortune and CNBC. Tesla fell 21.1 percent on 8 September, its biggest one-day drop on record.
That cuts both ways. A breakout in a correcting market carries more risk of failure, and MSTR did slip back under its pivot within days. Its story, though, didn’t depend on the megacap tech trade. There’s more on that judgment in how leading stocks relate to market context.
Preparing for the 15.17 pivot
On the entry day the trend posture was young. The 10-day, 20-day, and 50-day moving averages sat at 14.44, 14.49, and 13.21, and the 15.57 close was 7.9 percent above the 10-day line. It was the first close above that line in the current run, so the short-term trend had only just turned back up.
Three things would have put MSTR on a watchlist before 15 September: the 11 August gap on heavy volume, the tight shelf between 13.69 and 15.17, and a company announcing bitcoin purchases while bitcoin itself held up.
A plan for that day might have been an entry on a close above the 15.17 pivot, with an initial stop below the shelf low of 13.88 from 8 September, 1.69 points or 10.9 percent under the 15.57 close, with the 9.00 low of 19 March marking where the whole base would fail. Once a trade had some room, a trader might trail the 10-day moving average and widen to the 20-day once the move was well advanced. Because this breakout was confirmed, the plan and the study entry coincide here.
From 15.57 to 131.50 and back to 69.12
The first two weeks tested that plan. MSTR closed at 17.49 on 16 September, then faded. By 24 September it traded down to 14.46 and closed at 14.61, back below the pivot and under both the 10-day and 20-day lines. The 13.88 shelf held. On 8 October the stock closed at 16.39, back above the pivot, and that was the first add-on chance.
The real move began in late November. MSTR closed at 24.72 on 24 November on 11,203,990 shares and at 34.28 on 30 November. On 8 December, in the week the company sold convertible notes to fund more bitcoin, it dropped to 28.95 on 14,912,360 shares. That close was 85.9 percent above the entry and the first close under the 10-day line since 3 November. Switched on after the late-November surge, a strict 10-day trail would have ended the trade there.
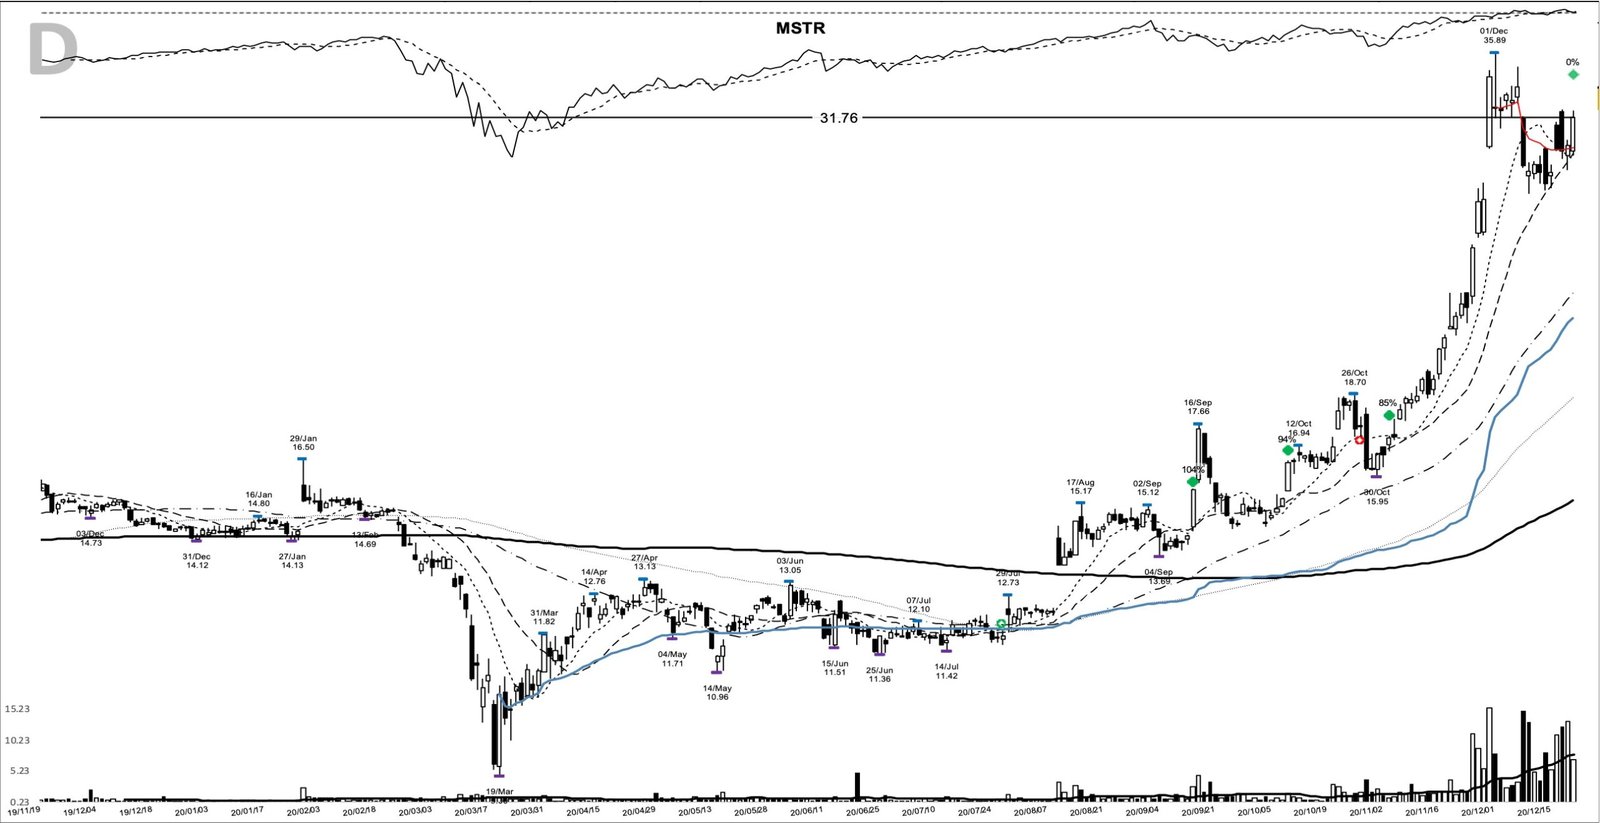
The 20-day line held. On 21 December the company said it had bought 29,646 more bitcoin with the 650 million dollars raised from those notes, and the stock closed at 31.76. For a trader following the wider rule, there was an opportunity to add there, and that add went on to gain another 117.6 percent into the exit. A fourth chance came on 28 January at 57.84, before the climb went vertical.
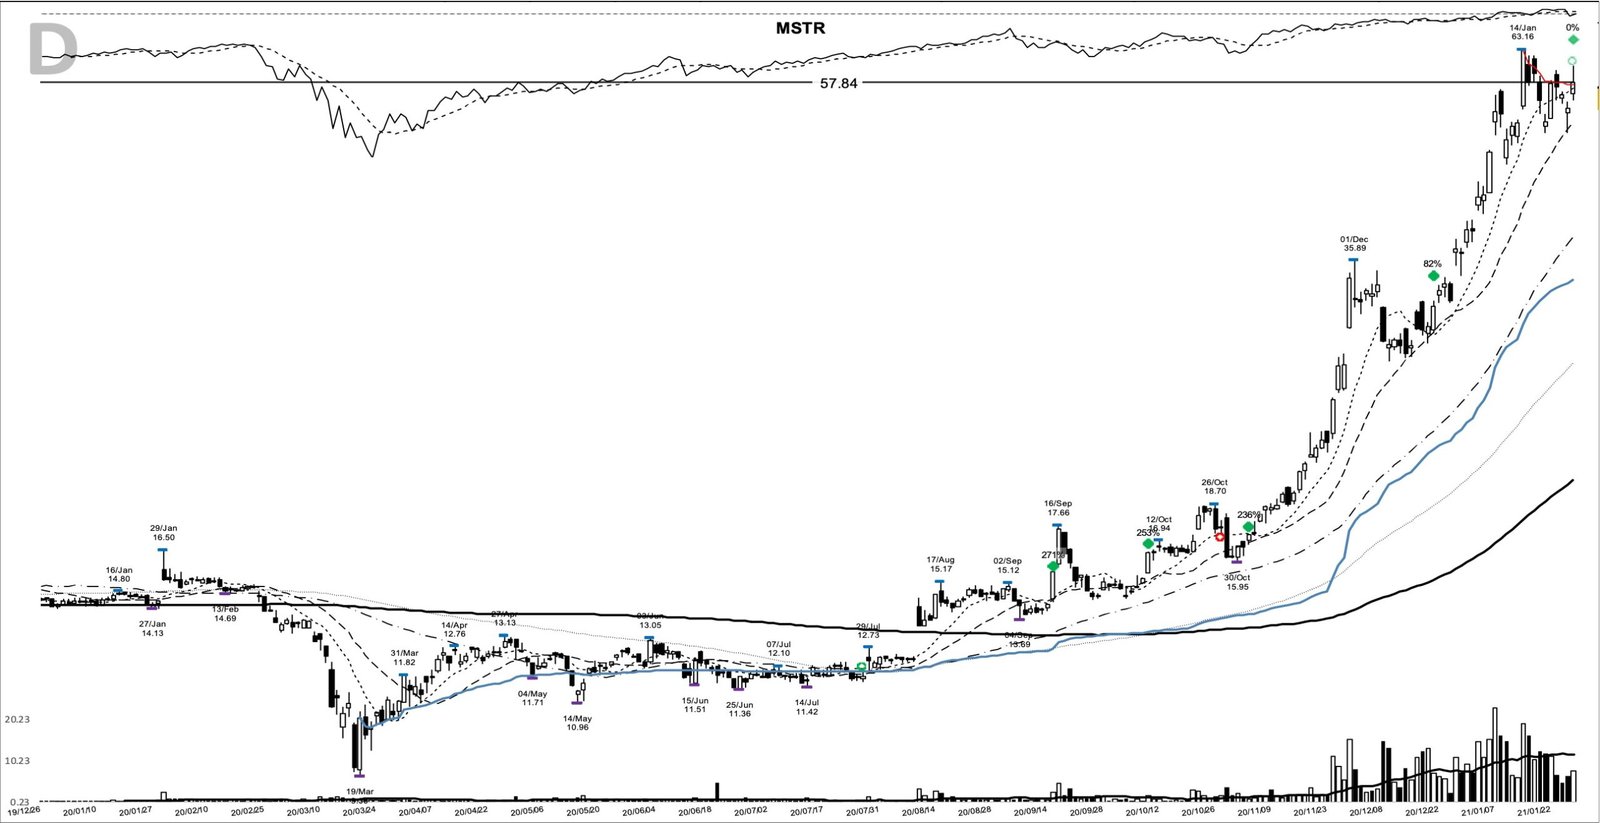
On 8 February Tesla disclosed a 1.5 billion dollar bitcoin purchase, and MSTR closed at 104.10. The next day it traded to 131.50, the peak, then closed at 97.45 on 10 February. Bitcoin set a record on 21 February and fell hard over the next two sessions after US Treasury Secretary Janet Yellen called it highly speculative. On 23 February MSTR opened at 80.00, traded down to 66.00, and closed at 69.12, its first close below the 20-day line since 2 November. That was the exit, 343.8 percent above the 15.57 entry and 161 calendar days later.
Where the MSTR chart misleads
The fundamentals are the first trap. Shrinking revenue and an 82.3 percent drop in quarterly EPS fail every earnings screen in the William O’Neil tradition. This chart worked because the company changed what it owned, and a screen built on earnings acceleration wouldn’t have found it.
The second trap is the late-September pullback. A close at 14.61, back inside the base, looks like a failed breakout. The shelf low held, but you couldn’t have known that on 24 September. A stop under the 13.88 shelf low would have survived that dip, while a moving-average trail applied from day one would have exited at a small loss.
The third misread is the peak. Measured from 131.50, the 69.12 exit gave back 47.4 percent. That’s the cost of trailing a moving average through a move tied to an asset as volatile as bitcoin, and it’s built into the method.
What MSTR teaches about trailing a story stock
The setup on 15 September was clean: a long base, a news-driven gap, a tight shelf, and a volume-backed close above 15.17. A 10-day trail would have left a trader with 86 percent, the 20-day trail with 343.8 percent, and neither would have caught the top. In a move this fast the trailing rule has to be chosen before the trend starts, and add-ons can build size while the trend proves itself.
Learn the pattern. Ride the trend. Keep the gains.
Related studies: the POLA base breakout of November 2020 and the NTLA base breakout of November 2020 from the same post-crash market, and volume confirmation on breakout candles for reading a bar like 15 September. A new winner study lands most evenings.
Price and volume figures are computed from split-adjusted daily OHLCV data; company figures come from SEC filings where cited.
Educational content only. Not investment advice. Trading involves risk. You are responsible for your decisions.
Get the free Market Wisdom e-book
Join Trends and Breakouts — historical winners, breakout studies, and risk lessons. No spam, unsubscribe anytime.