
The market confirmed its uptrend weeks ago. Breakouts on your watchlist have been holding, and the index keeps setting new closing highs. Then it closes down 0.71% on heavier volume than the day before. Two sessions later it does something similar. None of these sessions looks alarming by itself. The question is whether they are adding up to something, and a distribution day count is the method’s way of keeping that tally honest.
This guide covers what happens after confirmation. It assumes the uptrend has already been confirmed (the follow-through day that confirms a rally attempt has its own lesson) and looks at how a trader can track deterioration in that uptrend one session at a time, using hypothetical index data throughout.
What counts as a distribution day
The idea comes from the growth-stock method associated with William O’Neil. A distribution day is a session in which a major market index closes lower than the previous session, by at least a minimum amount, on higher volume than that previous session. Both conditions are needed. A sharp decline on lighter volume doesn’t count, and neither does a heavy-volume session that closes up or barely moves.
Implementations disagree on the details. Some use a 0.2% minimum decline, others a different figure. Some count over 25 sessions, others over a calendar month. Some also remove a day once the index has closed a set percentage above it, often cited as 5%. This article uses one convention, written down here and applied without exception:
| Element | Convention used in this article |
|---|---|
| Price test | Index closes at least 0.20% below the previous close |
| Volume test | Volume higher than the previous session; if that session was a shortened holiday session, compare with the last full session instead |
| Counting window | A qualifying day counts for 25 sessions, including its own, then leaves the count |
| Other removal rules | None, so the window is the only way a day stops counting |
Changing any of these settings changes the count. A session down 0.18% on higher volume qualifies under some versions and fails this one. That’s why the convention has to be fixed before you start counting.
What a lower close on heavier turnover can and can’t tell you
The reasoning behind the count is plausible. If an index slips while turnover rises, more shares changed hands on a day when prices gave ground, and that can reflect large holders selling into the market. Repeated sessions of that kind suggest supply is meeting the advance more often.
The data can’t confirm that story. Every share sold on a distribution day was also bought by someone, so aggregate index volume doesn’t identify who sold, why, or whether the buyers were stronger hands. A rise in turnover could come from hedging, index rebalancing, option expiration or a single large sector moving the totals. A qualifying session also says nothing about the next session. Treat it as an observation about one day’s price and volume, which the count turns into a running measure of pressure.
That distinction matters for the rest of the method. One distribution day is a data point. A cluster of them developing over a few weeks is the pattern the method is built to notice.
Counting a distribution day session by session
The worked example follows a hypothetical index from a close of 5,000.00 (session 0) through 35 sessions after the uptrend was confirmed. Over the first 18 sessions the index rises 4.25% to 5,212.26. It reaches its highest close, 5,218.47, at session 21, and spends the rest of the period between 5,164.07 and that peak.
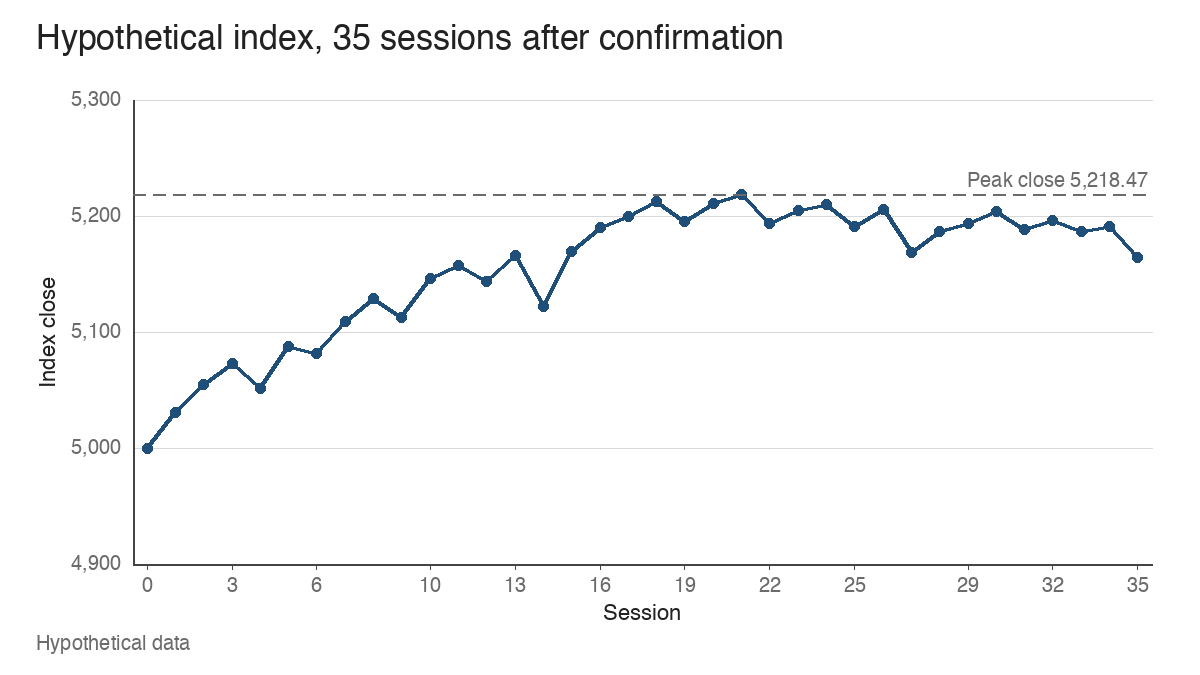
The table lists every session that either declined or changed the count. Sessions not shown closed higher and leave the count unchanged.
| Session | Close | Change | Volume vs comparison session | Status | Running count |
|---|---|---|---|---|---|
| 4 | 5,051.53 | -0.42% | +8.8% | Qualifies | 1 |
| 6 | 5,081.30 | -0.12% | +2.7% | Decline under 0.20% | 1 |
| 9 | 5,112.77 | -0.31% | +5.7% | Qualifies | 2 |
| 12 | 5,143.40 | -0.27% | -4.8% (vs session 10) | Lighter volume | 2 |
| 14 | 5,122.12 | -0.85% | -3.3% | Lighter volume | 2 |
| 19 | 5,195.06 | -0.33% | +57.0% | Qualifies (expiration day) | 3 |
| 22 | 5,193.42 | -0.48% | +8.9% | Qualifies | 4 |
| 25 | 5,191.29 | -0.36% | +6.0% | Qualifies | 5 |
| 27 | 5,168.87 | -0.71% | +10.6% | Qualifies | 6 |
| 29 | 5,193.18 | +0.12% | n/a | Session 4 leaves the window | 5 |
| 31 | 5,188.48 | -0.29% | +5.3% | Qualifies | 6 |
| 33 | 5,186.39 | -0.18% | -1.9% | Fails both tests | 6 |
| 34 | 5,191.06 | +0.09% | n/a | Session 9 leaves the window | 5 |
| 35 | 5,164.07 | -0.52% | -0.4% | Lighter volume | 5 |
Two of the larger declines don’t count. Session 14 falls 0.85%, the biggest drop in the sample, on volume 3.3% lighter than session 13. Session 35 falls 0.52% on volume just 0.4% below session 34. Under this convention, a big down day on quieter trade is a different observation, however uncomfortable it looks on the chart.
The more useful reading comes from where the qualifying days sit. Two arrive during the advance, at sessions 4 and 9, with plenty of rising closes between them. The other five arrive from session 19 to session 31, while the index stops making progress: from session 18 to session 35 it loses 0.92%. Five qualifying days in 17 sessions of flat to lower prices describes a different market from two scattered days in a steady climb, even though each session passed the same two tests.
Why the count has to forget
If every qualifying day counted forever, any long uptrend would eventually show a large total, simply because it had lasted a long time. A count of 12 accumulated over a year says almost nothing about the last month. The window keeps the count focused on recent pressure.
In the example, session 4 counts for 25 sessions, sessions 4 through 28, and leaves the count at session 29. The count falls from 6 to 5 on a day the index closes up 0.12%. Session 9 leaves at session 34 the same way. Neither drop reflects anything the market did that day; the observations aged out.
This has two practical consequences. A falling count can reflect expiring observations, so a decline from 6 to 5 shouldn’t be read as the market healing. And the same index history produces different counts under different windows: a version that also removed days once the index rallied 5% above them would treat an early, since-surpassed distribution day differently from this one. That’s one more reason to state the rule and keep it.
Same distribution day count, different market
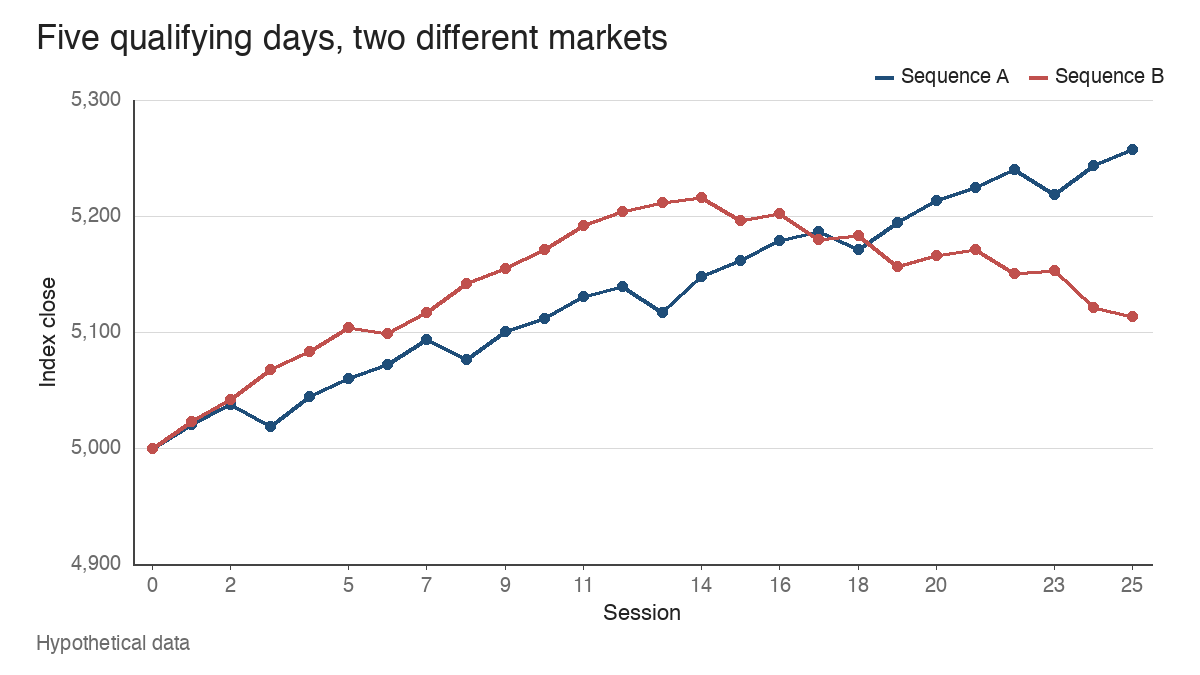
A total by itself hides most of the information. Here are two further hypothetical sequences, each starting at 5,000.00 and each showing five qualifying days within 25 sessions under the same rules.
| Measure | Sequence A | Sequence B |
|---|---|---|
| Qualifying days in 25 sessions | 5 (sessions 3, 8, 13, 18, 23) | 5 (sessions 15, 17, 19, 22, 24) |
| Sessions from first to last qualifying day | 21 | 10 |
| Index change, session 0 to 25 | +5.14% | +2.27% |
| Change from the close before the first qualifying day | +4.36% (from 5,037.57) | -1.96% (from 5,215.62) |
| New closing high after each qualifying day | Yes, the next session, all five times | No close above session 14’s 5,215.62 |
| Session 25 close vs assumed 50-day average | 5,257.04, 3.38% above 5,085.00 | 5,113.58, 0.22% below 5,125.00 |
The 50-day averages are assumed inputs for the illustration. Everything else is computed from the sequences.
In Sequence A, each qualifying day is absorbed. The index sets a new closing high the session after every one of them and finishes at its highest close of the period, well above its 50-day average. Sequence B packs its five days into 10 sessions, all of them after the high at session 14, while the index drifts 1.96% lower and slips under its average. I’d treat B’s count as the meaningful warning and A’s as routine selling inside an orderly advance.
That’s the interpretive point the bare count misses. Repeated pressure while price progress stalls suggests that supply is stopping the advance. Isolated declines inside a rising trend show the advance continuing through some selling, which healthy trends do.
Calendar events and inconsistent volume data
Session 19 in the main example is a quarterly expiration day. Volume runs 57.0% above session 18 because of contract expiries and index-related trading, and the index happens to close 0.33% lower. The convention counts it, and this article keeps it in the count because the rule was fixed in advance. A trader reading the count might still note that the extra turnover had a mechanical source, and weigh that session less than session 27, which fell 0.71% on 10.6% more volume during an ordinary week.
Holiday sessions create the opposite problem. Session 11 is a half-day with 2.10 billion shares traded. Session 12 then falls 0.27% on 4.95 billion. Compared with the half-day, volume looks 135.7% higher and the day would qualify. Compared with session 10, the last full session, volume is 4.8% lower and it doesn’t. The convention in this article settles that in advance; without such a rule, the count picks up a distribution day that came from the calendar.
Data source matters as well. Consolidated volume and primary-exchange volume can differ, and preliminary figures are sometimes revised after the close. A count built on one source and checked against another will disagree on borderline sessions. Use one source and one index for the whole count.
Index counts beside leaders, breakouts and breadth
The distribution day count measures one thing: price and volume on an index. Other evidence measures different things, and it’s clearer to keep them as separate readings than to fold them into one score.
- Leading stocks. Whether the strongest growth names are holding their breakouts, or starting to break support on heavy volume, is a stock-level observation. The lesson on how leading stocks reflect market context covers how to read it.
- Breakout follow-through. Whether new breakouts carry on or fail within days is a third reading, drawn from many individual charts.
- Breadth. The advance-decline line shows whether participation is widening or narrowing, and new highs and new lows show whether more stocks are reaching new extremes on the upside or the downside.
These readings can disagree. A count like Sequence B’s alongside leaders still holding breakouts and an advance-decline line at a new high is a mixed picture. The same count while leaders break down and new lows expand is a consistent one. The count doesn’t explain the other measures, and they don’t validate the count. Agreement between independent measures carries more weight than any one of them.
Exposure as a framework, not a command
In the method, a rising count is one input into how much market exposure a trader carries. The general framework is graduated: as warnings accumulate and other evidence weakens, a trader using this method might become more selective with new purchases, hold tighter to existing sell rules, or reduce how much capital is committed to new positions. As the evidence improves, the reverse.
The count doesn’t set an allocation, and it isn’t a trigger. Five distribution days doesn’t mean any particular percentage of capital should be in or out of the market; in Sequence A, five qualifying days sat inside a 5.14% advance. The threshold that prompts attention, and the response to it, belong to the trader’s own written plan, checked against the other readings above.
Where a distribution day count stops being useful
The count has real limits, and they show up often enough to plan around.
Warnings reverse. A cluster can build, the index can hold its 50-day average, and the qualifying days can age out one by one while the uptrend resumes. A trader who treated the fifth day as a sell signal would have been early or simply wrong.
Sharp declines don’t always build up first. A market can drop hard on news with little preceding distribution, in which case the count is low at the moment it would have mattered most. And a qualifying day, or any fixed number of them, doesn’t establish that a top has occurred. A top is only identifiable afterward, from what prices did next.
What the count does well is narrower. It records, under a rule set fixed in advance, how often the index has given ground on rising turnover recently, and it makes the trader look at where those sessions fell. Read alongside price progress, leaders and breadth, it’s a disciplined way to notice an uptrend losing support before the chart makes it obvious.
Learn the pattern. Ride the trend. Keep the gains.
Educational content only. Not investment advice. Trading involves risk. You are responsible for your decisions.
Get the free Market Wisdom e-book
Join Trends and Breakouts — historical winners, breakout studies, and risk lessons. No spam, unsubscribe anytime.