50-Day Moving Average Reclaim: What the Next Closes Show

Two hypothetical index charts end the same way. After a 7.15% slide from a closing high of 4,780 to a closing low of 4,438, each rebounds and, on day 52,…

Comments Off on 50-Day Moving Average Reclaim: What the Next Closes Show
Read more about the article PACB +559%: a post-crash base breakout in genomics, August 2020
PACB on the 2020-08-07 breakout entry, from my chart archive

PACB +559%: a post-crash base breakout in genomics, August 2020

On 7 August 2020, Pacific Biosciences opened at $4.26, two cents above its July high, and closed at $4.73, up 15.9% on volume 5.9 times its 20-day average. Seven months…

Comments Off on PACB +559%: a post-crash base breakout in genomics, August 2020
Read more about the article WKHS +595%: a base breakout in the 2020 EV rush, June 2020
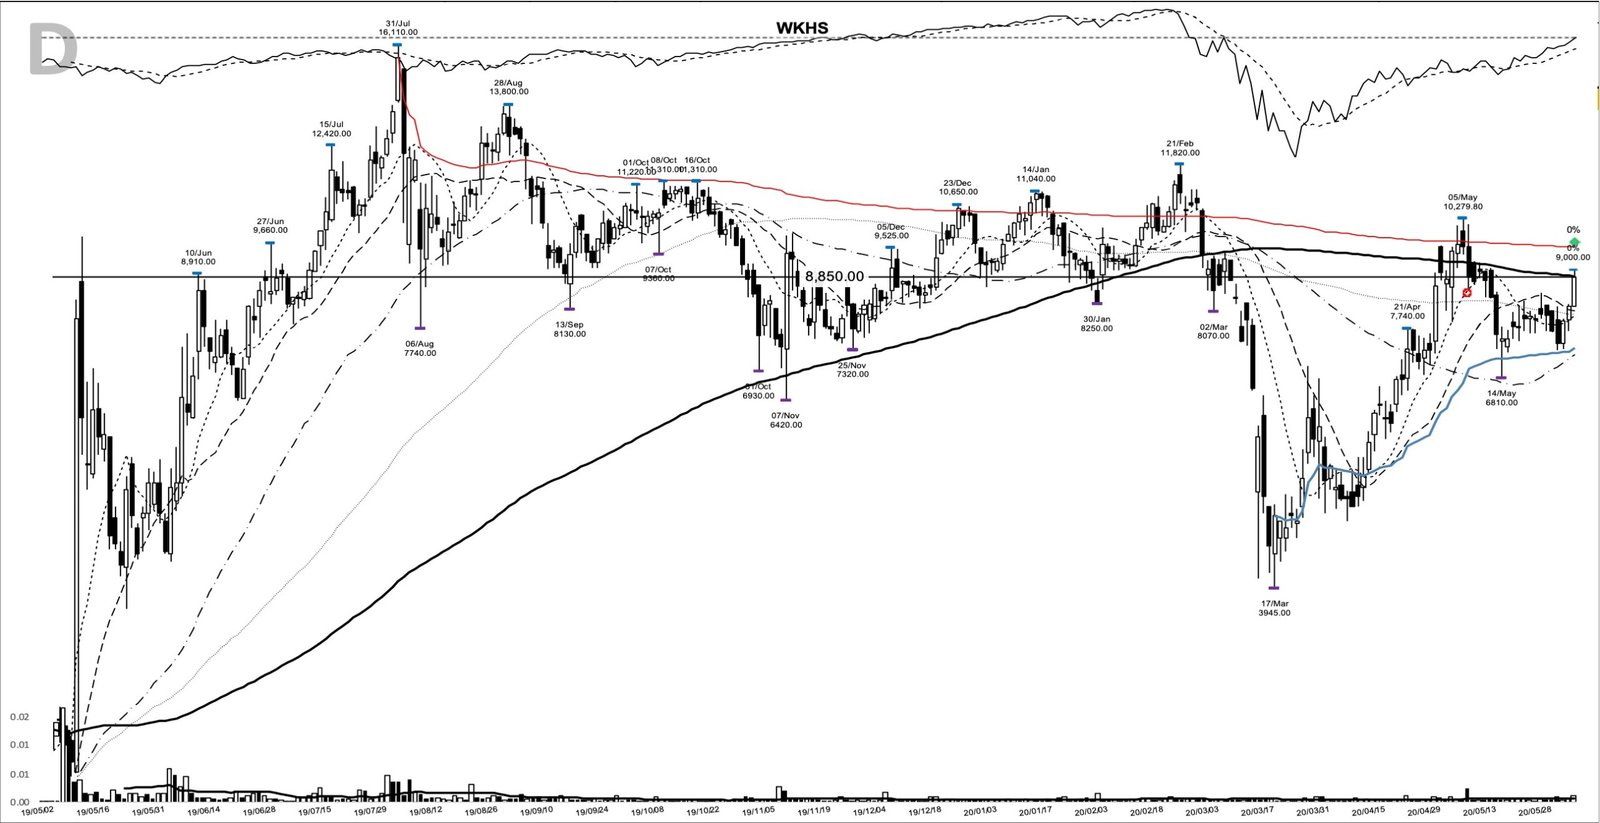
WKHS on the 2020-06-03 breakout entry, from my chart archive

WKHS +595%: a base breakout in the 2020 EV rush, June 2020

On 3 June 2020, Workhorse Group opened at $2.73, its prior close, and finished at $2.95, up 8.1% on volume 1.9 times its 20-day average. The stock was still 13.9%…

Comments Off on WKHS +595%: a base breakout in the 2020 EV rush, June 2020

Power Trend: How Sustained Index Strength Is Classified

An index climbs 8.54% over fourteen sessions of a recovery. The 21-day exponential moving average has just crossed above the 50-day simple moving average, the last eight daily lows sit…

Comments Off on Power Trend: How Sustained Index Strength Is Classified

Index Extension Above the 50-Day Moving Average Explained

A base breakout clears its pivot on heavy volume, and the setup on the stock's own chart looks clean. The benchmark index closed at 4,780 that same day, with its…

Comments Off on Index Extension Above the 50-Day Moving Average Explained