
Two hypothetical index charts end the same way. After a 7.15% slide from a closing high of 4,780 to a closing low of 4,438, each rebounds and, on day 52, closes at 4,641. The 50-day simple moving average that day sits at 4,630.2, so both charts have just closed above it. On the close alone you can’t tell them apart. Eight sessions later, one index is at 4,716 and has cleared its last swing high, while the other is at 4,543 and back below the line. This guide uses that pair to show what a 50-day moving average reclaim actually tells you, and which later closes carry the information the first one can’t.
The two sequences are hypothetical, built for teaching, and every derived figure below was computed from their closes.
Intraday poke, close above, and hold
Three separate events get called a reclaim, and they carry very different weight.
The first is an intraday move above the line. On day 51 the hypothetical index trades up to 4,636, above that day’s 50-day average of 4,631.8, then closes at 4,609. For a few hours the index was above the average. By the close, sellers had pushed it 0.49% back below. A trader watching the screen at midday might have called it a reclaim, and the daily chart records something else: a failed test.
The second is a close above the line. Day 52 opens at 4,609, dips to 4,595, rallies to 4,655 and closes at 4,641, which is 0.23% above the 4,630.2 average. That’s the event most people mean by a reclaim, and it’s the point where both of our sequences are identical.
The third is the hold, and it only exists in hindsight. It’s the run of closes after day 52 that either keeps price above the line or gives it back. A single close 0.23% above a falling average is a small margin, about 11 index points. One ordinary down day erases it.
Why the line still slopes down after a 50-day moving average reclaim
A common misread is that crossing the average turns it upward. The arithmetic says otherwise. Each day a simple moving average adds the newest close and drops the close from 50 sessions earlier, so its daily change equals (new close minus dropped close) divided by 50.
On day 52 the new close is 4,641 and the dropped close, from day 2, is 4,720. The average falls by (4,641 minus 4,720) / 50 = 1.6 points, even on the day price closes above it. In Sequence A, eight sessions later, day 60 adds 4,716 and drops day 10’s 4,757, so the line is still falling, by 0.8 points. The slope only turns up once new closes beat the closes rolling off. Here those are the topping-area closes from days 11 to 14, which run between 4,764 and 4,780. Until the index trades in that zone, the line keeps drifting lower however well the rebound behaves.
So a falling average under a fresh close is the normal state of a reclaim. The slope worth tracking is the rate. In Sequence A the 1-day decline shrinks from 2.1 points on day 55 to 0.8 points on day 60. In Sequence B it grows from 2.7 to 4.3 points over the same stretch.
The swing high overhead
The reclaim on day 52 doesn’t happen in open air. On day 32, during the decline, the index staged a counter-rally that closed at 4,693 and reached an intraday high of 4,704 before rolling over to the 4,438 low on day 42. That high hasn’t been taken out. On day 52, it sits 1.36% above the reclaim close.
This matters because the two levels answer different questions. The average is a summary of the last 50 closes. The swing high is a specific place where a rally already failed once, and where buyers who chased that rally are still holding at a loss. A close above the 50-day line with an unresolved high 63 points overhead means the index has recovered its average while the most recent test of supply still stands. An index can reclaim the line and fail at the high, and the reverse ordering is just as possible.
Sequence A: the pullback that holds
Here’s how the closes after day 52 unfold in the first sequence, revealed in stages.
Days 53 to 55. The index eases to 4,636, then 4,630, then 4,637. The day 54 low of 4,625 dips 1.4 points under that day’s average of 4,626.4, yet every close stays above the line, the smallest margin being 0.08% on day 54. The pullback from the day 52 high of 4,655 to the 4,625 low measures 0.64%. That low also sits 30 points above the day 52 low of 4,595, which gives the chart its first higher low since the rebound began.
Days 56 to 57. Closes of 4,655 and 4,668 move the index 1.02% above the average. In this hypothetical, six growth leaders broke out during the rebound, and five of them still trade above their pivots as the index pulls back and turns up.
Days 58 to 60. The index closes at 4,684, then 4,703, then 4,716. Day 59 reaches 4,712 intraday, above the 4,704 swing high, but closes 1 point below it. Day 60 closes at 4,716, the first close above that high.
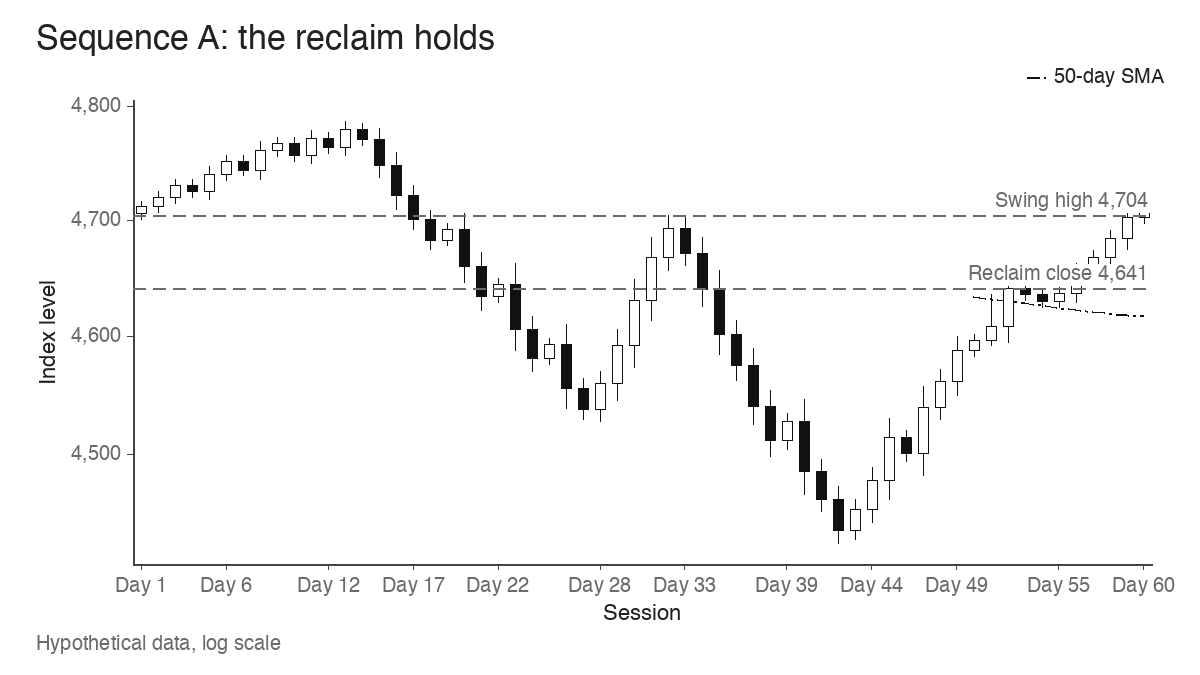
Notice what changed and what didn’t. Price is now 2.14% above the average, the old high is resolved on a closing basis, and leaders are working. The average itself is still falling.
Sequence B: the close back below
The second sequence starts from the same day 52 bar.
Day 53. The index trades up to 4,657, 2 points above the day 52 high, then reverses to close at 4,605, 0.49% under the 4,627.7 average. One session after the reclaim, the close is back below the line, with a low of 4,589.
Days 54 to 57. A close of 4,589 on day 54 is followed by a rebound attempt: 4,603, then 4,616 on day 56, when the high of 4,622 pokes above the 4,619.5 average intraday. The close stays 3.5 points below it. Day 57 closes at 4,610. That rebound stalled below both the day 52 close and the line, never getting near the 4,704 high.
Days 58 to 60. Closes of 4,581, 4,556 and 4,543. The index has given back 2.11% from the reclaim close. Four of the six recent breakouts have slipped back below their pivots into their bases, and the 1-day decline in the average has grown to 4.3 points.
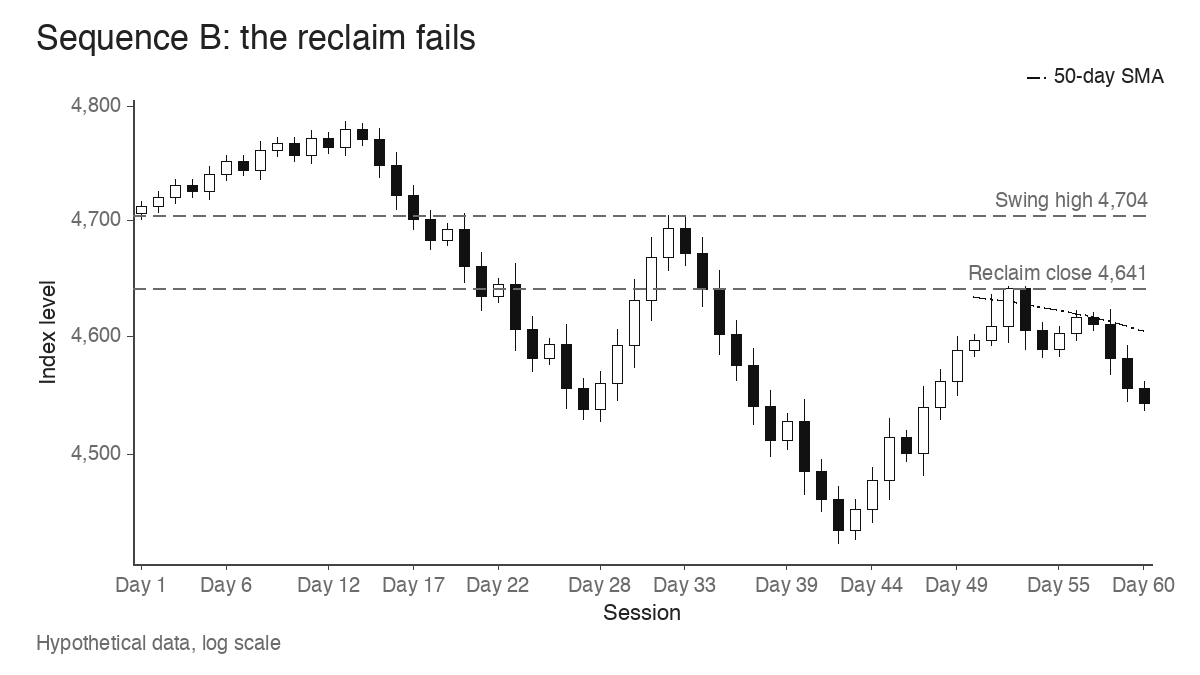
Here the higher low never forms, the rebound fails beneath the line, and the leaders lose their pivots. A failed breakout in a stock and a failed reclaim in an index tend to look alike on the chart: a fast return into the prior range, then weak follow-up.
What to record at each close
The difference between the two charts shows up in a few observations that take less than a minute to write down after each session. A reader who logs the same items every day ends up with a record that’s comparable across rebounds.
| Observation | How to measure it | Sequence A, day 57 | Sequence B, day 57 |
|---|---|---|---|
| Close versus the 50-day average | (close minus average) / average | +1.02% | -0.15% |
| Slope of the average | Today’s average minus yesterday’s | -1.5 points | -2.7 points |
| Nearest prior swing high | Distance from close to the last unresolved high | 36 points below 4,704 | 94 points below 4,704 |
| Pullback low versus prior low | Did the latest dip stop above the last one? | 4,625, above 4,595 | 4,582, below 4,595 |
| Recent breakouts | How many still trade above their pivots | 5 of 6 | Slipping, 4 of 6 below by day 60 |
None of these rows tells you to act on its own. Together they describe whether the rebound is building on the reclaim or living off it. The breakout row ties back to how leading stocks behave in their market context, since an index rebound tends to carry more weight when the stocks that led it keep working.
Where the reclaim fits with confirmation and extension
The reclaim answers one narrow question: is price back above its recent average, and is it staying there? Two related questions need their own tools.
Rally confirmation has separate price and volume criteria. The follow-through day, from the market-timing work of William O’Neil, looks for a strong up day on higher volume several sessions into a rally attempt, and it can arrive above or below the 50-day line. A reclaim without a follow-through day leaves the rally unconfirmed by that standard, and a follow-through day below the line leaves the reclaim still to come. The two signals are independent, so it helps to log them in separate columns.
Once price is above the line, the next question becomes distance. Sequence A finishes 2.14% above its average. That’s modest. As a rally runs, the gap widens, and the index extension above the 50-day moving average becomes the number that matters. The reclaim covers the crossing. Extension covers how far price has travelled since.
A lagging line in a choppy tape
The 50-day average is built from closes that are up to ten weeks old, so it lags by design. That creates two limits worth keeping in view.
Choppy markets produce repeated crossings. In a sideways range the index can close above and below a flat average several times in a month, and each crossing looks like the day 52 bar in isolation. Sequence B shows a mild version: a close above on day 52, a close below on day 53, an intraday poke above on day 56. Counting crossings tells you little in that environment. Holding closes, higher lows and an unresolved high still carry information.
Leadership can also turn before the index does. Growth leaders often build bases and break out while the index is still under its average, because the index weights the largest stocks and the newest leaders are often smaller. A trader waiting for a 50-day moving average reclaim before looking at individual charts may arrive after the strongest names have already moved. The index line is context for those charts, and it works as a check on them rather than a starting gun.
What separates the two hypothetical charts is everything after day 52: whether the next dip holds the line, whether the old high gives way, and whether the breakouts keep working. The reclaim close is where that record begins.
Learn the pattern. Ride the trend. Keep the gains.
Educational content only. Not investment advice. Trading involves risk. You are responsible for your decisions.
Get the free Market Wisdom e-book
Join Trends and Breakouts — historical winners, breakout studies, and risk lessons. No spam, unsubscribe anytime.