
Two hypothetical growth stocks sit a few points under their pivots after strong prior advances. Over the last ten sessions, Stock A has averaged 56.2% of its 50-day average volume and Stock B has averaged 59.8%. On a volume panel alone they look like twins. That’s the trap in reading volume dry-up: the quiet is the same on both bases, and the price action around it is where they part company.
This guide works through both bases, stops before either one resolves, and then shows what happened next. The aim is to make the question concrete. When trading goes quiet late in a base, what does the price structure have to look like for the quiet to mean anything?
What volume dry-up measures
Volume dry-up is a stretch of sessions where shares traded run well below the stock’s own recent norm while a base is still forming. The useful version is narrow. It applies to the final pullback or tight area near a potential pivot, in a stock that already has an established advance behind it. Light volume in the middle of a deep, sloppy correction is a different situation, and so is light volume in a stock that has never trended.
Everything depends on the baseline. Here it’s the 50-day average of full-session volume, which is the convention described in reading volume against a recent baseline. Stock A’s hypothetical 50-day average is 1,200,000 shares. Its final ten sessions traded between 610,000 and 780,000 shares, which is 50.8% to 65.0% of that figure. Stock B’s average is 900,000 shares, and its final ten sessions ran between 490,000 and 580,000, or 54.4% to 64.4%.
Read as a single number, the dry-up says only that fewer shares changed hands than usual. It doesn’t say who stopped trading or why. That limit shapes everything that follows.
Chart one: a shallow, orderly final pullback
Figure 1 shows Stock A, and its right side starts with a push from a 57.95 close to a session high of 61.80, which becomes the pivot. The first pullback from there reaches a low of 58.60, a 5.18% dip. Then the final ten sessions form a tight area with a lowest low of 59.40, only 3.88% below the pivot. Each pullback is shallower than the one before, and the daily ranges shrink with it: the first ten sessions averaged a range of 2.14% of the close, the final ten averaged 1.36%.
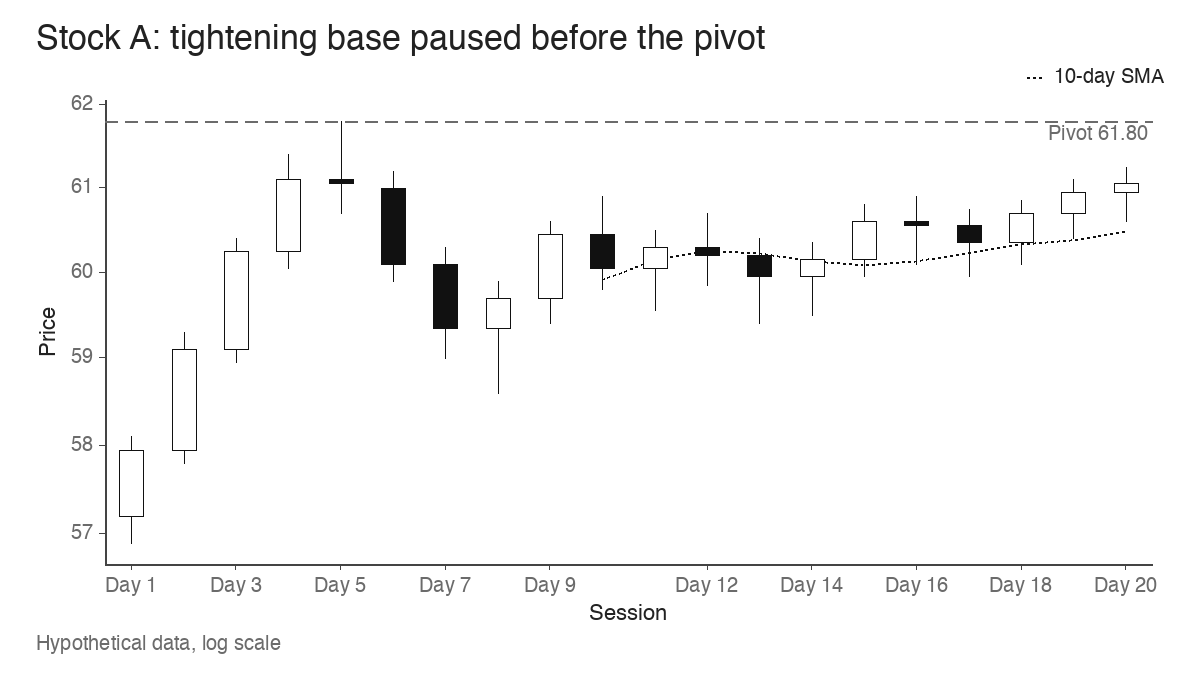
That narrowing is what the volatility contraction pattern describes, and the volume dry-up is happening inside it. The closes matter just as much. Using close location (where the close sits within the day’s range, from 0 at the low to 1 at the high), Stock A’s final ten sessions averaged 0.66. Only four of the nine session-to-session changes were lower closes, and the last close of 61.05 sits 1.21% under the pivot.
Light volume plus shallow dips, narrow ranges and closes held in the upper part of the range is consistent with fewer holders pressing to sell at lower prices. Supply looks thin near the highs. I’d describe that as an orderly base with quiet trading, and nothing more confident than that.
Chart two: the same quiet volume, a different structure
Stock B’s pivot is 48.60. Its final ten sessions open with a close at 47.90 and end with a close at 45.80, 5.76% under the pivot. The lowest low of the stretch is 45.70, 5.97% below the pivot, so this final pullback is deeper than Stock A’s and still getting deeper on the last day.
Six of nine closes were lower than the session before. The three rebounds tell the story more clearly than the declines do. Their highs were 47.95, then 47.25, then 46.70, so each bounce lost ground to the one before it. Close location averaged 0.30, with five sessions closing in the bottom fifth of the day’s range. Daily ranges averaged 1.65% of the close and never really contracted.
Plot each stock’s final ten sessions as a share of its own 50-day average and the two volume records are hard to tell apart. Every bar on both sides sits between 50% and 65%.
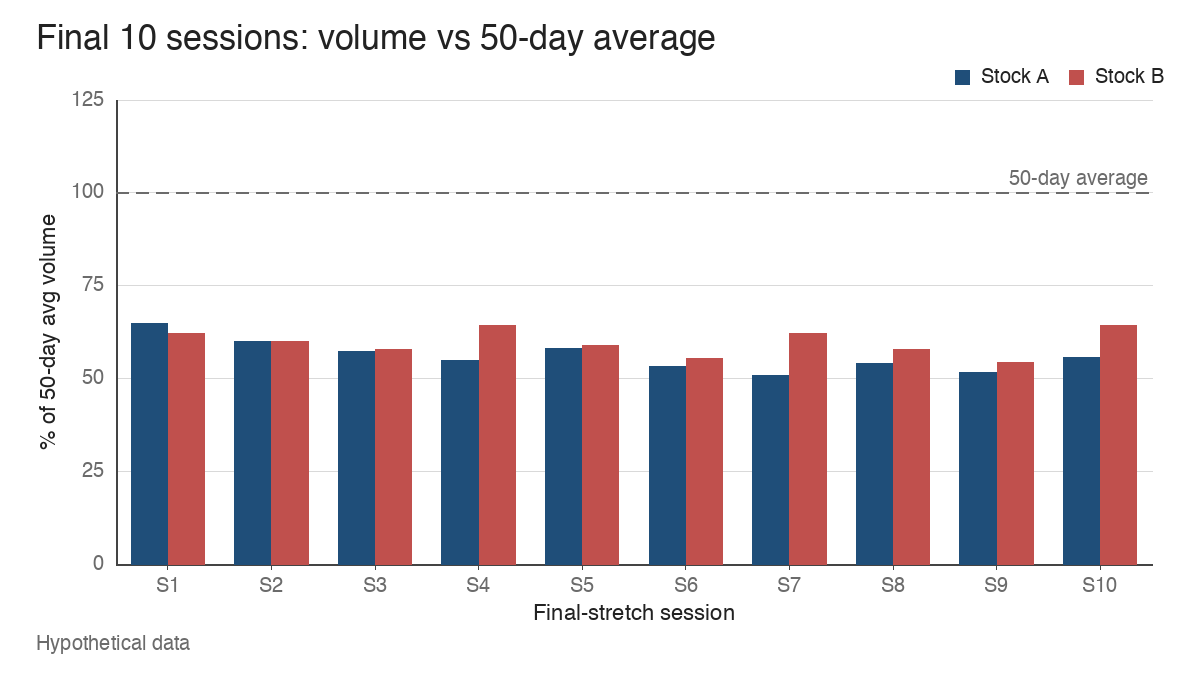
Volume on Stock B is as light as volume on Stock A. What it shows is drift: no one is selling hard, and no one is willing to pay up either. A common misread is to treat any low-volume pullback as constructive. Quiet selling that keeps closing near the lows is still selling, and the absence of heavy volume only tells you the decline is unhurried.
Paused before the pivot: what can you infer?
Freeze both bases on the tenth session. Neither has broken out. A trader using volume dry-up as a filter would see two candidates that pass the volume test. The difference sits in three places, and a side-by-side table makes it easier to read.
| Question | Stock A | Stock B |
|---|---|---|
| Average volume, final 10 sessions | 56.2% of 50-day average | 59.8% of 50-day average |
| Where is the pullback relative to the pivot? | Lowest low 3.88% below 61.80 | Lowest low 5.97% below 48.60, set on the last day |
| Are the ranges narrowing? | Yes, 2.14% to 1.36% average range | No, 1.65% average with no clear contraction |
| Where do the closes sit? | Close location 0.66, last close 61.05 | Close location 0.30, last close 45.80 |
| What do the rebounds do? | Hold near the top of the tight area | Lower highs at 47.95, 47.25 and 46.70 |
The fair inference at this point is limited. Stock A’s price and volume agree with each other: tight, quiet and holding up. Stock B’s volume is quiet, but its price is still leaking lower. Neither chart predicts a breakout. What the table supports is a ranking of which base looks more orderly going into a pivot test, and that’s all it supports.
What changed once price tested the pivot
Here is the reveal. On the next session, Stock A traded through 61.80, reached 63.40 and closed at 62.95, 1.86% above the pivot, on 2,280,000 shares. That’s 1.9 times its 50-day average, after ten sessions averaging 56.2%. The close location on the breakout day was 0.80. This is the shift that volume confirmation on breakout candles looks for: participation expands at the exact point where the quiet base meets its resistance.
Stock B rebounded for three sessions, then traded up to 48.95 on its attempt, 0.35 above the 48.60 pivot. It closed at 48.10, 0.50 back under the pivot, on 990,000 shares, which is 1.1 times average. Close location that day was 0.32. Two sessions later it closed at 46.85, 3.6% under the pivot. That sequence fits the shape of a failed breakout: price touched the level, participation barely rose, and the close gave the move back.
A real reference helps here. In the studied BXC cup with handle from 2021, the handle lasted 1.2 weeks, was 10.61% deep and averaged 0.43 times the baseline volume measured at the right rim. The breakout came on 2021-01-05 on 1.58 times average volume. The quiet stretch came first, and expansion at the pivot came after it. The dry-up alone didn’t settle anything.
When the comparison window misleads you
A dry-up ratio is only as good as the average underneath it. Three situations distort it often enough to check every time.
Shortened sessions. A half-day session before a holiday can print 430,000 shares in a stock that normally trades 1,000,000. That’s 0.43 times the average, and it reflects the calendar. A trader reading dry-up could exclude half-days from the window or flag them on the chart, so one short session doesn’t pass for a signal.
Thin ordinary trading. In a hypothetical stock whose last ten sessions traded 42,000, 95,000, 38,000, 61,000, 120,000, 33,000, 57,000, 49,000, 88,000 and 40,000 shares, the average is 62,300. The quietest day runs 0.53 times that average and the busiest runs 1.93 times. With swings that wide, a day at half the average is just a normal day, and the coefficient of variation of 0.44 says as much. Dry-up readings mean more in names where daily volume is steady enough for a quiet stretch to stand out.
A volume spike in the window. Take 49 sessions at 1,000,000 shares and one earnings session at 9,000,000. The 50-day average jumps to 1,160,000. A 600,000-share day then reads as 51.7% of average, where the clean window would show 60.0%. The spike makes ordinary trading look drier than it is. Checking the median, which stays at 1,000,000, or leaving the spike day out of the baseline, keeps the ratio honest.
Each of these produces a low ratio without any change in how holders are behaving. The number on the volume panel is mechanical, so it needs a quick sanity check before it carries any weight.
Volume dry-up records activity and leaves intent open
Session volume counts shares that changed hands. It can’t tell you whether sellers are exhausted, whether buyers are waiting, or whether everyone simply went on holiday. Writers in the growth-stock tradition, from William O’Neil onward, treat light volume near the lows of a base as a sign that selling pressure is fading, and that inference is reasonable when price agrees. It stays an inference.
Stock A and Stock B are a useful pair because their outcomes match their structure, and real charts don’t always cooperate. A shallow, orderly base with steady closes and textbook dry-up can reach its pivot and find no one willing to pay more. The quiet only tells you where demand could show up most clearly. Whether it actually shows up is something the pivot session has to answer.
Learn the pattern. Ride the trend. Keep the gains.
Educational content only. Not investment advice. Trading involves risk. You are responsible for your decisions.
Get the free Market Wisdom e-book
Join Trends and Breakouts — historical winners, breakout studies, and risk lessons. No spam, unsubscribe anytime.