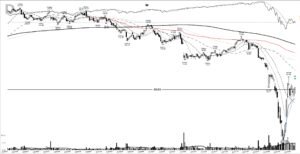
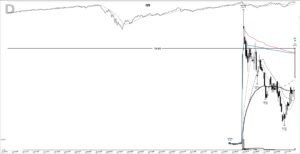
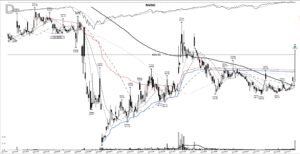
CZR is back on traders’ screens this week, ranked 91st on the ApeWisdom mention board, and when Caesars shows up there the CZR base breakout of May 2020 is the chart worth studying. On 18 May 2020 the stock, still listed as Eldorado Resorts at the time, opened at 25.46, never traded below that open, and closed at 27.80 above the 25.50 pivot. The short version: a May 2020 base breakout off a crash low that moved 259.9% from the entry close to the exit close across 396 calendar days.
Key takeaways from the CZR base breakout of May 2020
- The pattern: a crash-and-repair base, 91.5% deep from the 70.74 February high to the 6.02 March low, resolved by a close at 27.80 above the 25.50 pivot.
- The move: 259.9% from entry close to exit close in 396 calendar days, with a peak of 113.46 on 7 June 2021.
- Breakout volume ran 1.3 times the 20-day average, a modest reading. The heavy session came six days earlier, when the pivot was set.
- Four add-on points followed, starting with a 41.32 close on 14 August 2020.
- A mechanical 10-day trail was out at 33.255 on 11 June 2020. The trend kept going, and the add-on points were how a trend follower could get back in.
| Field | Value |
|---|---|
| Ticker | CZR (ERI until 21 July 2020) |
| Breakout date | 2020-05-18 |
| Breakout close | 27.80 |
| Volume vs 20-day average | 1.3x |
| Exit date | 2021-06-18 |
| Exit close | 100.06 |
| Price change, entry close to exit close | 259.9% |
| Calendar days | 396 |
| Peak before exit | 113.46 (2021-06-07) |
How the CZR base breakout formed under the 25.50 pivot
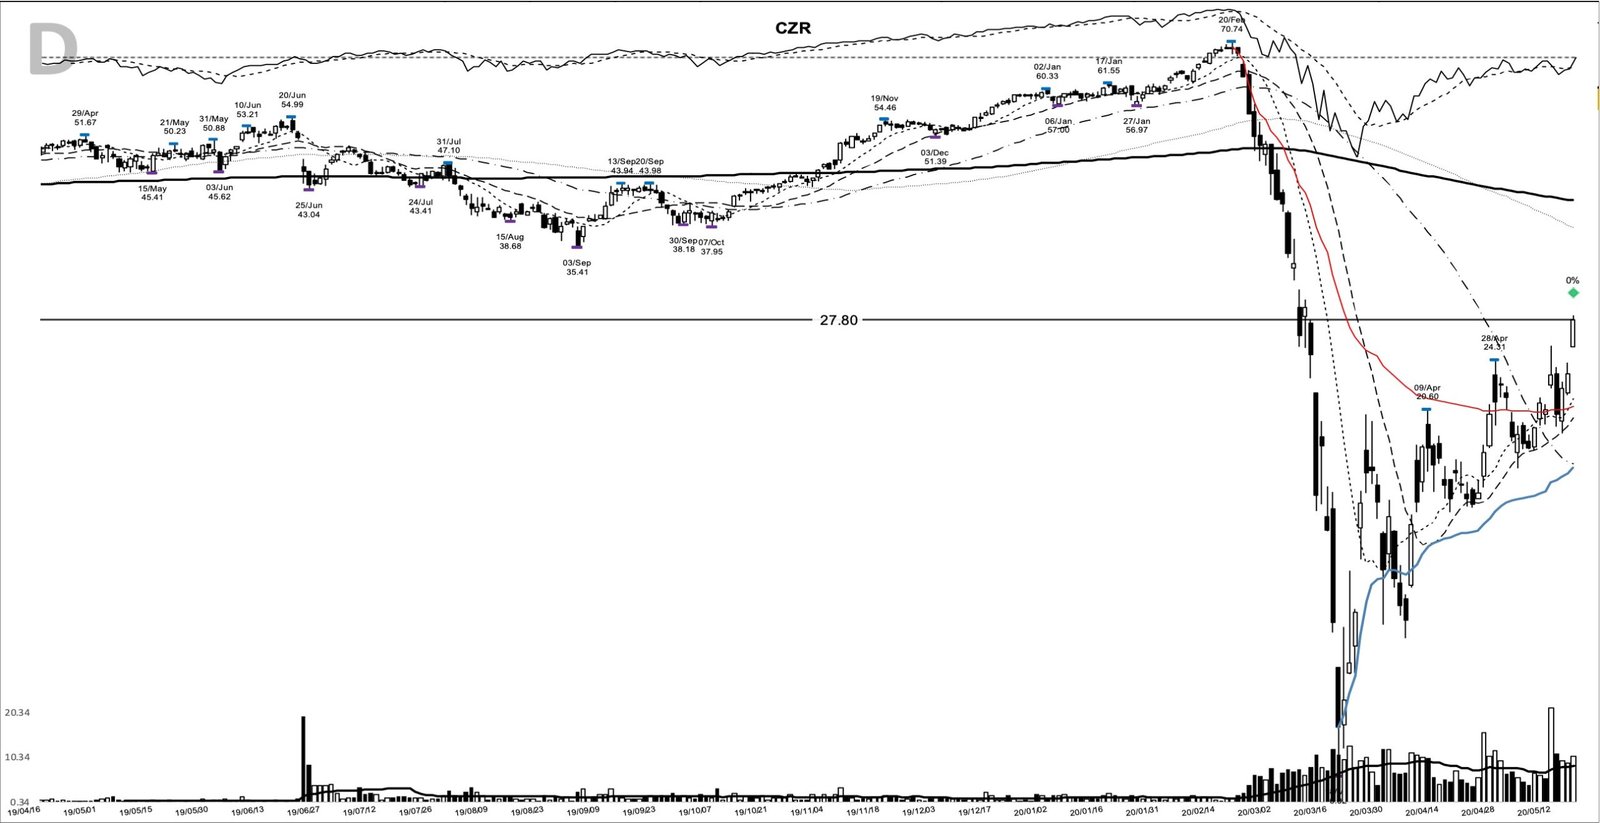
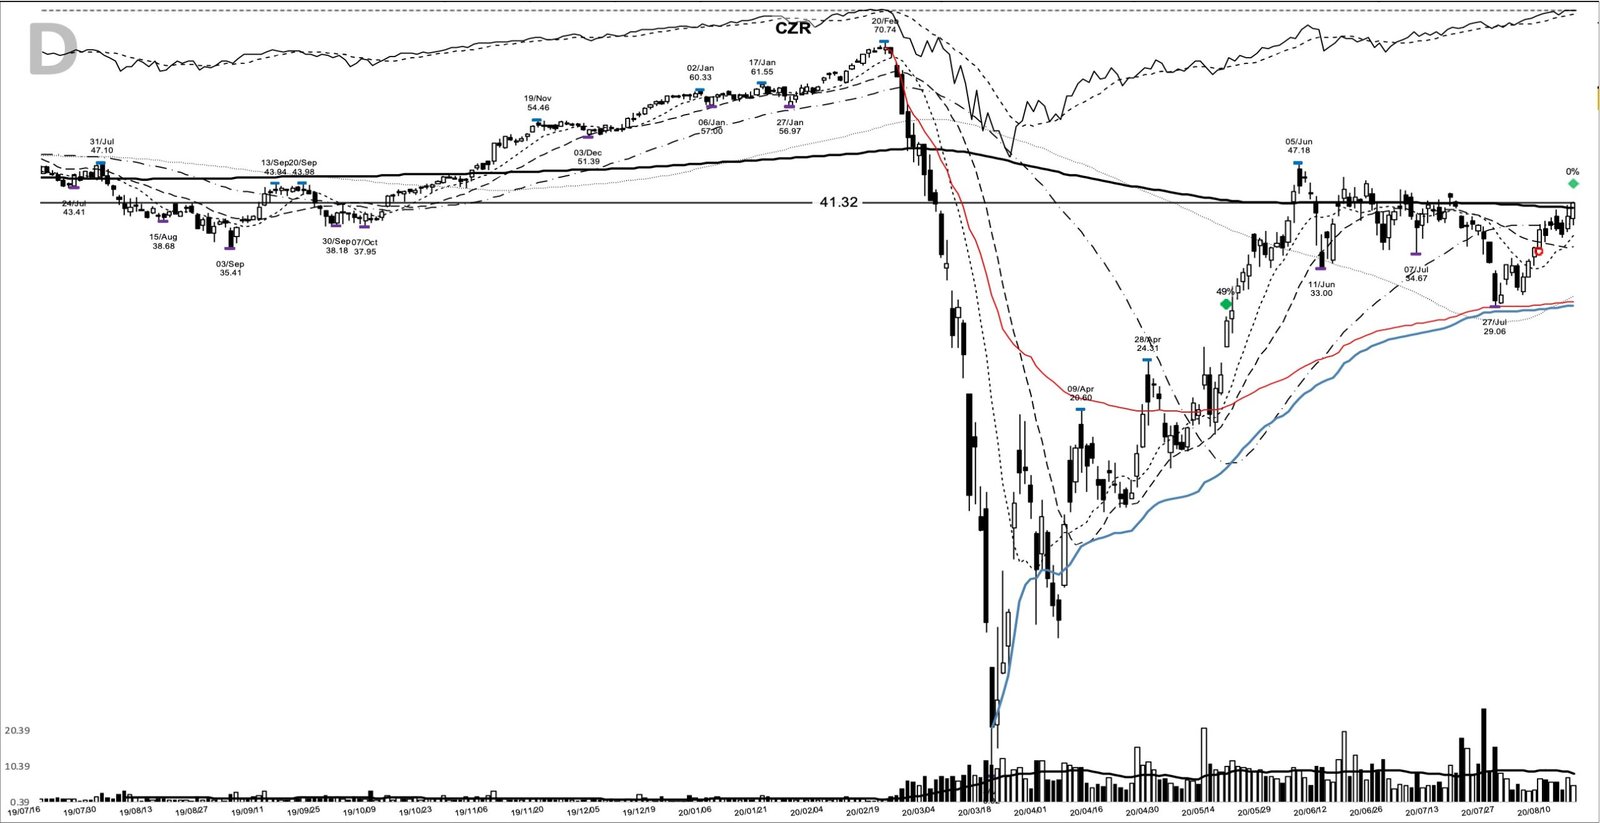
The charts in this piece come from my study archive, and the entry chart tells the whole repair story in one frame. From the 70.74 high on 20 February 2020 the stock fell to 6.02 on 18 March, a 91.5% collapse in under a month. The rebound was violent too: a 15.05 close on 24 March, a 20.60 high on 9 April, and a 24.31 high on 28 April before a pullback to a 16.91 low on 4 May.
Then came 12 May. Price reached 25.50 on 21,155,247 shares, the heaviest session in the base, and closed at 23.18. That intraday high became the pivot. The next two sessions tested the buyers, with a 19.48 low on 13 May and a 19.00 low on 14 May, before a 23.21 close on 15 May.
On 18 May the stock gapped to 25.46, ranged up to 28.24 and closed at 27.80. This was a confirmed breakout: the entry-day close of 27.80 cleared the 25.50 pivot on the day itself, finishing 9.0% above it. Volume ran 1.3 times the 20-day average. That’s ordinary participation, and the honest read is that the demand signal sat in the 12 May session.
The model-book fundamental frame doesn’t fit here at all. Quarterly EPS went from 0.49 in the first quarter of 2019 to -0.17 in the fourth quarter and -2.25 in the first quarter of 2020, per the SEC filings. Revenue had grown 36.1% year over year as late as the third quarter of 2019, then fell 11.9% and 25.6% in the two quarters into the entry. This was a turnaround chart with no earnings acceleration behind it.
Eldorado Resorts in May 2020: casinos shut, a merger pending
The company on this chart was Eldorado Resorts, a regional casino operator partway through buying Caesars Entertainment in a deal reported at about 17.3 billion dollars. Its first-quarter release on 11 May said every property had closed by 18 March under state mandates, with first-quarter net revenue of 473 million dollars, down 25.6% from a year earlier. Management said January and February had been strong before the closures.
Two threads ran through the weeks around the breakout. One was reopening: Louisiana let casinos resume at reduced capacity from 15 May, and Eldorado’s Nevada properties reopened on 4 June. The other was the merger, which as of the 11 May call still needed sign-off from the Federal Trade Commission and gaming regulators in Nevada, New Jersey and Indiana. The deal closed on 20 July 2020, the combined company took the Caesars Entertainment name, and the Nasdaq symbol changed from ERI to CZR on 21 July.
After the deal closed, the stock slid to a 29.06 low on 27 July before rebuilding, and by 14 August it closed at 41.32, 48.6% above the breakout close, with the first chance to add to the position.
A May 2020 tape that rewarded the reopening trade
The broad market had turned up well before this breakout. The Nasdaq Composite erased its 2020 losses on 7 May, led by large technology names and carried by bets on the economy reopening, and by early June it had closed above its prior record. For anyone who times exposure off the follow-through day signal, the sequence is the useful part: the index recovery came first, and this casino breakout arrived 11 days after the Nasdaq had erased its losses for the year.
Preparing for the 25.50 pivot: trend posture, shelf and plan
The trend posture was easy to read by the morning of 18 May. Price had closed above its 10-day moving average for 7 straight sessions, and the averages were stacked in order: 21.41 for the 10-day, 20.04 for the 20-day and 17.19 for the 50-day. The 12 May session put the stock on a watchlist by itself, the heaviest-volume push of the base, up to 25.50 and back below it by the close. That’s a level announcing itself.
The plan a trend follower could have written that day uses three anchors. Entry above the 25.50 pivot from 12 May. An initial stop below the 19.00 shelf low from 14 May, which sat 25.5% under the pivot. The base low at 6.02 from 18 March marked where the whole structure would fail, far too distant to use as a stop. After that, trail the 10-day moving average, widening to the 20-day once the stock was well advanced.
Price gapped through the pivot, so the entry close landed 9.0% above it, 29.8% above the 10-day line and 31.7% above the 19.00 shelf. That stop distance is the cost of a gap breakout in a stock that had already rallied 361.8% off its March low, and position size would have had to shrink to match it.
From 27.80 to the June 2021 exit
A trader using this pattern might have watched two things after the breakout: whether the 25.50 pivot held on pullbacks, and whether the 10-day line kept rising. The first leg ran to a 47.18 high on 5 June 2020. On 11 June the stock closed at 33.255, below both the 10-day and 20-day averages, and a strict moving-average trail would have ended the trade there.
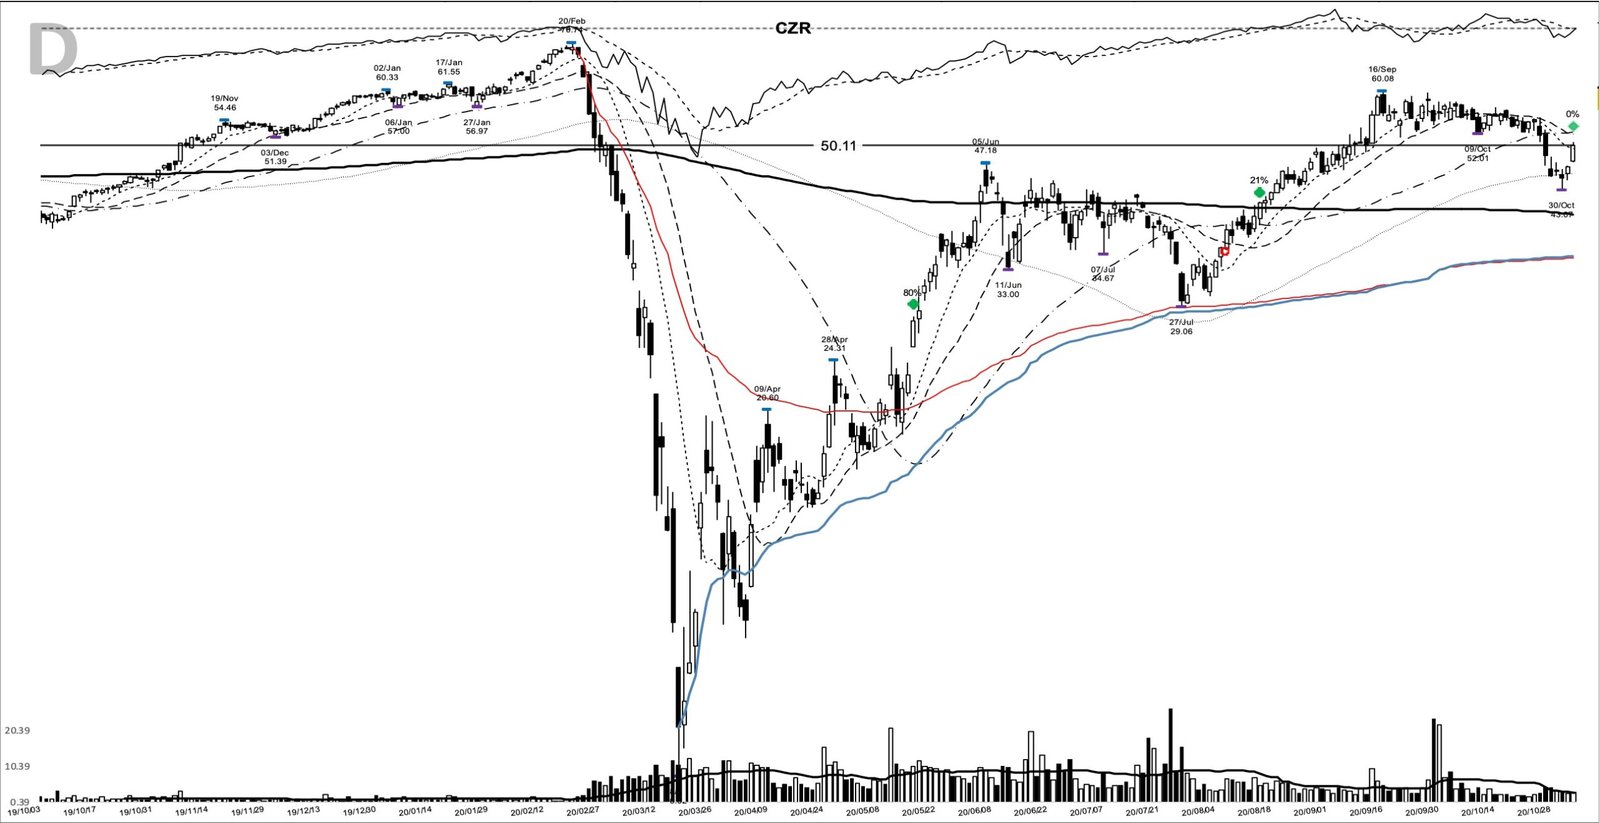
The bigger move came later. On 3 November 2020 a 50.11 close offered another add-on point, 80.3% above the first buy. Six days later, on 9 November, the Pfizer vaccine data sent casino stocks sharply higher, and this one reached a 74.92 high before closing at 63.08, up 10.9% from the 6 November close.
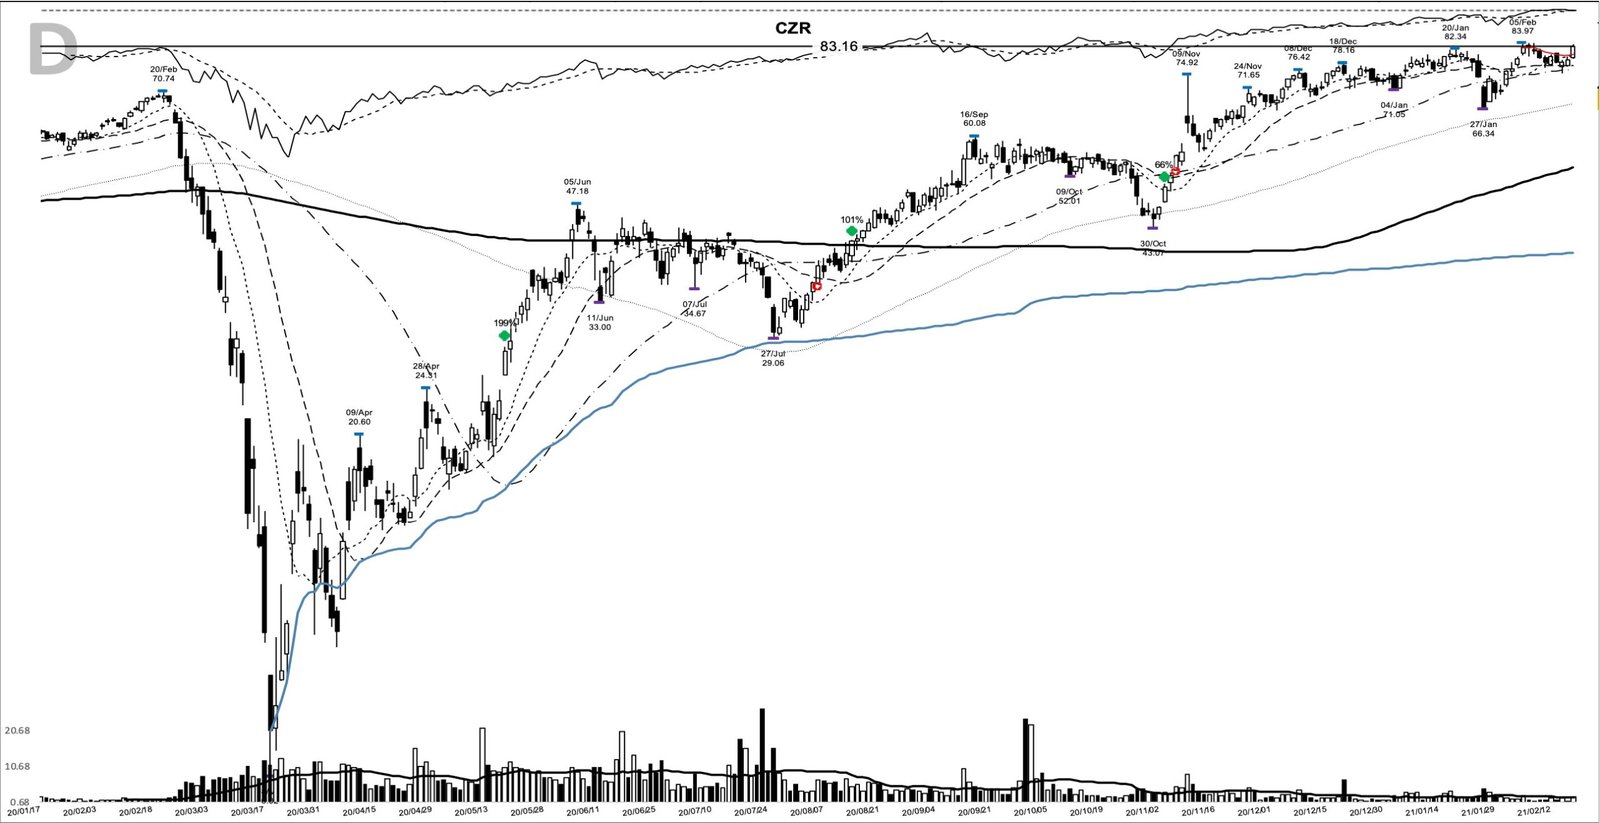
Two more add-on points followed in 2021: an 83.16 close on 19 February and an 88.94 close on 1 April. The first sell marker came on 12 May 2021 at a 92.41 close, after a slide from a 104.68 close on 10 May. Price recovered to the 113.46 peak on 7 June 2021, then faded into the 18 June exit at 100.06, 11.8% below that peak. A notional 1,000 dollars riding the full move from the first buy would have become about 3,600 dollars.
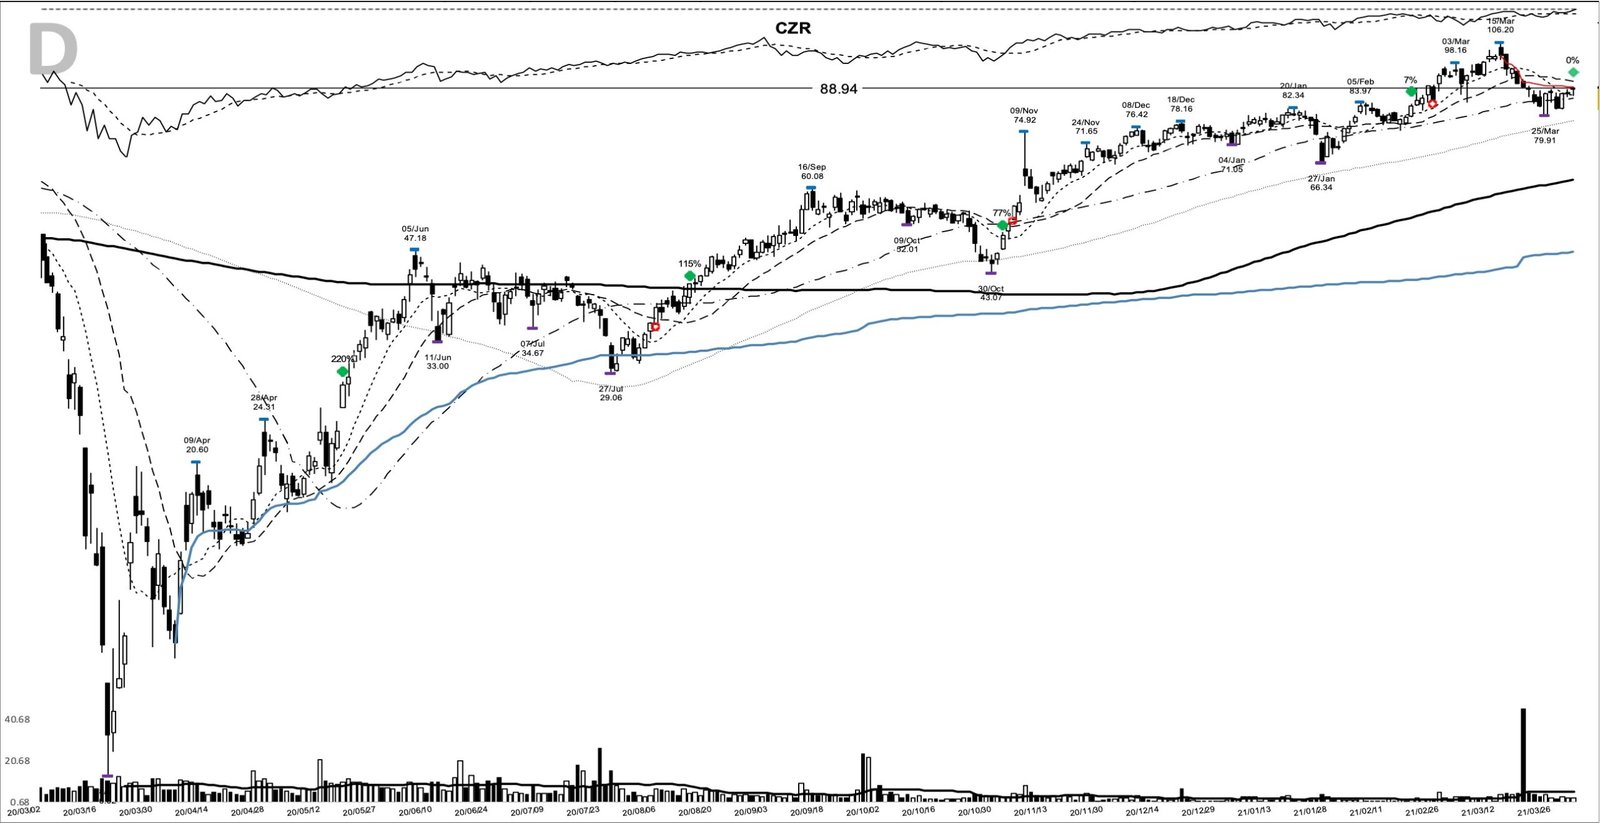
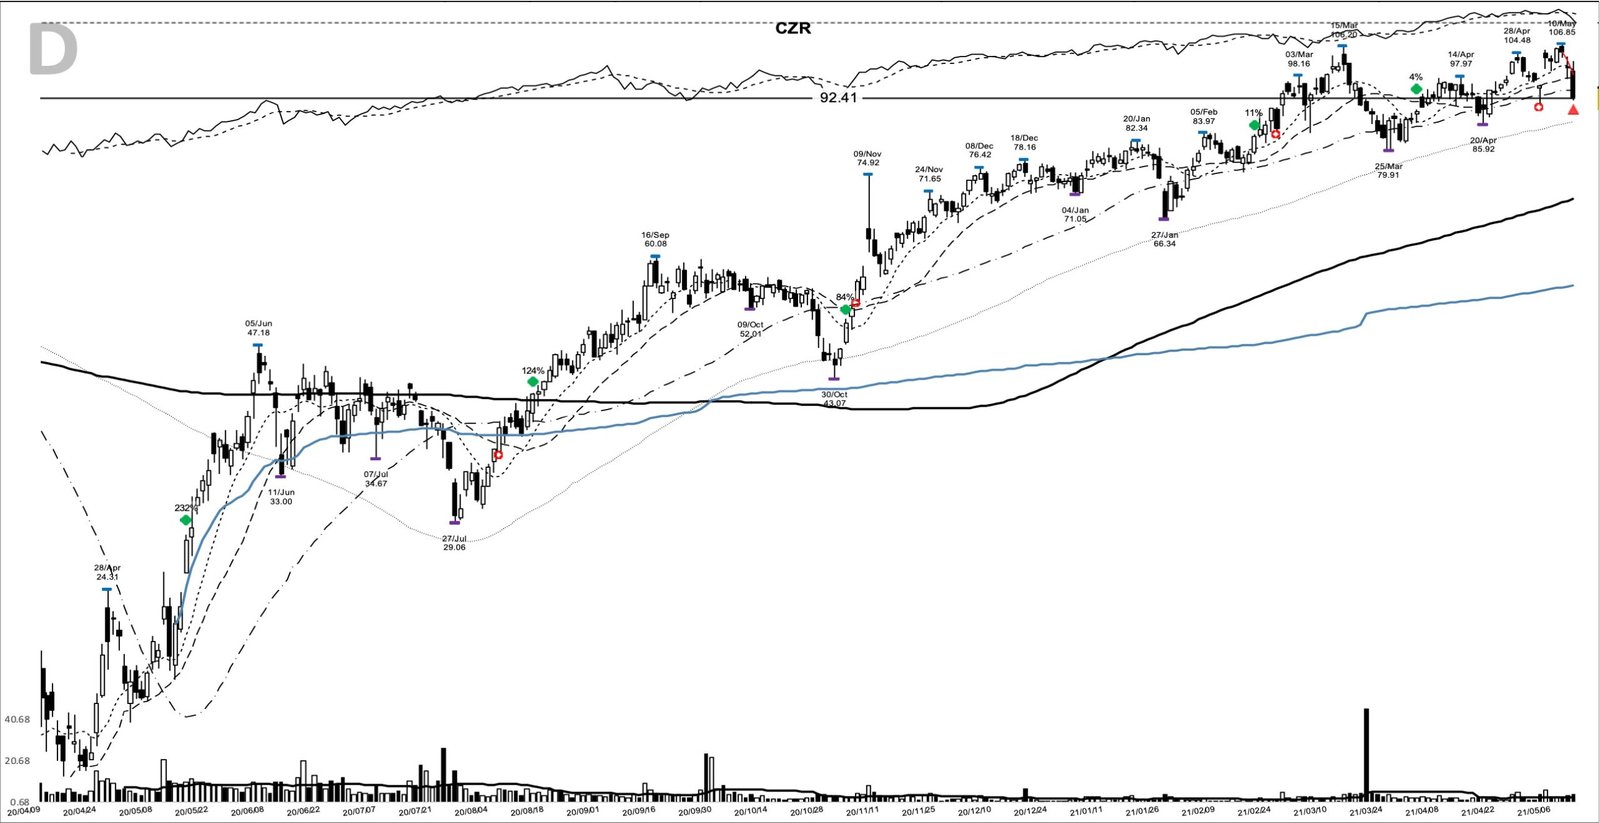
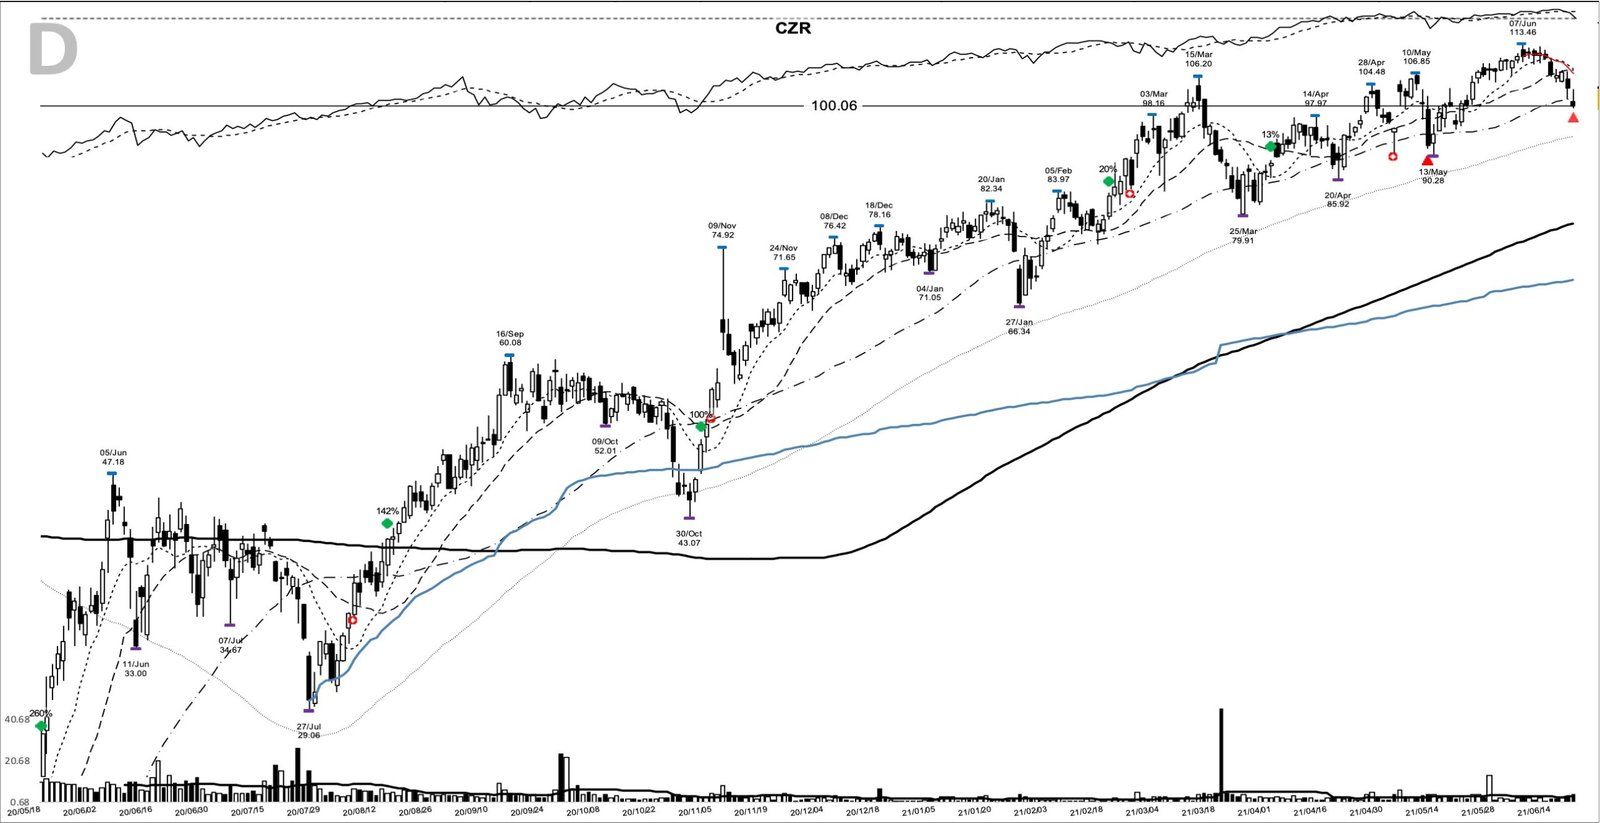
Adding on strength like this follows the logic of pyramiding into a position: each add came after the stock had proved the prior level.
Where the CZR chart could mislead a trader
The breakout volume is the first trap. At 1.3 times the 20-day average, the 18 May bar didn’t show unusual demand, and reading it as institutional confirmation would be inventing a signal. The heavy volume came on 12 May, and that session failed at the pivot, closing at 23.18.
The second trap is the fundamentals. William O’Neil’s model leaders paired base breakouts with accelerating earnings. Here EPS was negative and revenue was shrinking into the entry, so the chart was pricing reopening and the merger. A trader who assumed growth-stock behaviour would have been surprised by the 38.4% drop from the 47.18 June high to the 29.06 July low.
The breakout also didn’t promise a smooth trend. The first 10-day trail exit came 24 days after the entry, and the trend only resumed after a base that tested whether the post-merger company deserved its price.
The lesson of the 25.50 pivot
A high-volume failure at a level often sets the pivot that matters next. Here the 12 May rejection at 25.50 marked the line, the 18 May gap cleared it, and the add-on points through 2021 were the repeatable part of the trade. A trail that gets shaken out early is survivable when the plan includes a way back in.
Learn the pattern. Ride the trend. Keep the gains.
Related studies: CAR base breakout 2021; W base breakout April 2020; FUTU base breakout May 2020. A new winner study lands most evenings.
Price and volume figures are computed from split-adjusted daily OHLCV data; company figures come from SEC filings where cited.
Educational content only. Not investment advice. Trading involves risk. You are responsible for your decisions.
Get the free Market Wisdom e-book
Join Trends and Breakouts — historical winners, breakout studies, and risk lessons. No spam, unsubscribe anytime.