
Take a hypothetical growth stock that broke out of a base at 50.00 and climbed to 60.00 over 25 sessions, about five weeks of steady, unremarkable progress. Then the character changes. In the next seven sessions it runs from 60.00 to 78.00, a 30% gain, with two gap openings and volume climbing to 3.8 times its earlier average. Traders call this kind of late burst a climax run, and the hard part is reading it while it’s happening, before anyone knows how the chart ends.
This guide builds that chart one bar at a time. Two different eighth sessions are shown, and the same evidence leads to different readings depending on what comes next.
What makes a climax run different from a big day
A climax run describes a whole advance that speeds up after it’s already extended. A single 8% day can happen anywhere: out of a base, on earnings, in a bear-market rally. On its own it carries no late-stage information. The label only makes sense against the context that came before it, and four pieces of context matter most.
The first is the preceding trend. In the example, the stock had already gained 20% from its 50.00 breakout before the burst began. The second is distance from the last consolidation. At the day 7 close of 78.00, price sat 56% above the 50.00 pivot, far beyond the zone where a new position would normally be considered, a point covered in the lesson on breakout pivot price extension. It also matters which base the advance came from. A move out of a third or fourth base is later in its cycle than a move out of a first, which is why counting bases belongs in this reading.
The third piece is pace. During the first leg the stock gained 0.73% per session on a compounded basis. During the burst it gained 3.82% per session, more than five times faster. The fourth is the size of each day’s range and the volume behind it:
| Session | Close | Range as % of close | Volume vs first-leg average |
|---|---|---|---|
| First leg (25-session average) | 50.00 to 60.00 | 2.24% | 1.00x (0.99 million shares) |
| Day 1 | 61.80 | 3.72% | 1.42x |
| Day 3 (gap up) | 66.60 | 3.15% | 2.02x |
| Day 5 (gap up) | 72.50 | 4.00% | 2.63x |
| Day 6 | 75.60 | 5.42% | 3.13x |
| Day 7 | 78.00 | 4.36% | 3.84x |
At the widest, day 6, the daily range was 2.42 times the first-leg average, and volume kept rising. By day 7 the close stood 17.01% above its own 10-day average of 66.66. That’s what acceleration looks like in the data. Notice what the table can’t tell you: whether the move is over.
Acceleration is an observation; a final top is a later judgement
Everything in the table above is measurable on day 7. The statement “this was the top” can only be made after enough later bars exist to confirm it. Mixing the two produces most of the confusion around climax runs. A trader looking at day 7 has a description of an accelerating, extended stock. They don’t have a top.
Several mechanisms can produce this kind of burst. Buyers who missed the first leg may become urgent. Momentum funds and systematic strategies can add exposure as the trend strengthens. Short sellers facing losses may be forced to cover, adding buy orders that have nothing to do with a view on the business. Each story fits a chart with gaps and rising volume.
The common misread is to name one of those mechanisms as fact. Price and volume record that shares changed hands at higher prices. They don’t record who traded or why. Heavy volume on day 7 is consistent with a final wave of late buyers, and it’s equally consistent with a large holder building a position into strength. Treat any story about participants as a hypothesis the chart can’t confirm.
Day 8, first path: the reversal
On the first path, day 8 opens at 79.60, above day 7’s high of 78.60. Early buyers push it to 81.40. Then the session turns. It closes at 76.30, near the bottom of a 7.21% range, on 4.65 times the first-leg average volume. That’s the widest range and heaviest volume of the whole move, and the close is 1.70 below the prior day’s close.
Taken alone, that bar is an intraday reversal after unusually strong activity. Its meaning depends on what follows. Day 9 closes at 73.40 and day 10 at 72.10, both near their lows, on volume that stays above twice the earlier average. Day 11 bounces to 74.60 on lighter volume of 1.62 times. Days 12 and 13 then close at 71.60 and 69.30, with volume rising again.
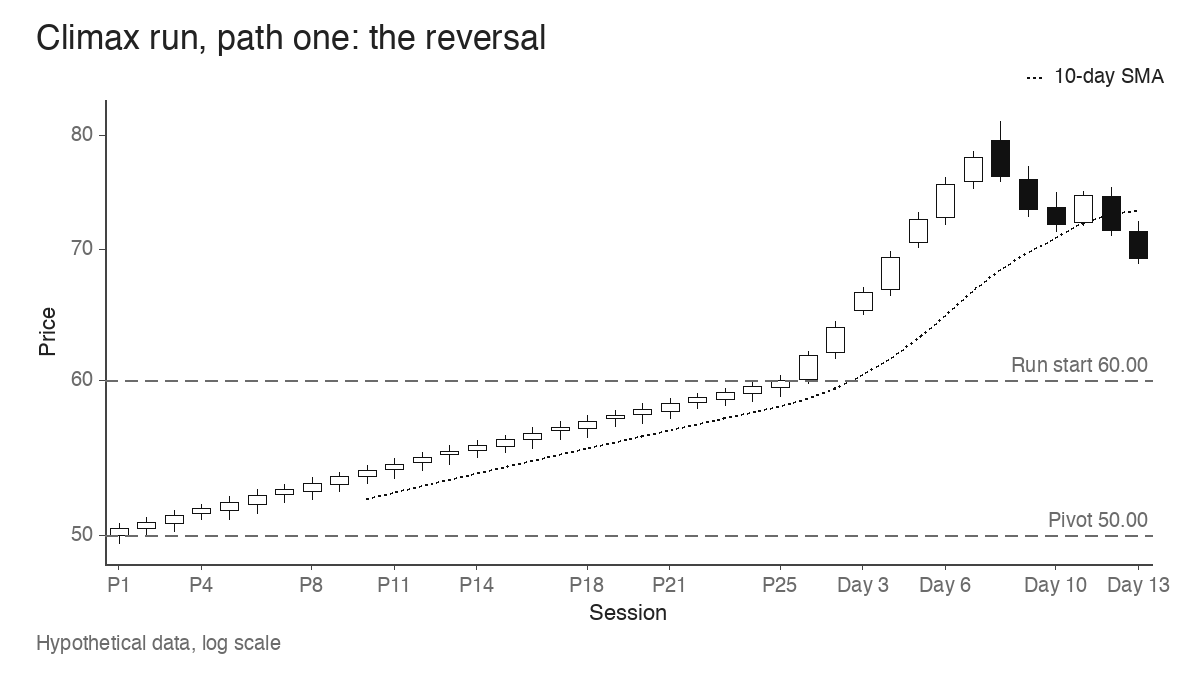
By day 13 the stock is 14.86% below the day 8 high of 81.40, and the bounce on day 11 never challenged that high. The sequence now matters more than any single bar: a gap that failed, a wide reversal, no follow-through higher, and weak closes on rising volume. It’s reasonable to call this evidence of possible exhaustion. Whether 81.40 proves to be the major top still can’t be settled on day 13.
Day 8, second path: a strong close and a quiet range
Rewind to day 7 and give the stock a different eighth session. This time it opens at 78.40, trades to 80.60 and closes at 80.20, in the top 15% of its range. Volume is still heavy at 3.94 times the earlier average, nearly as heavy as the reversal day on path one. The range, though, narrows to 3.37%.
Days 9 through 13 move sideways between 77.10 and 80.90, a band 4.70% deep. Daily ranges shrink to between 2.27% and 3.08%. Volume falls each session, from 2.22 times the average on day 9 to 1.11 times on day 13.
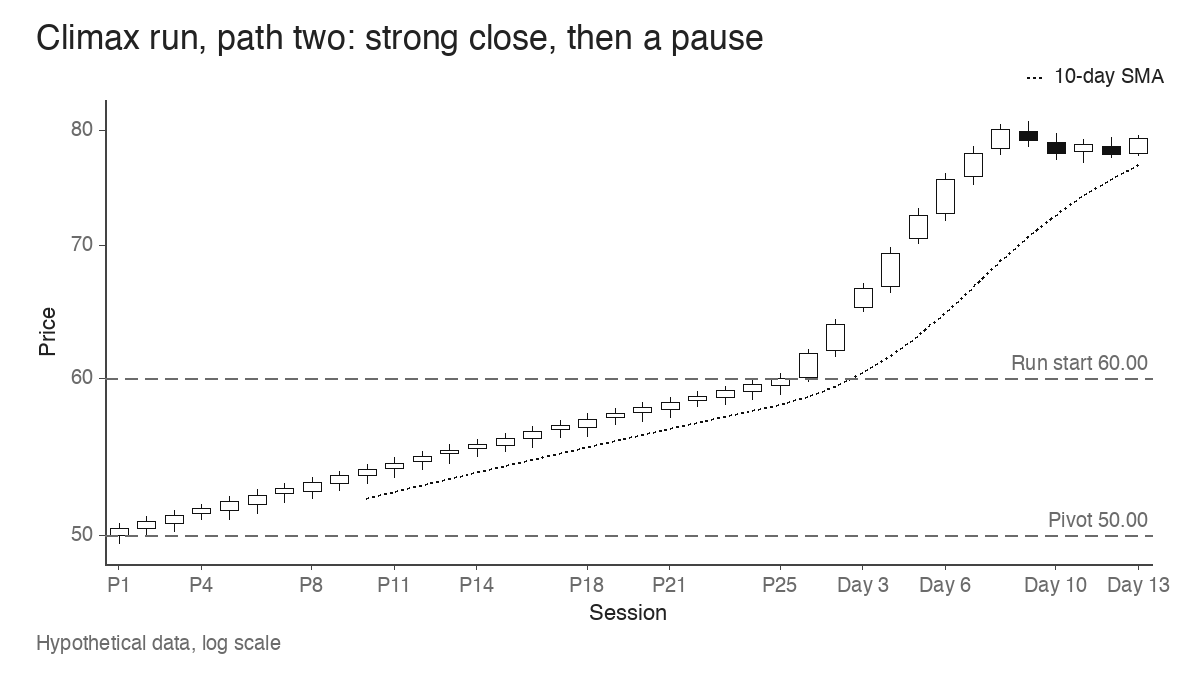
The first seven bars are identical on both charts. The heavy-volume day 8 is common to both paths too. What’s different is the close on day 8 and the behaviour afterwards: on path two, buyers held the gains and sellers never produced a wide down day. A trader who called a climax top on day 7 would’ve been reading a pause as a peak. Unusual volume alone didn’t decide anything here.
The two paths side by side:
| Observation | Path one | Path two |
|---|---|---|
| Day 8 close position in its range | Bottom 7% | Top 15% |
| Day 8 range | 7.21%, widest of the move | 3.37%, narrower than day 7 |
| Failure to extend after the heavy day | Yes, no close above 78.00 through day 13 | Day 9 trades to 80.90, then pauses |
| Volume on later down days | 2.12x and 2.63x on days 12 and 13 | Falls to 1.11x by day 13 |
| Later pullback from the high | 14.86% by day 13 | Held within a 4.70% band |
Speed alone is not a topping signal
Compare the late burst with a hypothetical breakout from a first-stage base. A stock clears a pivot at 40.00 and reaches 50.00 in eight sessions, a 25% gain, or 2.83% per session. That’s about three quarters of the 3.82% per session of the climax-run example, so the two moves run at a similar order of pace. The context is completely different. The breakout is 25% from its pivot rather than 56%, it comes from the first base instead of following a prior leg, and the move starts a trend instead of extending a mature one.
Powerful early moves are often how leading stocks begin. Studied winners include advances that looked extreme at the time and then kept going. One example from the pattern library is VRSN in 1999: its pole gained 116.06% in 4.6 weeks, from 27.25 on 1999-08-05 to 58.88 on 1999-09-08. Measured on speed alone, that move looked like a blow-off. The stock then built a four-week flag with an 18.9% correction and broke out again on 1999-10-07 on 1.71 times average volume. A fast advance gives you a reason to look closer at extension, base count and later bars, and that’s all.
Where exhaustion evidence fits beside an exit plan
Climax reading is one input into position management. It doesn’t replace the framework a trader already uses. A trader holding a gain from the 50.00 breakout already has a profit cushion, and may already have a take-profit strategy or a trailing exit. Signs of possible exhaustion can prompt a review of that plan. They don’t set an exit price, and no universal percentage marks the point where an advance becomes a climax.
A trailing approach such as the 10-week moving average exit handles a different question. It responds when the trend breaks, which usually happens well after a late-stage burst ends. During a climax run the price can sit far above any trailing average; in the example the day 7 close was 17.01% above even the 10-day average, so a slower line lags further still. A stock can give back a large part of a burst, as path one did with a 14.86% drop from its high by day 13, before a trend exit is touched. Some traders therefore keep two separate questions in view: has the trend broken, and is the advance showing signs of exhaustion? The answers can differ.
The eight-week hold convention, associated with William O’Neil, covers a narrower case. It applies to a stock that gains roughly 20% within about three weeks of a proper breakout, and it suggests holding that stock through the first eight weeks. The example stock doesn’t qualify. Its first 20% took 25 sessions, about five weeks. Even for a stock that does qualify, the convention says nothing about week twelve or about a burst that begins after the hold period ends. It answers one early-trend question and leaves late-stage management open.
Tops that arrive without a climax
Many advances end quietly. Picture a different hypothetical stock that makes its final high on volume of 0.9 times its average, with an ordinary daily range of about 2%. Nothing about that bar looks extreme. Over the following weeks the stock lags the market, down days start to carry more volume than up days, and it eventually closes below its 10-week line.
No climax run appears anywhere on that chart. A trader who watched only for gaps, wide ranges and volume spikes would’ve seen no warning at all. It’s the trend-based exit that catches this kind of top, which is one reason exhaustion evidence works as an addition to a trailing exit, never as its replacement.
What one bar can settle in a climax run
The limits are worth stating plainly. The label “climax top” is easy to apply after the fact, because the chart already shows which spike came last. Strong trends can stay extended for longer than seems reasonable, as path two and the VRSN pole both show. A volume spike has competing explanations: index rebalancing, news, a large holder entering or leaving, options-related hedging. And no isolated bar, however wide or heavy, establishes that a major top has formed.
What the chart can give you is a sequence. Acceleration after an extended advance, then a heavy session that fails to extend, then weak closes and no recovery, is a pattern worth taking seriously. A heavy session followed by a strong close and a quiet range tells a different story, even when the first seven bars are identical. Read the bars after the spike before deciding which story you’re in.
Learn the pattern. Ride the trend. Keep the gains.
Educational content only. Not investment advice. Trading involves risk. You are responsible for your decisions.
Get the free Market Wisdom e-book
Join Trends and Breakouts — historical winners, breakout studies, and risk lessons. No spam, unsubscribe anytime.