On 1 February 2021, CVR Partners opened at 15.75 and closed at its high of 17.98, up 14.8% on the day, a few days after a pullback had tagged 14.70. The stock was still below its January high, the business was still reporting losses, and nitrogen fertilizer was only starting to reprice. That UAN base breakout setup turned into a 15-month cyclical run: from the February 2021 entry, the move carried 626% to the May 2022 exit over 462 calendar days.
When UAN shows up on traders’ screens again, this is the chart worth studying. It’s a lesson in how a commodity leader can set up before the earnings turn and how long a trend can run once the cycle agrees with the chart.
UAN base breakout: key takeaways
- Pattern: a year of basing after the 2020 crash, a fast advance off the 5.75 low, then a three-week pullback under the 18.74 pivot.
- The move: +625.9% from the entry close of 17.98 to the exit close of 130.51, across 462 calendar days.
- Nine add-on points, from 27.77 in March 2021 to 145.15 in April 2022.
- Price ran ahead of the fundamentals: revenue was still falling year over year into the entry.
- The trend lesson: the stock closed below its 50-day line in mid-2021 and late 2021 and still went on to 179.74.
| Ticker | UAN |
| Study entry date (anticipatory) | 2021-02-01 |
| Entry close | 17.98 |
| Pivot (prior 20-day high) | 18.74 |
| Pivot cleared | 2021-02-02, close 18.76 (see the anatomy section) |
| Volume vs 20-day average | 1.2x |
| Exit date | 2022-05-09 |
| Exit close | 130.51 |
| Price change, entry close to exit close | +625.9% |
| Calendar days | 462 |
| Peak before exit | 179.74 (2022-04-20) |
How the 2020 base and the 18.74 pivot formed
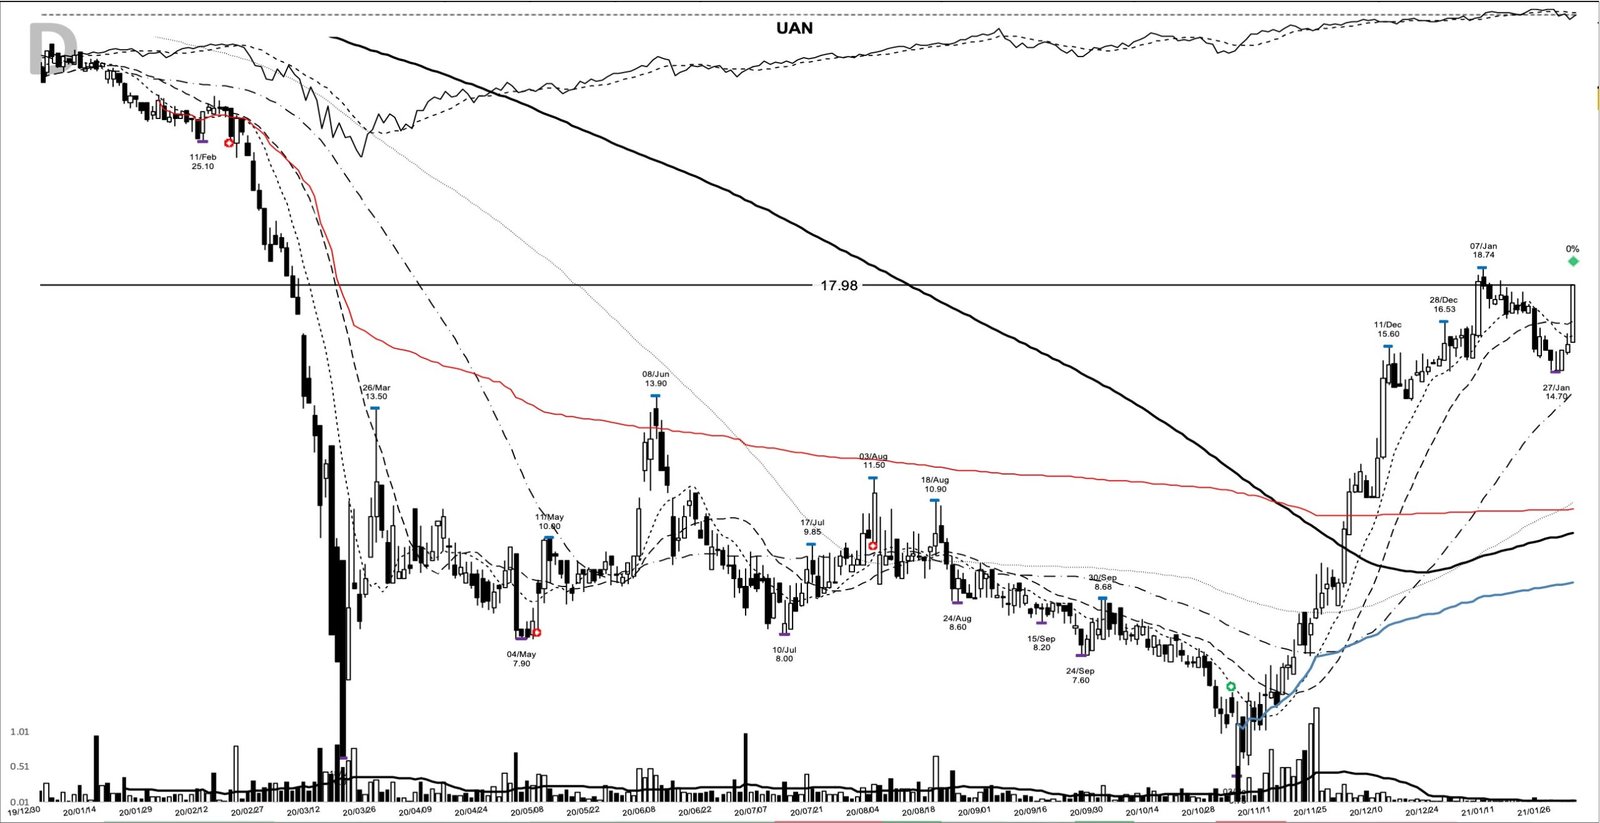
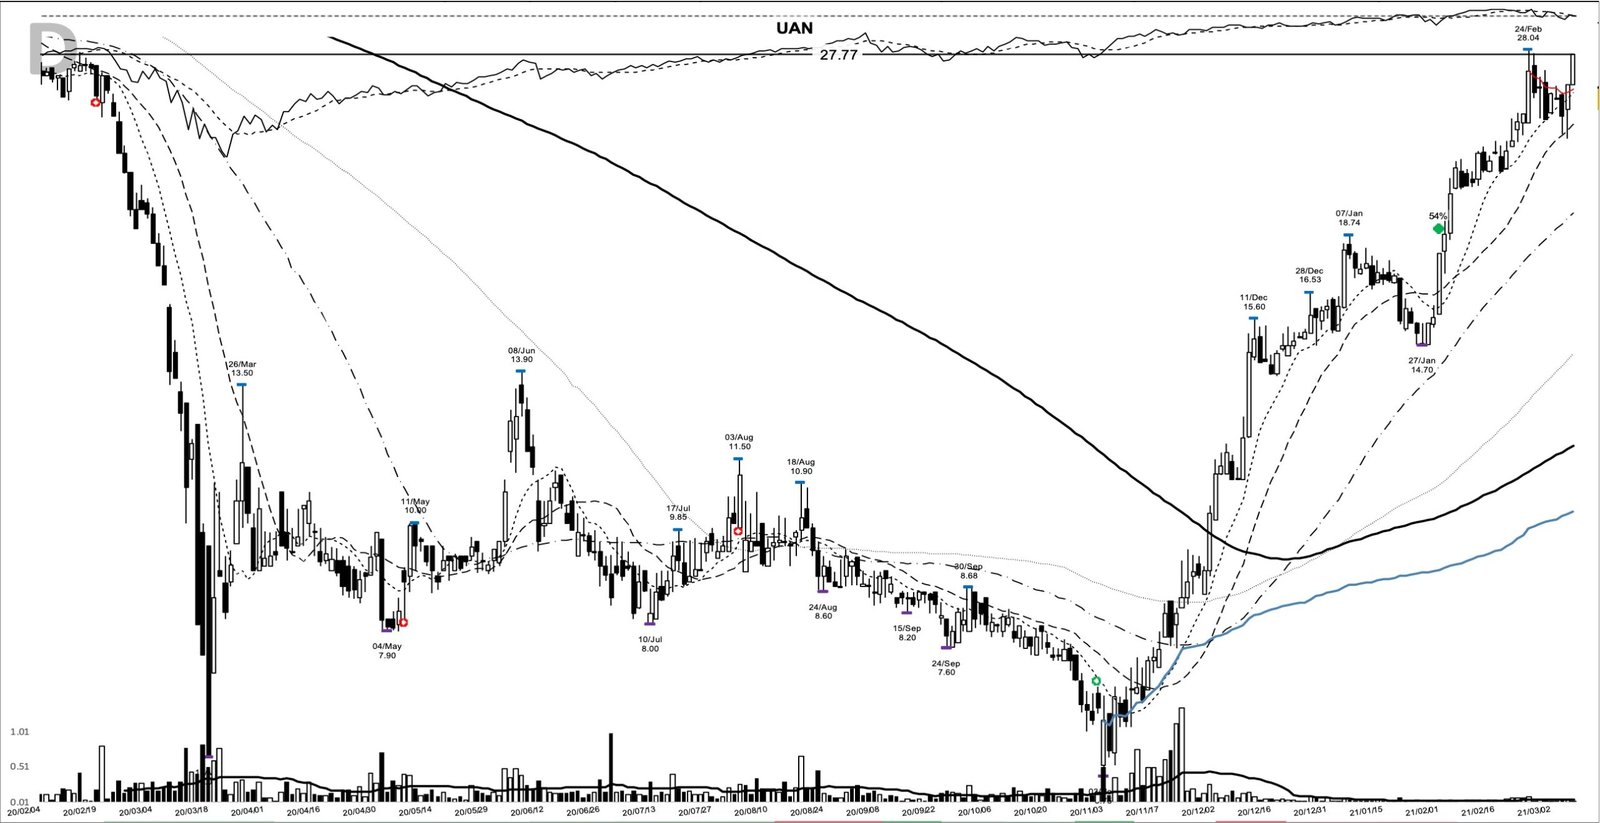
The chart, from my study archive, starts with the damage. UAN printed 27.90 on 13 February 2020 and closed at 6.00 on 18 March 2020. For the next seven months it went sideways in a wide range, topping at 13.90 on 8 June and sagging back toward the March lows in late October. A stage analysis reader would call that a long, ugly stage one.
The low came on 3 November 2020 at 5.75, the day after the partnership announced a 1-for-10 reverse unit split. All prices here are split-adjusted, which is why the 2020 range reads 6 to 14 instead of under a dollar. From there the move was steep. Volume expanded through November, and on 10 December the stock closed at 14.50, its first close above the 13.90 June high. It reached 18.74 on 7 January 2021, a 225.9% rally off the low.
That 18.74 high is the pivot. The pullback that followed was orderly for a stock that had just tripled: it bottomed at 14.70 on 27 January, 21.6% below the high, and held above both the old 13.90 base top and the 50-day line, which sat at 13.50 that day.
The entry was anticipatory. The 1 February close of 17.98 sat 0.76 below the 18.74 pivot, and volume ran 1.2 times the 20-day average, which is ordinary participation. The pivot was cleared the next session, when UAN closed at 18.76 on 2 February, and the clearance turned decisive on 3 February with a close of 20.48.
CVR Partners into February 2021: losses, a reverse split, rising nitrogen
On the model-book fundamental frame, UAN didn’t qualify. SEC filings show losses of 3.68 per unit in the June 2020 quarter and 1.70 in the September quarter. Revenue had fallen year over year for four straight quarters: down 12.3%, 18.3%, 23.7% and then 10.3% in the September 2020 quarter. The one hint was in that last figure. The decline had narrowed.
The story investors were arguing about was the fertilizer cycle. The reverse split, completed on 23 November 2020 per the company’s filings, existed because the units had traded below a dollar and the partnership needed to regain NYSE compliance. Three months later the tone had changed. In its fourth-quarter release of 22 February 2021, three weeks after the entry, management said it was “seeing strong customer demand for fertilizer application” and expected spring prices “significantly higher than last year.” It still paid no distribution for the quarter.
A grain and commodity tape in early 2021
The backdrop did the heavy lifting. By late January 2021, corn, soybean and wheat prices had climbed to their highest levels in more than six years on dry weather and strong Chinese export demand, per the University of Illinois farm policy news service. Fertilizer followed. DTN’s retail survey of 10 February 2021 had UAN28 up 14% on the month and urea up 16%. Commodities broadly started 2021 with a sharp rally, as Bloomberg later recounted, which is the kind of tape where a nitrogen producer can lead. Commodity cycles are a Jim Rogers theme for a reason: when supply is tight, price moves first and the reported numbers catch up later.
Preparing for UAN before 1 February
Three things could have put UAN on a watchlist in January. The 10 December close above 13.90 resolved eight months of basing. The run to 18.74 came with the 10-day, 20-day and 50-day lines all turning up. And the pullback to 14.70 held above the old base top, so the structure stayed intact.
On the entry day the trend posture was fresh. The 17.98 close was the first close back above the 10-day line after the pullback, and it sat 12.4% above that line at 16.00. The 20-day was at 16.54 and the 50-day at 14.03, so price was stacked above all three.
The trade plan a trend follower might have written that day was simple. Enter above the 18.74 pivot. Put the initial stop below the 14.70 shelf, a 21.6% risk from the pivot, which is wide for a breakout and calls for a smaller position. The 5.75 base low marks where the whole structure fails, too far away to serve as a stop. Then trail the 10-day line and widen to the 20-day once the move is well advanced.
The anticipation changes the arithmetic. Entering at 17.98 against the same 14.70 shelf meant an 18.2% risk instead of 21.6%, bought with the pivot still overhead. Waiting for the clearance cost only 0.78 per unit here, but anticipation only pays when the pivot gives way within days, as it did on 2 February.
From 17.98 to 179.74 and back to 130.51
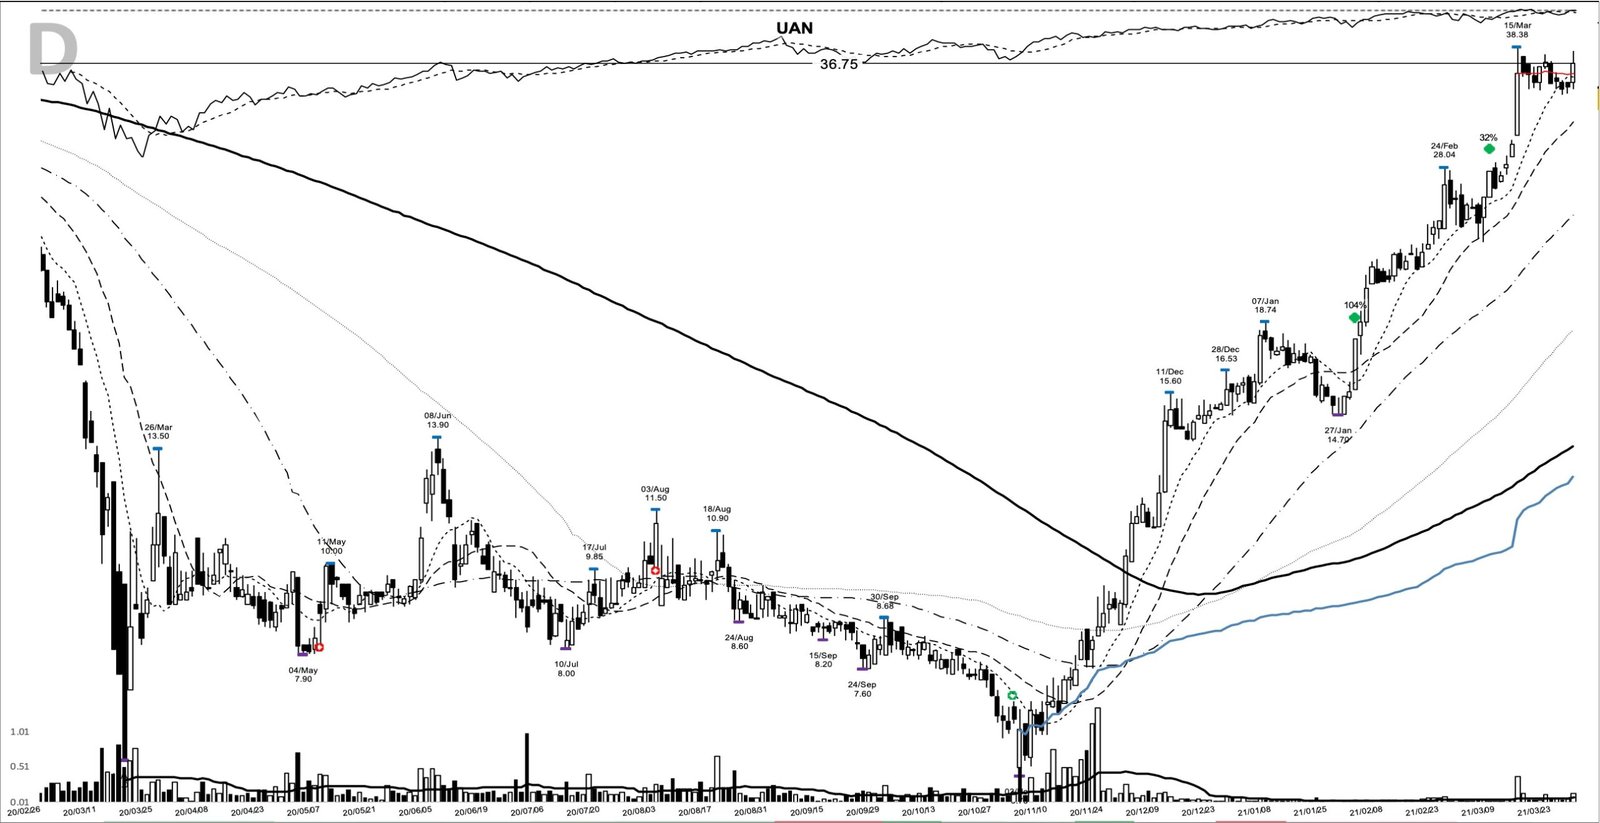
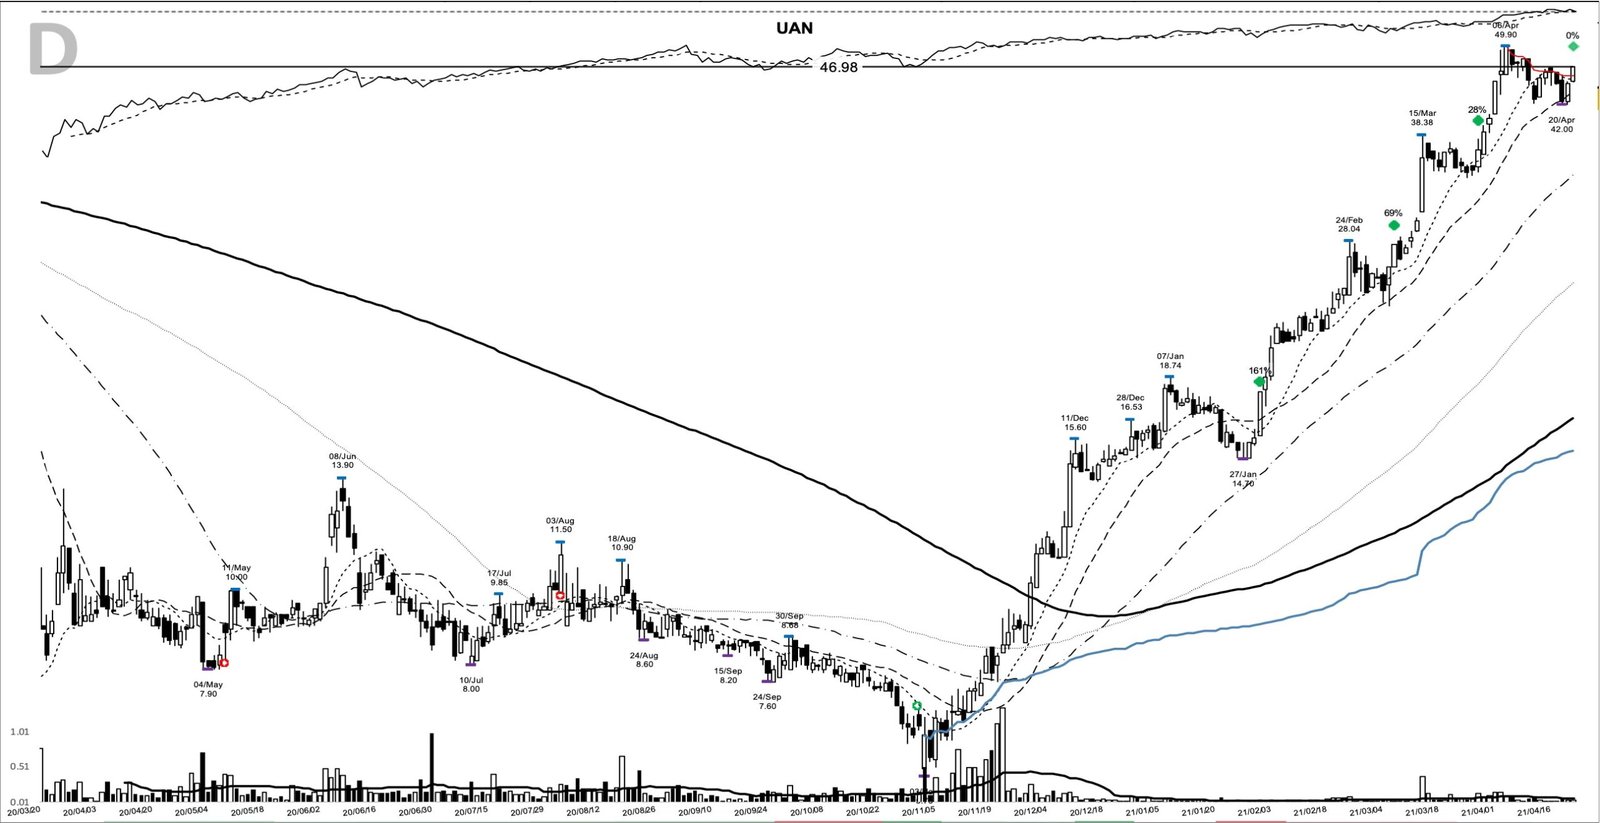
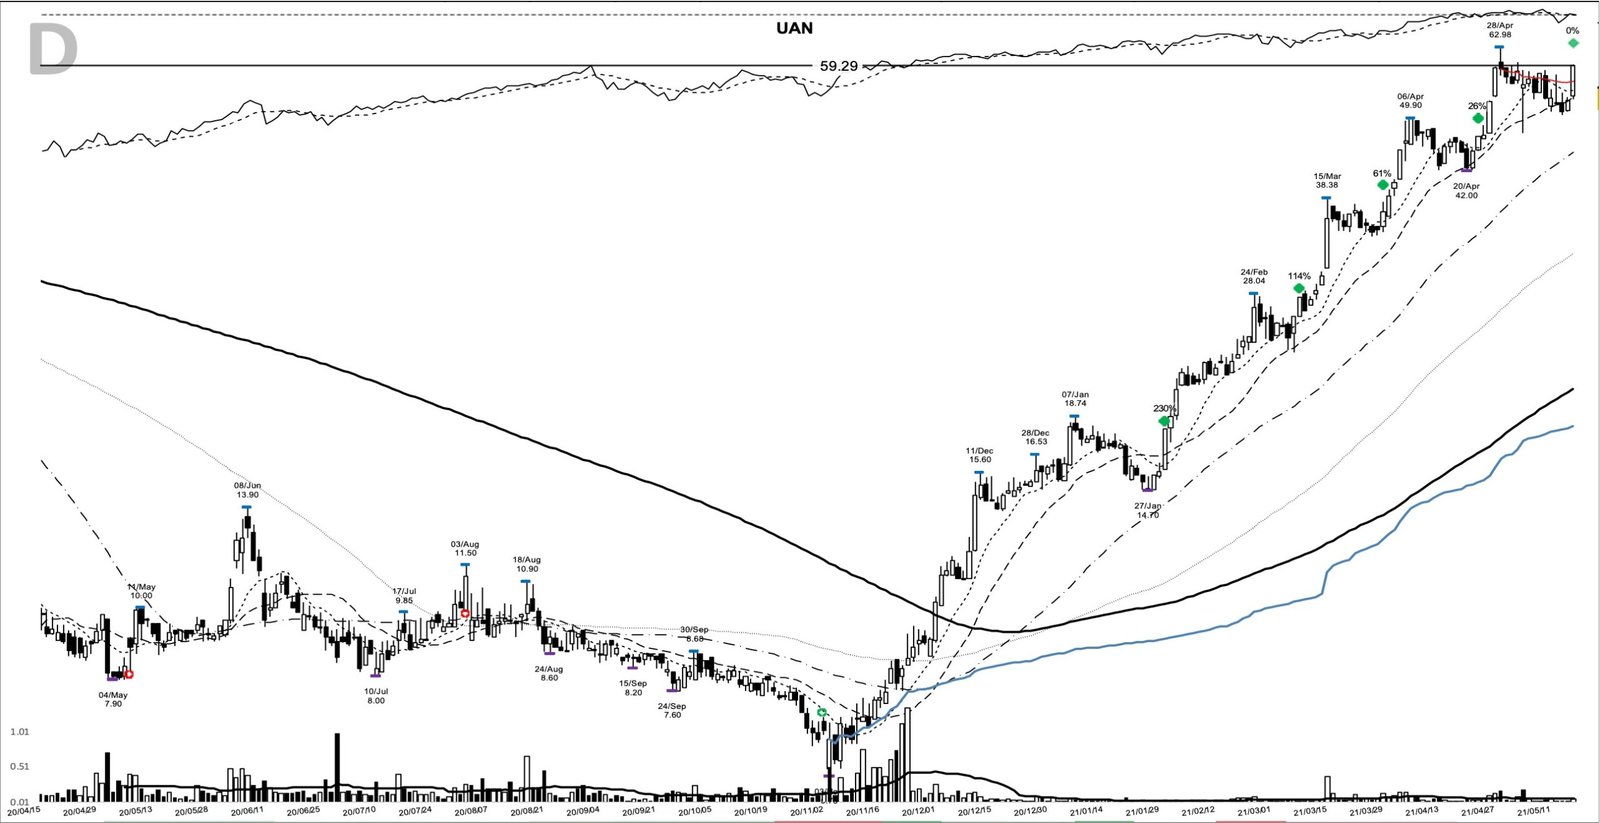
A trader using this pattern might have watched for two things after the entry: closes holding above the 18.74 pivot, and pullbacks that found the rising averages. The first half of 2021 delivered both. There was an opportunity to add on 8 March at 27.77, on 29 March at 36.75, on 22 April at 46.98 and on 17 May at 59.29. Adding at successively higher prices is the classic way to pyramid into a position.
Then the stock tested patience. After a high of 68.80 on 8 June 2021, UAN closed below its 50-day line on 15 July and stayed under it for most of August. It recovered, and the 30 September add came at 69.70, close to the summer highs.
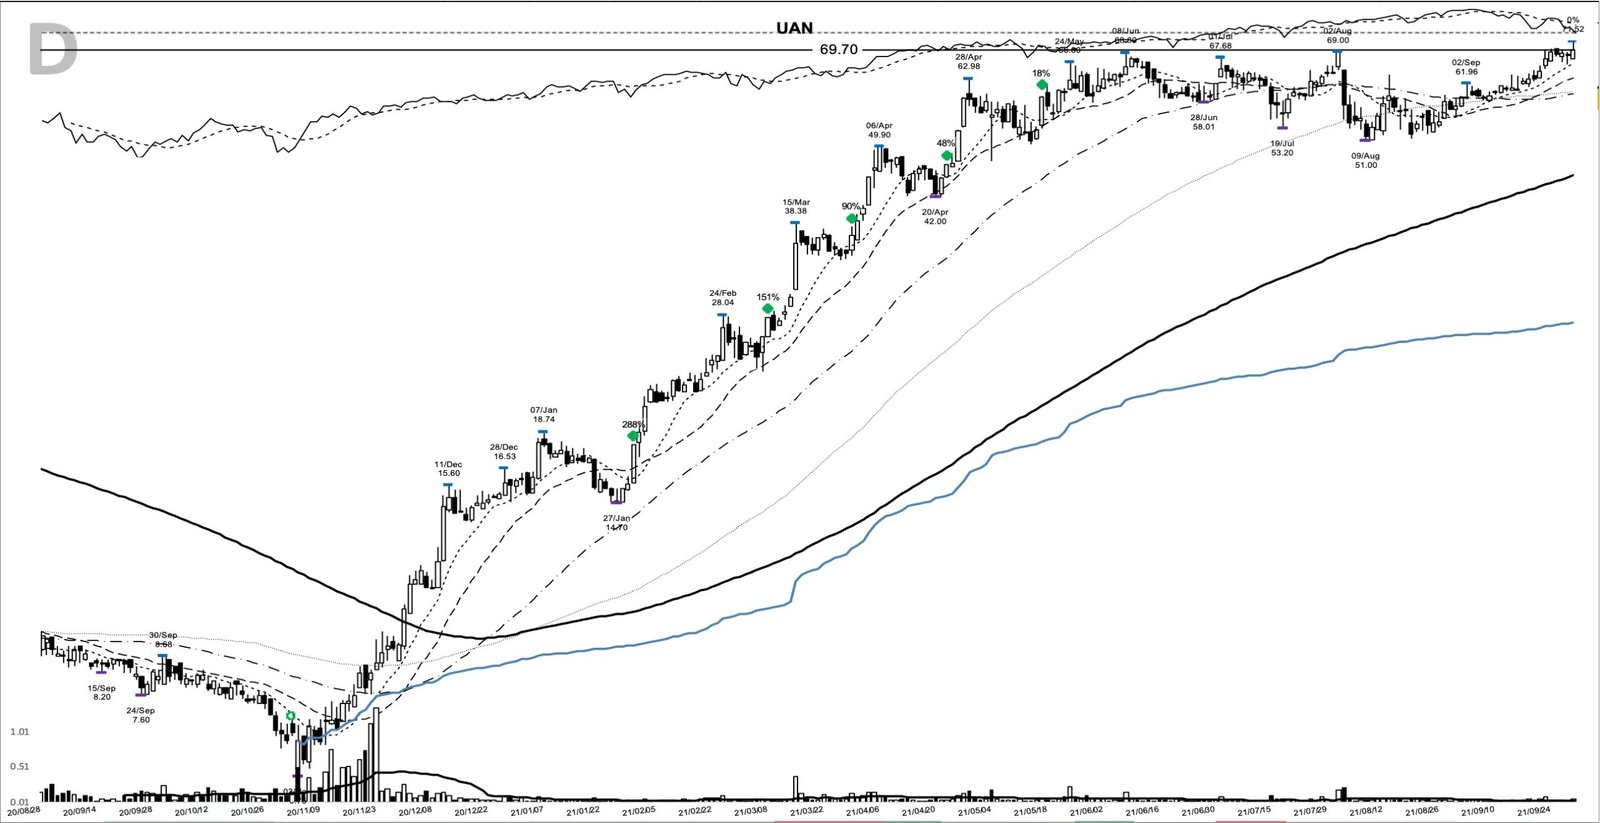
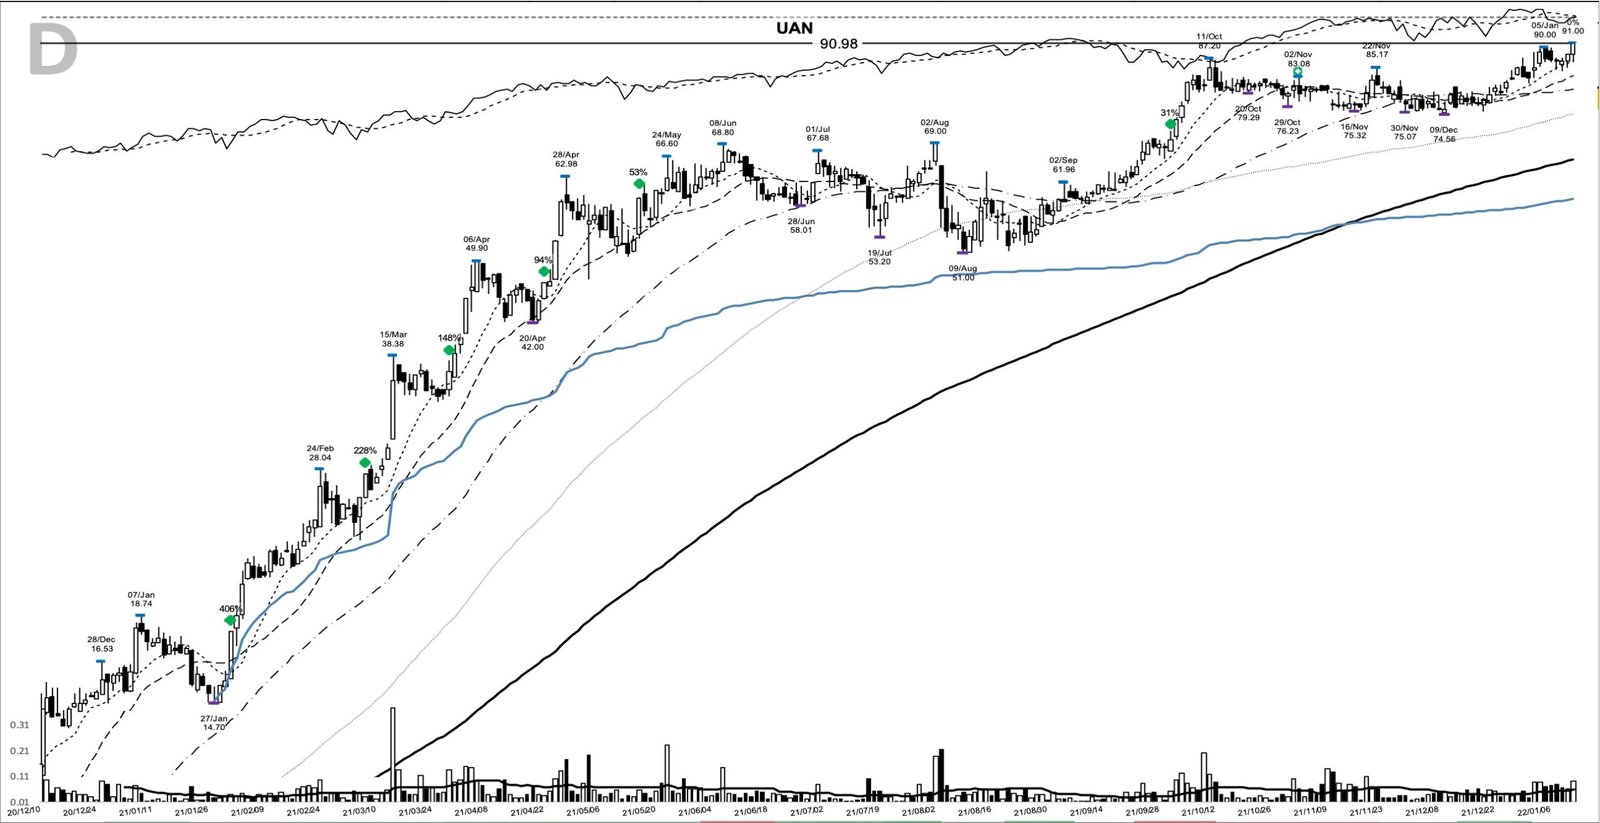
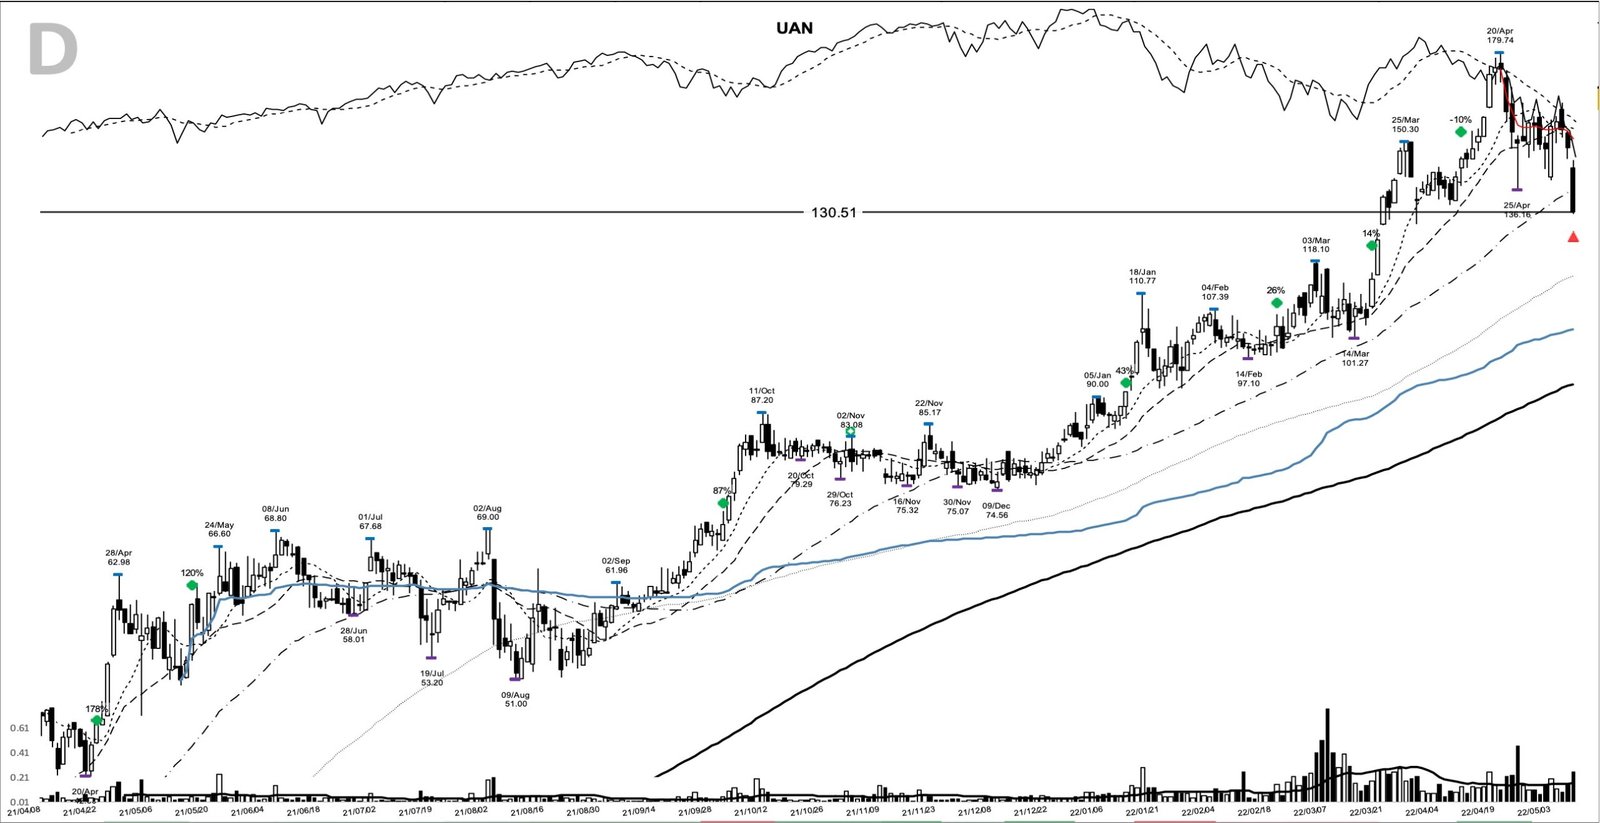
The second leg ran with the energy crunch of late 2021, which management credited for the nitrogen price gains on its first-quarter 2022 call. Another dip below the 50-day in December gave way to adds on 12 January 2022 at 90.98, 22 February at 103.61, 17 March at 114.09 and 8 April at 145.15.
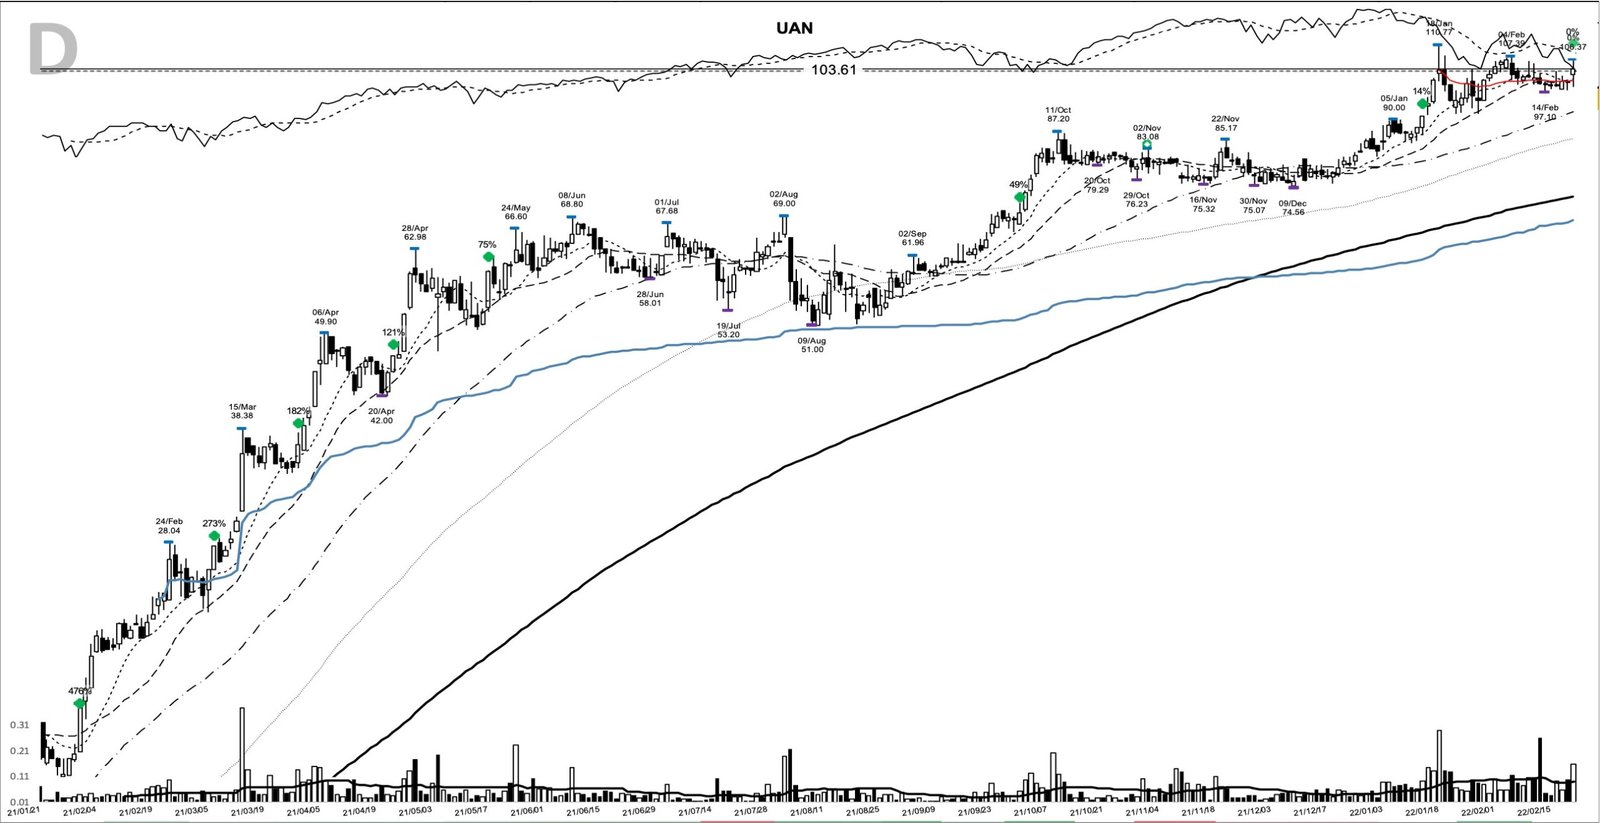
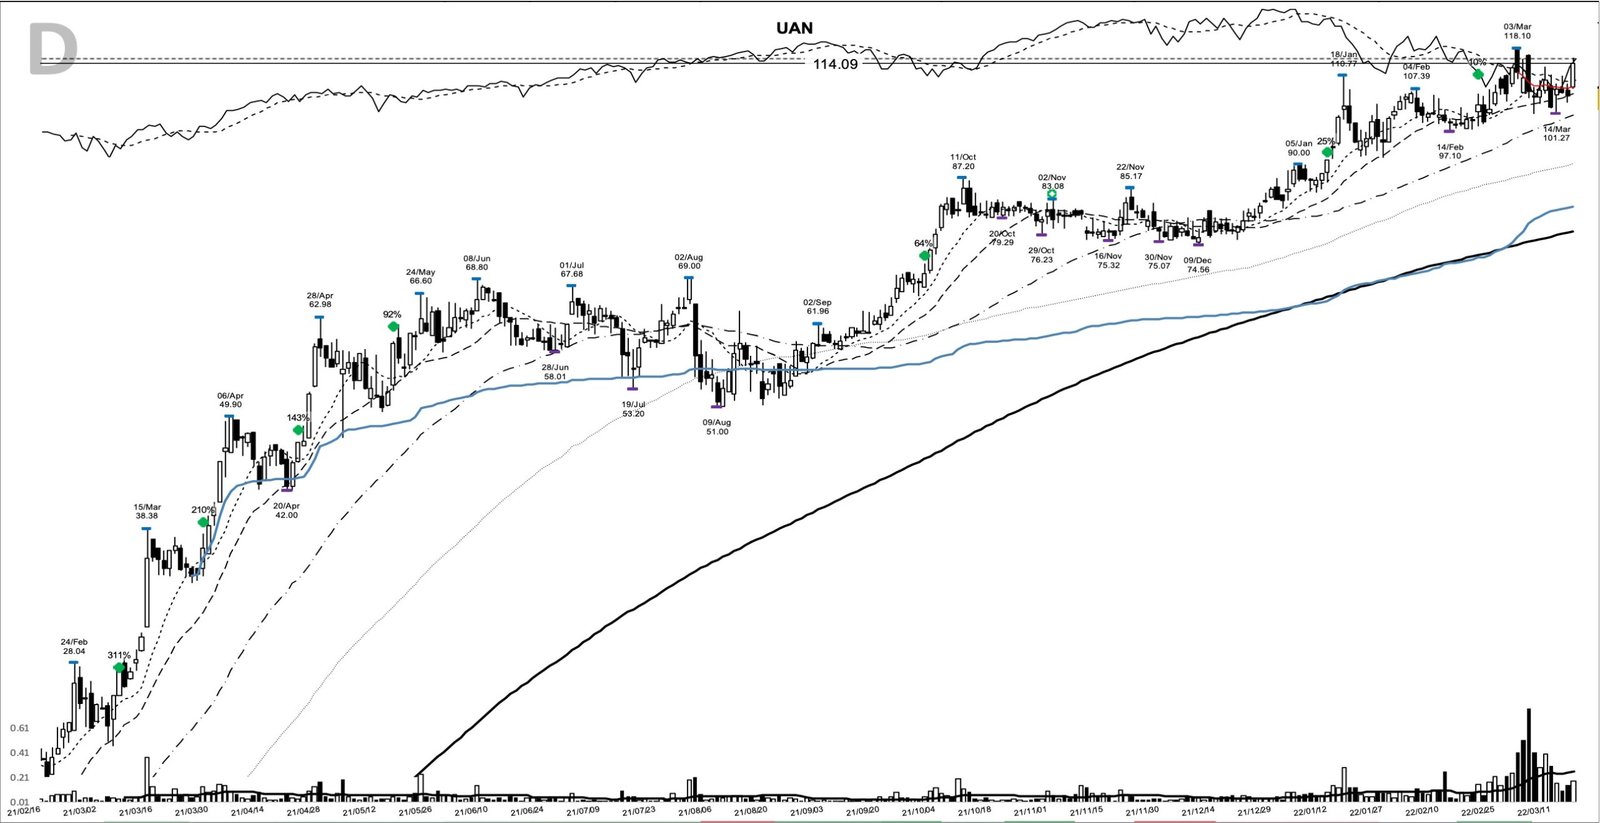
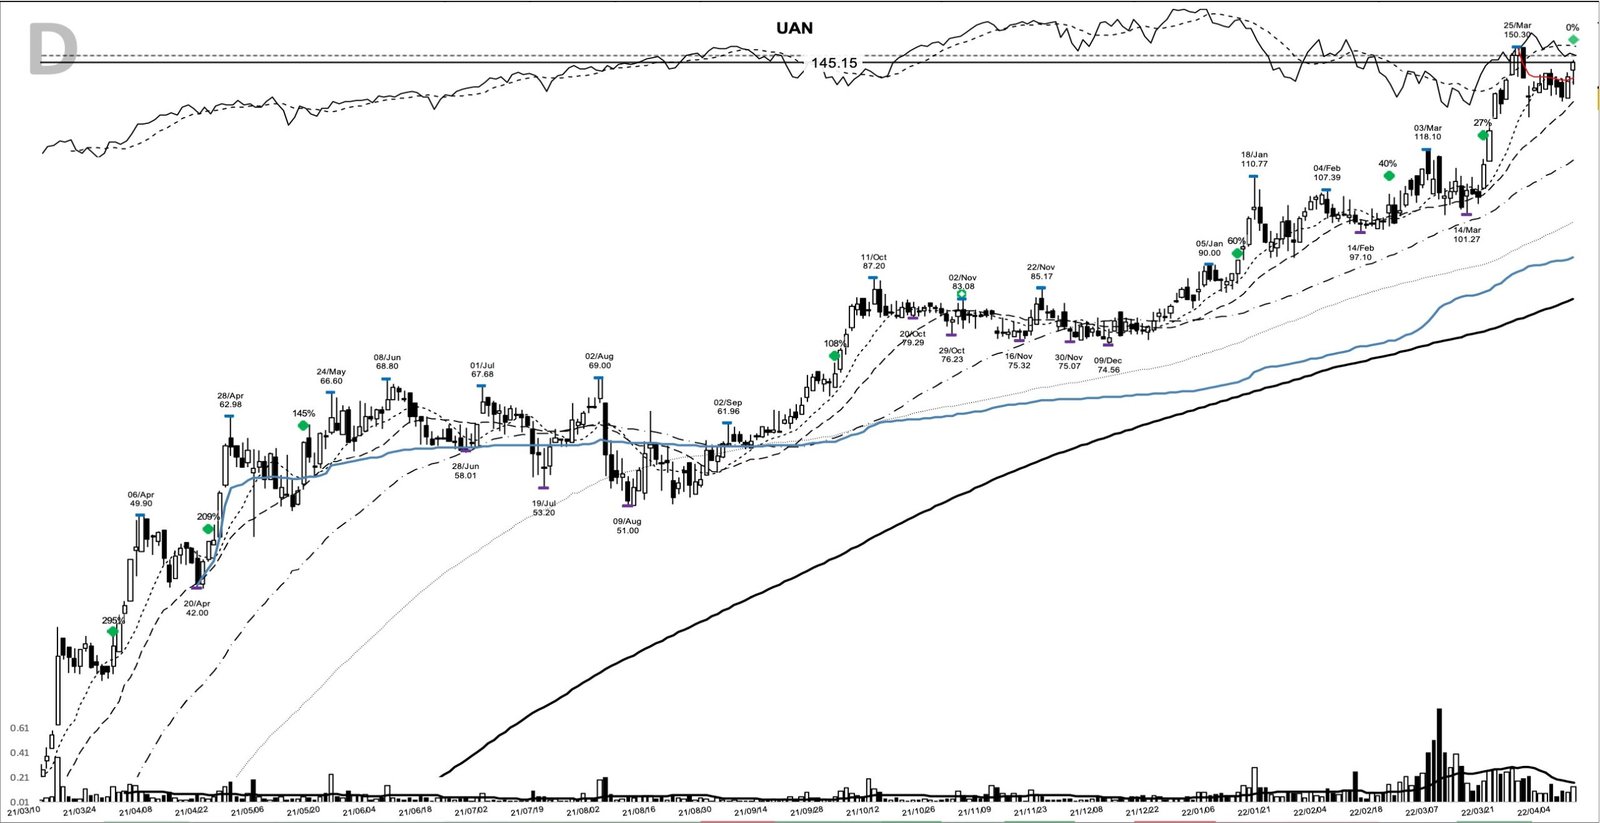
The peak came on 20 April 2022 at 179.74. The stock then fell 27.4% to the exit on 9 May, when it closed at 130.51, below the 10-day, 20-day and 50-day lines on the same day. It was UAN’s first close under the 50-day since 20 December 2021, on a session when the S&P 500 closed below 4,000 for the first time since March 2021, per Newsquawk’s market wrap. The exit closed the move 625.9% above the entry over 462 calendar days.
Where the UAN chart misleads
The first misread is calling 1 February a breakout. It closed below 18.74 on volume only 1.2 times average. The chart offered a well-placed early entry without confirmation, and an early buy that stalls under its pivot can leave a trader holding a stock that never resolves.
The second is assuming a mechanical trail would have captured the run. A 20-day trail would have closed out on 20 April 2021, when the stock settled at 42.44 against a 20-day line of 42.58, two days before the 22 April add. A 10-day trail after the peak would have exited on 22 April 2022 at 153.15, above the eventual exit. Neither rule matched the whole move, and a trader leaning on one would have needed a plan to re-enter.
The third is reading the fundamentals backward. UAN’s revenue was shrinking when the base resolved, so a pure earnings screen would have missed it. In a cyclical, the chart can lead the filings by quarters. That cuts both ways, because the same commodity can reverse before the numbers show it.
Cyclical leaders turn before the numbers do
UAN rewarded patience twice: once for watching a damaged stock repair itself through 2020, and again for sitting through two dips below the 50-day line in 2021. The setup was a pivot under a strong commodity tape, and the move lasted as long as nitrogen prices did. Learn the pattern. Ride the trend. Keep the gains.
Related studies: AMR base breakout, December 2020, another commodity name that turned off the 2020 lows, and the breakout pivot price extension guide on how far above a pivot an entry can sit. A new winner study lands most evenings.
Price and volume figures are computed from split-adjusted daily OHLCV data; company figures come from SEC filings where cited.
Educational content only. Not investment advice. Trading involves risk. You are responsible for your decisions.
Get the free Market Wisdom e-book
Join Trends and Breakouts — historical winners, breakout studies, and risk lessons. No spam, unsubscribe anytime.