
A hypothetical growth stock has advanced for twelve weeks, from a 40.00 weekly close to 55.60. Its 10-week moving average sits at 48.78, so the last close is 13.98% above the line. Two weeks later the stock trades down to 49.60 intraday. Whether that week counts as a support test or the first sign of a breakdown depends less on the chart than on the convention the trader chose beforehand. This guide treats the 10-week moving average exit as a family of conventions. Each one is stated precisely and then applied to the same weekly bars, one completed week at a time.
Every price, volume figure and outcome below is hypothetical and built so the arithmetic can be checked by hand. No real security is involved, and none of the levels is a suggested exit for anyone’s position.
What the 10-week moving average measures during and after the week
The 10-week simple moving average is the sum of the last ten weekly closing prices divided by ten. A weekly close is the final trade of the week’s last session. Until that session ends, the week is incomplete and so is the average.
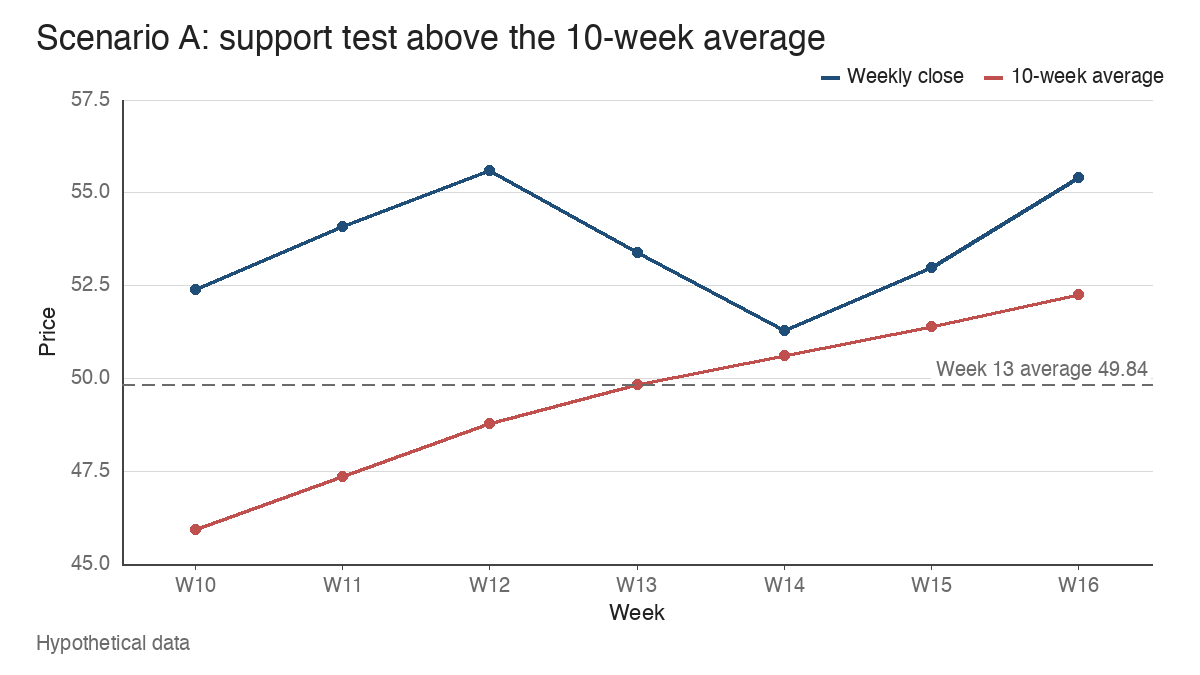
That distinction matters more than it first appears. During a week, the chart shows the last completed value of the line, which is a fixed number. The value the week will actually finish with depends on where the current week closes, because the new close enters the calculation and the close from ten weeks earlier drops out. In the example, the nine completed closes that stay in the average for week 14 sum to 454.80. A week-14 close of p produces an average of (454.80 + p) / 10, and the close lands exactly on the line when p equals 454.80 / 9, which is 50.53. The chart displayed 49.84 all week, the completed week-13 value. A trader watching that number intraday is reading a different level from the one a weekly close will be judged against.
The first pullback to the 10-week moving average covers why that line and the 50-day line usually plot near each other yet differ. The short version is weighting. A 50-day average gives each daily close 2% of the weight. A 10-week average gives each Friday close 10% and the other four sessions none at all. Move a Wednesday close by 1.00 and the 50-day line moves 0.02 while the 10-week line doesn’t move. Move a Friday close by 1.00 and the 10-week line moves 0.10, five times as much as the 50-day. Holiday-shortened weeks also stretch fifty sessions across more than ten calendar weeks, so the two lines cover slightly different windows as well.
Four confirmation conventions for a 10-week moving average exit
A trailing exit responds to weakening price behavior after an advance. It accepts some giveback in exchange for not being shaken out by ordinary fluctuation, and the confirmation convention sets where that trade-off sits. The four below are kept separate throughout. Each is an example policy for illustration.
| Convention | What triggers it | When it’s known |
|---|---|---|
| 1. Intraday breach | Any trade below the last completed 10-week value | During the week, at the moment of the trade |
| 2. Weekly close | A completed weekly close below the 10-week average that includes that close | At the end of the week |
| 3. Close plus price confirmation | Convention 2, then the following week also closes below the low of the close-below week | At the end of the next week |
| 4. Close plus volume | Convention 2 on weekly volume at least 1.25 times the average of the prior ten weeks | At the end of the week |
Convention 1 needs no weekly close and no volume. Convention 2 ignores everything inside the week. Convention 3 adds a later price condition and ignores volume. Convention 4 adds volume and ignores the following week. A common misread is to blend them, for instance treating a heavy-volume intraday breach as if it satisfied a close-based rule. Each convention is a complete statement on its own, and mixing them after the fact produces a policy nobody wrote down in advance.
The shared history through week 12
All three scenarios use the same first twelve weekly closes: 40.00, 41.30, 42.80, 43.60, 45.10, 46.70, 47.50, 49.20, 50.80, 52.40, 54.10 and 55.60. The 10-week average reads 45.94 at week 10, 47.35 at week 11 and 48.78 at week 12. Weekly volume over weeks 3 to 12 averages 579,000 shares.
Some context is visible here before any test. The line is rising by more than 1.40 per week, and the stock has closed above it every week since it became computable. The 13.98% extension at week 12 means the line has room to rise toward price even if price stalls. That extension describes how far a pullback would have to travel to meet the line, and how much open gain sits above it.
Week 13: the same pullback in all three charts
Every scenario prints the same week-13 close of 53.40, with highs at 56.00. The average rises to 49.84, so the close stays 7.14% above it. Volume differs slightly: 480,000 shares in scenario A, 620,000 in B and 600,000 in C, against a prior ten-week average of 579,000. Scenario A is the only one of the three on below-average volume, but one week of lighter trade proves little. No convention fires in any scenario.
Week 14: three charts at the line
This is the week the reader would have to judge in real time. During the week, the displayed line is 49.84.
| Week 14 | High | Low | Close | 10-week avg | Volume vs prior 10-wk avg | Close position in range |
|---|---|---|---|---|---|---|
| A | 53.90 | 49.60 | 51.30 | 50.61 | 0.79x | 40% |
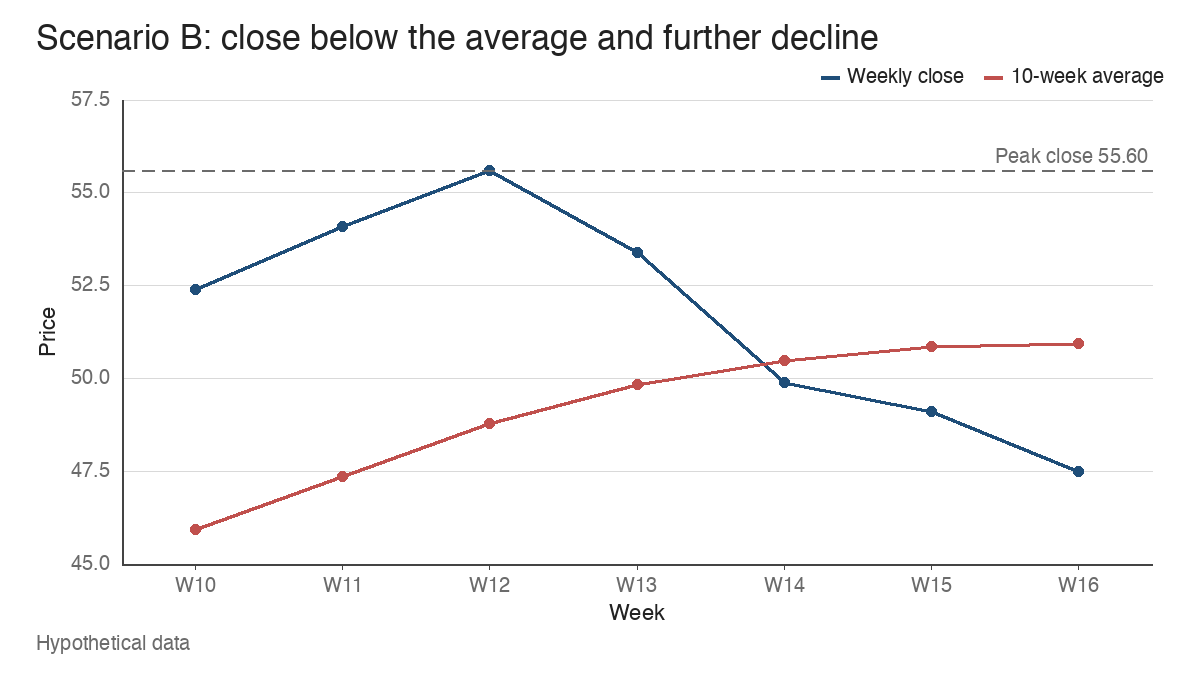
| B | 54.10 | 49.60 | 49.90 | 50.47 | 1.51x | 7% |
| C | 53.80 | 49.30 | 49.60 | 50.44 | 1.10x | 7% |
All three trade below 49.84, so convention 1 fires in every scenario at that level, assuming a fill there without slippage. Scenario A then closes at 51.30, 0.69 above its average, so conventions 2 to 4 stay silent. Scenarios B and C both close below the line and both finish in the bottom 7% of a 4.50 range. Convention 2 fires in both. Only B carries the volume condition: 880,000 shares is 1.51 times its prior average, while C’s 640,000 is 1.10 times. Convention 4 fires in B and not in C. Convention 3 is still waiting for week 15.
Look at what separates B from C at the week-14 close. The close position is identical, the distance below the line is similar (1.13% against 1.67%), and the only visible difference is volume. Heavy volume on a close below the line is evidence of selling pressure. It doesn’t establish what happens next.
Week 15: where the paths separate
| Week 15 | High | Low | Close | 10-week avg | Weekly change in avg |
|---|---|---|---|---|---|
| A | 53.40 | 50.90 | 53.00 | 51.40 | +0.79 |
| B | 51.60 | 48.70 | 49.10 | 50.87 | +0.40 |
| C | 52.20 | 49.00 | 51.80 | 51.11 | +0.67 |
Scenario B closes at 49.10, below week 14’s 49.60 low, so convention 3 fires there. Scenario C trades to 49.00 intraday, which is also below its week-14 low of 49.30, yet closes at 51.80, back above the average. Under convention 3 as written, that’s no confirmation, because the condition is a close. A trader who quietly treated the intraday undercut as confirmation would have switched to a different rule mid-trade.
The slope adds context without settling anything. B’s average rose 1.06 in week 13, 0.63 in week 14 and 0.40 in week 15. A’s slowed only from 1.06 to 0.79. A flattening line describes closes already in the past, so it can only confirm what the closes have shown.
Week 16 and the annotated comparison
By week 16, scenario A closes at 55.40, scenario C at 54.90, and scenario B at 47.50, 6.77% below an average that rose just 0.08 that week. The table records each convention against each path, with the exit price and its distance from the 55.60 peak close.
| Convention | A: support test | B: confirmed deterioration | C: break and recovery |
|---|---|---|---|
| 1. Intraday breach | Week 14 at 49.84 (-10.36%) | Week 14 at 49.84 (-10.36%) | Week 14 at 49.84 (-10.36%) |
| 2. Weekly close | No signal | Week 14 at 49.90 (-10.25%) | Week 14 at 49.60 (-10.79%) |
| 3. Close plus price confirmation | No signal | Week 15 at 49.10 (-11.69%) | No signal |
| 4. Close plus volume | No signal | Week 14 at 49.90 (-10.25%) | No signal |
Scenario A shows the cost of the tightest convention. Convention 1 exited at 49.84, and two weeks later the stock closed at 55.40, 11.16% higher. The orderly support test had the features traders often associate with one: lighter volume (0.79 times and then 0.77 times the prior average), a week-14 close at 40% of its range and a week-15 close near the top of its range, and a line that kept rising by 0.77 to 0.87 a week.
Scenario B shows the cost of the slowest one. Convention 3 waited a week for confirmation and gave back 11.69% from the peak close instead of 10.25%. Holding through all four weeks would have left 14.57%. Scenario C splits the conventions. Conventions 1 and 2 both exited in week 14, and the stock finished week 16 at 54.90, 10.15% above convention 1’s 49.84 exit and 10.69% above convention 2’s 49.60 exit. Conventions 3 and 4 held through the break.
No single convention is right in all three columns. The tighter rules handle B well and pay for it in A and C. The rules with extra conditions sit through A and C and give back more in B.
When a gap moves past the level
Any exit level assumes the market trades through it. A sharp event-driven gap can skip it entirely. Return to week 12: the stock closes at 55.60 with the completed average at 48.78. Under convention 1, 48.78 is the reference for week 13, a planned giveback of 12.27% from the close. Suppose an earnings report lands over the weekend and the stock opens Monday at 45.20. The first available trade is 3.58 below the reference, a 7.34% shortfall, and the giveback from 55.60 is now 18.71%.
The close-based conventions face the same gap and may wait longer still, since they act only on Friday’s close. For a trailing exit, an exit level is a plan for continuous trading, and gaps are where that assumption fails.
Where this exit sits among the holding rules
Several of the site’s rules govern the same position at different stages, and each answers a different question. Treating the 10-week line as if it did the job of an earlier rule mixes those questions together.
| Stage | Rule | Reference price | Question it answers |
|---|---|---|---|
| Just after entry | Initial maximum loss | The purchase price | How much can this trade lose before the idea is judged wrong? |
| First weeks, fast advance | Eight-week hold | The breakout pivot | Should a pre-set profit target be suspended after unusual early strength? |
| First test of the line | First pullback read | The 10-week line | Does the trend’s first real pause look orderly? |
| Any time in profit | Profit cushion | Cost and current price | How much current equity is exposed? |
| Established advance | 10-week trailing exit | The 10-week line | Has price behavior weakened enough to end the hold? |
The 7-8% stop loss rule is measured from the fill and caps an early loss. The 10-week line is measured from the market’s recent closes and protects open gains, so the two can sit far apart: in the example, a 7% stop under a hypothetical entry at the week-2 close of 41.30 would be 38.41, far below the 48.78 line at week 12. The eight-week hold rule concerns not taking profits too soon after a fast start, a separate question from when weakness ends a hold. And the profit cushion is a reminder that every row of the comparison table above is equity already earned and now at risk, even where the exit price is still well above cost.
The growth-stock tradition associated with William O’Neil uses the 10-week and 50-day lines as holding references alongside volume and market direction. That framework presents the line as one input among several.
What the 10-week line can’t tell you
Moving averages lag by construction. The scenario-B line was still rising in week 16, two weeks after the first close below it, because it still held the strong closes of weeks 7 to 12.
Sideways markets produce repeated crossings. A hypothetical flat stock closing between 49.60 and 50.50 sees its average sit between 50.01 and 50.05, and over six weeks it closes below the line three times, each time recovering the next week. Every one of those closes satisfies convention 2.
Weekly confirmation can allow substantial giveback. In scenario B, every convention exited more than 10% below the peak close, and that’s in an example where the advance was 13.98% above the line at its high. A wider extension leaves a wider gap between peak and line.
No convention consistently identifies the final top. Scenario A’s dip and scenario B’s breakdown looked alike at the week-14 low, and B and C were separated at the week-14 close only by volume.
Choosing the convention before the test arrives
The three scenarios share their first thirteen weeks, so nothing in the history could have told a reader which path was coming. What a reader can control is the convention, and the comparison shows what each one costs: the intraday breach trades early exits in support tests for protection in breakdowns, and the confirmation rules reverse that trade. A trader using a 10-week trailing exit might write the convention down before the line is tested, including whether a weekly close, a following week or a volume threshold is required. Then the week-14 decision is already made, and the remaining work is checking which condition the completed week actually met.
Learn the pattern. Ride the trend. Keep the gains.
Educational content only. Not investment advice. Trading involves risk. You are responsible for your decisions.
Get the free Market Wisdom e-book
Join Trends and Breakouts — historical winners, breakout studies, and risk lessons. No spam, unsubscribe anytime.