
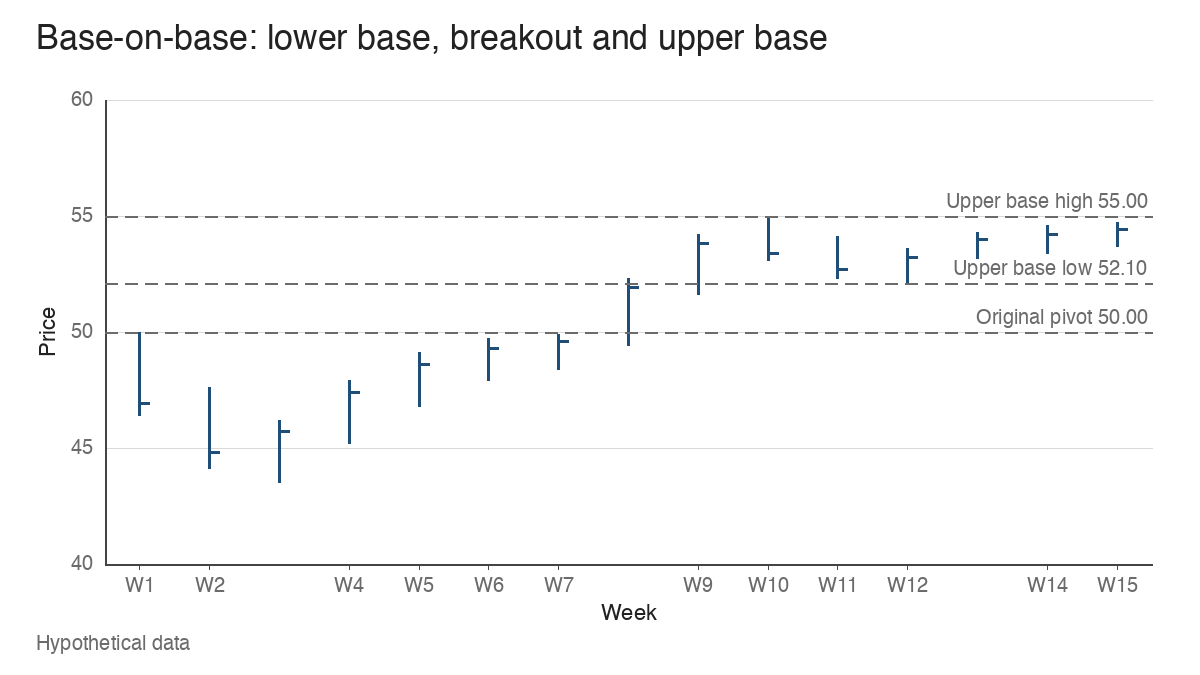
Take a hypothetical stock that spends seven weeks building a base between 43.50 and 50.00, clears 50.00 in week 8 and closes that week at 51.90. Two weeks later it reaches 55.00, exactly 10% above the old high, and then it stalls. For the next six weeks it trades between 52.10 and 55.00 and never returns to the earlier range. Chart readers in the growth-stock tradition call this a base-on-base pattern: a second consolidation built directly above the first, with only a short advance in between. The shape of each base matters less here than how the two relate, and that relationship is what this guide follows. Every price, range and volume figure below is hypothetical.
The five parts of a base-on-base pattern
Before reading the sequence, it helps to name each piece, because most misreads come from blurring two of them together.
| Component | In the example | What it describes |
|---|---|---|
| Lower base | Weeks 1 to 7, low 43.50, high 50.00, 13.0% deep | The first consolidation after a prior advance |
| Original pivot | 50.00 | The high of the lower base, the level a breakout had to clear |
| Intervening advance | 50.00 to 55.00, a 10.0% move over three weeks | The limited progress after the breakout |
| Upper consolidation | Weeks 10 to 15, between 52.10 and 55.00, 5.27% deep | The pause that forms above the lower base |
| Upper base reference | 55.00 | The high of the upper consolidation, a potential breakout level |
The lower base here is shaped much like a flat base, though it could equally have been a cup-with-handle. What turns the sequence into a stack is the last row read against the second: the upper consolidation’s low at 52.10 sits 4.2% above the original pivot. The new pause never gave back the breakout.
Revealing the chart in stages
A finished chart makes every stack look obvious. The fair test is what could be said at each week with only the bars printed so far.
| Stage | What the chart shows | What can fairly be said |
|---|---|---|
| End of week 8 | A close at 51.90, 3.8% above the 50.00 pivot | A breakout from the lower base. Nothing about a second base yet. |
| End of week 10 | A high at 55.00, then a close at 53.40 | The advance has paused after 10.0%. That’s an ordinary hesitation. |
| End of week 12 | A low at 52.10, still above 50.00 | A developing pause that has held above the original pivot. Its boundaries aren’t settled. |
| End of week 15 | Six weeks inside 52.10 to 55.00, closes of 54.00, 54.20 and 54.40 | An upper base with a definable floor and ceiling. The pattern is in place; its outcome isn’t. |
Week 12 is where the temptation sits. Two or three weeks of sideways trade after a breakout can resolve in several directions, and calling it an upper base at that point borrows information from weeks that haven’t happened. By week 15 the evidence is different in kind. The floor at 52.10 has held for three further weeks, the last three closes sit within 1.82%, 1.45% and 1.09% of the 55.00 high, and the weekly ranges have narrowed from 1.90 to 1.00.
Why a stacked base can read as digestion
The usual explanation for a base-on-base is digestion. A stock breaks out, but the advance gets interrupted, often because the broader market starts correcting at about the same time. William O’Neil’s work on growth-stock bases describes this setting: a stock that can’t make progress while the indexes pull back, yet refuses to fall back into its old range. The upper base becomes a holding pattern in which the earlier advance gets absorbed.
That reading is plausible. It isn’t proven by the chart. Price action shows where trades printed and how far they moved, and it can’t tell you who is accumulating shares and who is distributing them. The tight closes near 55.00 are consistent with patient buyers absorbing supply, and they’re equally consistent with a lack of interest on both sides. A trader who wants more than the price record would look at the market’s own trend, the stock’s relative strength line and its group before treating the stack as anything more than a description.
Volume adds a layer, still without settling the question. In the example, the lower base averaged 6.04 million shares a week. The breakout week printed 10.8 million, 1.79 times that average. Through the upper base, weekly volume fell from 7.1 million to 4.1 million, averaging 5.25 million, and the final week ran at 38.0% of the breakout week. Shrinking volume inside a narrowing range fits the digestion story. It describes reduced activity, and reduced activity alone says nothing about direction.
Measuring each component without one threshold
Published descriptions of the pattern often quote numbers for depth and duration. Those figures come from particular studies and periods, and treating any one of them as a universal cut-off produces both false positives and missed structures. The better habit is to measure each component and read the measurements together.
| Measure | Lower base | Upper base | How the pair reads |
|---|---|---|---|
| Depth | 13.0% | 5.27% | The upper pause is far shallower than the first |
| Duration | 7 weeks | 6 weeks | Both lasted long enough to form a floor and a ceiling |
| Weekly range | 3.60 narrowing to 1.50 | 1.90 narrowing to 1.00 | Each base contracts as it matures |
| Daily range, final week | Not measured | 0.51 average, 0.94% of the 54.40 close | Quiet sessions near the top of the range |
| Volume | 6.04 million average | 5.25 million average, ending at 4.1 million | Activity faded after the breakout surge |
| Market setting | Not specified | Not specified | A required input the price series can’t supply |
A common misread is to grade the upper base against the same depth expectation as the lower one. A 5.27% pause after a 10.0% advance is proportionate. The same 5.27% after a 40% advance would be a different event, and an 18% upper base after a 10% advance would have given back nearly everything the breakout gained. Depth means something only relative to the move that preceded it.
The market setting row is left blank deliberately. A stack that forms while the indexes correct shows a stock holding up under pressure. The identical price path during a calm, rising market shows a stock that couldn’t keep pace, and that is a weaker reading of the same bars.
Three sequences that resemble a stack
Several structures share the first half of the story: a breakout from a lower base followed by a pause. What separates them is where the pause sits relative to the original range.
| Sequence | Hypothetical path | Relationship to the lower base | Reading |
|---|---|---|---|
| Breakout falls back | Peak at 55.00, then a drop to 48.60 | Low is 2.8% below the 50.00 pivot, back inside the lower base | A failed breakout, with the old range reabsorbing price |
| Overlapping consolidations | Peak at 53.20, then a pullback to 48.80 | The second range overlaps the first; its low is 2.4% under 50.00 | One wider structure from 43.50 to 53.20, 18.23% deep |
| Extended advance, later base | Run to 66.00, then a base between 60.00 and 66.00 | The new low sits 20.0% above the pivot after a 32.0% advance | An independent base, too far from the first to share its context |
| Base-on-base | Peak at 55.00, pause between 52.10 and 55.00 | Low is 4.2% above the pivot after a 10.0% advance | Two structures stacked with a short gap |
The overlapping case trips up readers most often. When the second pause dips below the original pivot, the two consolidations share price territory, and calling them two bases double-counts what is really one longer, deeper base with a false start in the middle. The extended case fails the other way: after a 32.0% run, the base between 60.00 and 66.00 stands on its own, and the 50.00 pivot has become history rather than structure.
Orderly development versus widening swings
The same upper-base window can develop in two very different ways. Below, the orderly version from the example sits alongside a hypothetical loose version that starts from the same 55.00 high.
| Week | Orderly low | Orderly range | Loose low | Loose range |
|---|---|---|---|---|
| 10 | 53.10 | 1.90 | 53.10 | 1.90 |
| 11 | 52.30 | 1.80 | 51.90 | 2.50 |
| 12 | 52.10 | 1.50 | 51.20 | 3.60 |
| 13 | 52.60 | 1.70 | 50.30 | 3.60 |
| 14 | 53.40 | 1.20 | 49.70 | 4.80 |
| 15 | 53.70 | 1.00 | 49.20 | 4.40 |
In the orderly path, the low set in week 12 holds and the next three lows step up to 52.60, 53.40 and 53.70. In the loose path, every week undercuts the one before, and in week 14 the low of 49.70 breaks the original pivot. By week 15 the loose structure is 10.55% deep, its weekly range has more than doubled from 1.90 to 4.40, and its final week averaged daily ranges of 1.76, about 3.49% of a 50.40 close against 0.94% in the orderly case.
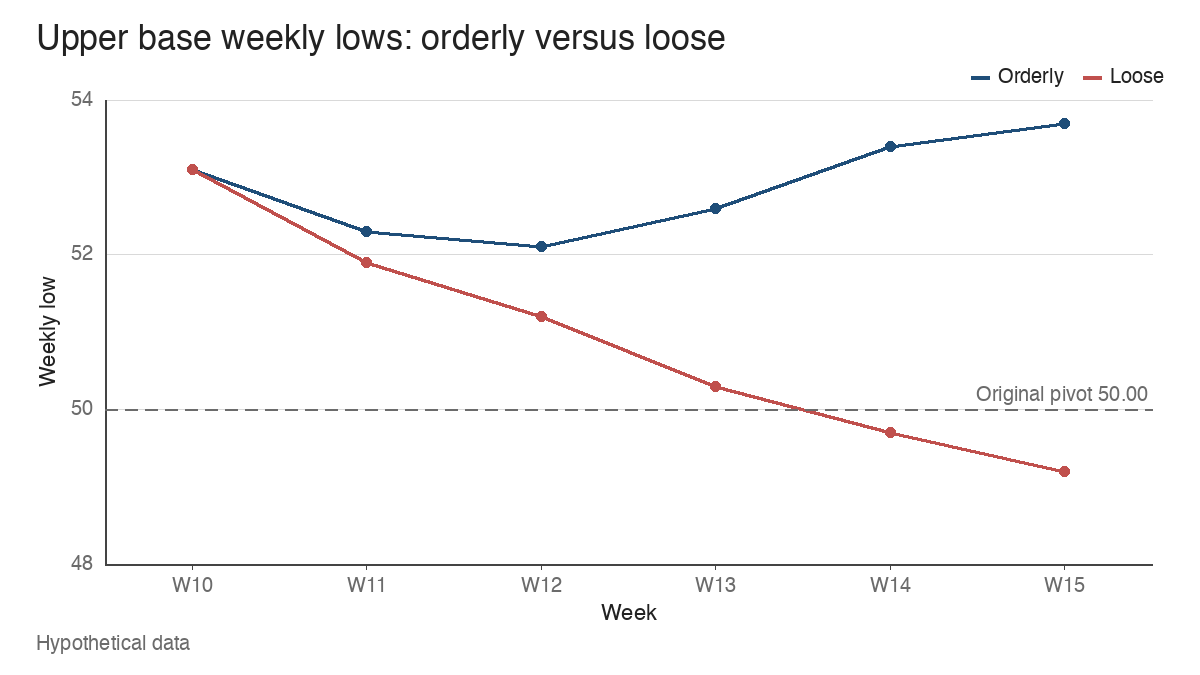
I’d read week 14 in the loose path as the point where the stack stopped being a stack. Once price trades back under 50.00, the upper consolidation overlaps the lower base, which puts it in the second row of the comparison table above. A later recovery would build a new structure on top of a damaged one.
The original pivot keeps its job
Once the upper base forms, its 55.00 high becomes the more immediate chart reference. The 50.00 pivot still marks the level the upper base has to keep holding for the stack to remain intact, and it measures how far the stock has already travelled. A common convention treats a move more than 5% beyond a pivot as extended, which put the lower base’s zone at 50.00 to 52.50. The upper base gives a reader who missed that zone a fresh reference at 55.00, but 55.00 is still 10.0% above the original breakout and 26.44% above the lower base’s 43.50 low. A stack moves the reference point up. It doesn’t make the stock any less advanced.
The same logic applies to supply. Shares bought between 52.10 and 55.00 during the upper base are close to the reference, so a failed attempt at 55.00 can leave recent buyers under water quickly. Older overhead supply above the lower base has, in this example, already been cleared on the way through 50.00.
Stacking also leaves the stock’s position in its trend unchanged. In Stan Weinstein’s stage terms, a sideways pause above a prior breakout keeps the stock in the advancing stage while the upper base forms. For base counting, conventions differ on whether the upper base counts as the next base or whether the pair counts as a single step, but neither convention resets the count. A count usually resets only after price undercuts an earlier base’s low, and a stack, by construction, stays above it.
Where the stacked structure stops helping
The boundaries in this guide are tidy because the data were written to be tidy. On a real chart, where the lower base ends and where the upper one begins is a judgement call, and two careful readers can draw the 52.10 floor or the 55.00 ceiling a little differently. An upper base that looks orderly at week 15 can still fail at week 16, and the loose path above shows how few weeks it takes for a stack to dissolve into an overlapping range.
What the pattern offers is context: a stock that broke out, paused without surrendering the breakout, and contracted while it waited. It doesn’t establish that demand will return above 55.00, and it doesn’t by itself describe a suitable trade. A trader using this pattern might treat it as one input alongside the market’s direction, the stock’s relative strength and the volume on any move through the upper reference.
Learn the pattern. Ride the trend. Keep the gains.
Educational content only. Not investment advice. Trading involves risk. You are responsible for your decisions.
Get the free Market Wisdom e-book
Join Trends and Breakouts — historical winners, breakout studies, and risk lessons. No spam, unsubscribe anytime.