
A stock spends seven weeks inside a flat base between 44.50 and 50.00, then closes at 51.85 on volume 1.9 times its 50-day average. Two sessions later it prints 54.40. Then it drifts back. By day 7, counting the breakout session as day 1, it trades at 49.70, a little under the old ceiling, and every trader watching the chart wants to know whether this is a normal return visit or the start of a failure. That return visit is a breakout retest, sometimes called a throwback, and the honest answer on the day it happens is that nobody knows yet. What a trader can do is describe it precisely enough that the next few sessions become readable.
Fix the pivot before the breakout retest begins
Every retest is measured against a boundary, so the boundary has to be set before the return starts. In the example, the base topped at 50.00 several times, and that level is the pivot. It was the reference on the breakout day, and it stays the reference afterwards.
The common error is quieter than it sounds. Once price slips to 49.70, it’s tempting to decide that the “real” boundary was the 49.50 area all along, or to redraw the top of the base through a different swing high so the stock still looks like it’s holding. That habit moves the line to fit the outcome, and it destroys the one thing a retest analysis needs: a fixed yardstick. A trader who writes the pivot down on the breakout day, along with the base low of 44.50 and the base depth of 11.0%, has something the chart can’t argue with later.
The same applies to the breakout close. At 51.85 it sat 3.7% above the pivot, and the 54.40 high stretched the move to 8.8%. Those two numbers matter for the retest, because a stock that ran far from its base has more ground to give back before it ever touches the boundary. The site’s guide to how far price extends from a breakout pivot covers that distance in more detail.
Why a cleared boundary can attract attention
The textbook line is that old resistance becomes new support. The mechanics behind it are plausible, and they’re worth stating carefully. While the stock sat under 50.00, sellers repeatedly met demand there and won. Some holders who bought near the top of the base may have wanted to exit at breakeven, and that supply was part of what capped the range. When price cleared 50.00 on heavy volume, a portion of that supply was absorbed. Traders who missed the breakout now have a visible reference price, and holders who bought the breakout have a reason to care whether it holds.
None of that can be read off a chart directly. Price and volume record that transactions happened at certain levels and in certain quantities. They don’t record why. A quiet return to 50.00 is consistent with buyers defending the level, and it’s equally consistent with sellers simply having paused. The guide to support and resistance zones explains why these levels behave as areas rather than exact prices, and that’s the right frame here. The 50.00 pivot marks an area of interest and promises nothing about what happens next.
This is also where “institutional support” gets overused. A light-volume pullback that holds the pivot fits the idea that large holders aren’t selling. It doesn’t prove that anyone large is buying.
What to measure during the return
Five observations do most of the descriptive work. Each is compared with the stock’s own recent behaviour, since a volume figure that’s heavy for one stock is routine for another.
- Depth: how far price has come back from the post-breakout high, and whether it has reached, touched or crossed the pivot.
- Time: how many sessions the retreat has taken, and how many closes, if any, have printed below the pivot.
- Daily range: whether the down days are narrowing or widening compared with the up days of the advance.
- Closing location: where each close sits inside that day’s range, from the low (0.00) to the high (1.00).
- Volume: each session’s volume divided by the 50-day average, here 820,000 shares.
In the shared part of the example, the three advancing sessions averaged 1.78 points of range and 1.57 times average volume. The four retreating sessions that followed averaged 1.17 points of range and 0.82 times average volume. On those numbers the pullback was smaller and quieter than the move that preceded it. That’s contextual evidence, and none of these items is a mandatory ingredient. Plenty of sound retests break one of them, and plenty of failures tick every box for a day or two. For a fuller treatment of the volume side, see the guide to reading volume on a price chart.
Session 7: the point where both charts look the same
Here is the shared sequence, day by day, as a trader would have seen it. All figures are hypothetical.
Day 1 closed at 51.85, near the top of its range. Day 2 closed at 52.90 on 1.51 times average volume. Day 3 reached 54.40 but closed at 53.10, in the lower quarter of the day’s range, which was the first sign of hesitation. Days 4, 5 and 6 drifted lower to closes of 52.30, 51.40 and 50.70, each on volume below the 50-day average and each closing in the lower third of its range.
Day 7 is the first return to the pivot. It traded down to 49.70, 0.6% under 50.00, then closed at 50.55. That close sat at 0.71 of the day’s range, on 0.78 times average volume. From the 54.40 high, the low represented an 8.64% retreat over four sessions.
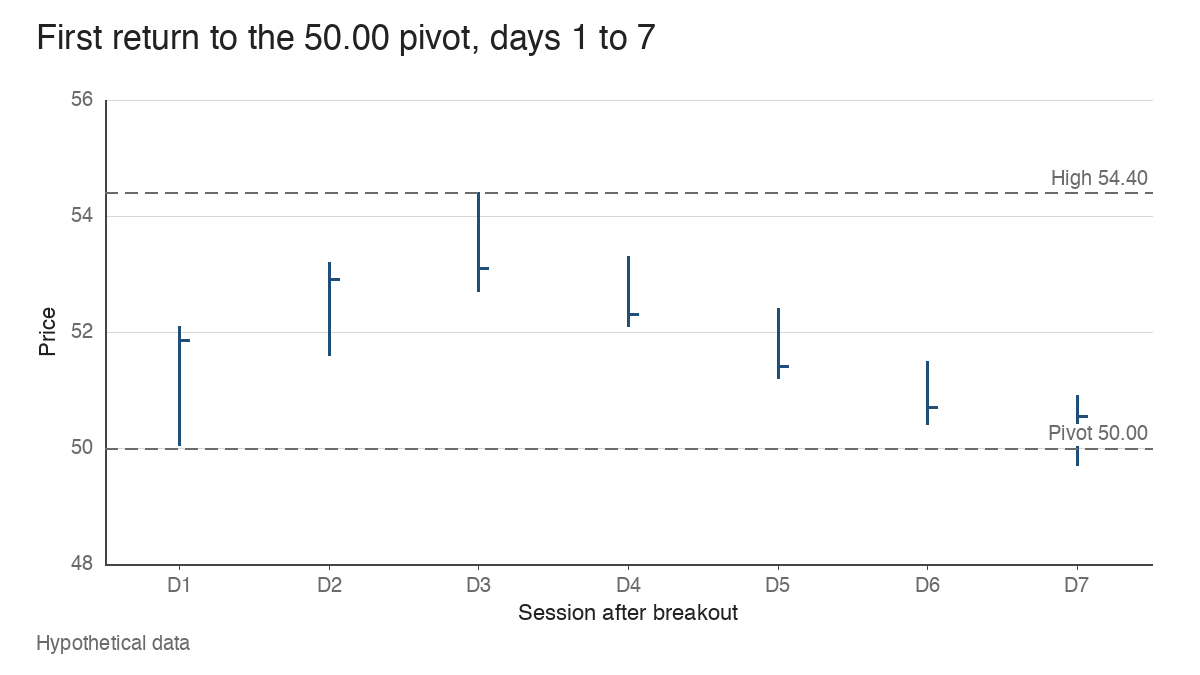
A reasonable reading on the evening of day 7 is that the stock tested the boundary, dipped through it intraday and recovered back above it on light volume. A reasonable counter-reading is that four straight down closes have handed back the whole breakout leg and the next session could easily continue the slide. Both readings fit the same seven bars. The two sequences below start from exactly this point.
Sequence A: the return stabilises
Day 8 traded between 50.10 and 51.10 and closed at 50.95. Its low held above the pivot, the close sat at 0.85 of the range and volume dropped to 0.63 times average. Day 9 looked similar: a 1.10-point range, a close of 51.25 near the high, 0.68 times average volume.
Two quiet, narrow sessions that close near their highs while holding above 50.00 are too little to confirm a resumption, though they change the description. The stock has stopped making lower closes, and the selling that carried it from 54.40 hasn’t expanded.
Day 10 is where the sequence starts to declare itself. Range widened to 1.50 points, the close of 52.45 came at 0.90 of the range and volume rose to 1.44 times average. Days 11 and 12 followed with closes of 53.70 and 54.70, and day 12 traded at 54.90, 0.50 above the earlier 54.40 high. Across days 10 to 12, volume averaged 1.34 times the 50-day figure, against 0.66 on days 8 and 9.
Looking back, the retest holds together neatly: a quiet return, a brief intraday dip, two tight sessions and a resumption on rising volume. Day 7 couldn’t show any of that.
Sequence B: more time below the boundary
Day 8 opened the other path. It traded between 49.40 and 50.80 and closed at 49.60, the first close below the pivot. The close sat at 0.14 of the range, and volume rose to 1.20 times average, the heaviest session since day 3.
One close under 50.00 is a warning and nothing more. Day 9 offered a partial recovery to 49.80 on 0.85 times average volume. Day 10 then rallied intraday to 50.30, failed to hold it and closed at 49.45, again in the bottom of its range. The stock had now tried and failed to close back above the boundary.
Days 11 and 12 removed most of the ambiguity. Closes of 48.35 and 47.80 came on 1.40 and 1.29 times average volume, with each close in the lowest fifth of its range. The day 12 close sat 4.4% under the pivot and just 0.55 above the base midpoint of 47.25. The stock had five straight closes below 50.00, its four down days carried an average of 1.20 times normal volume and its one up day carried 0.85.
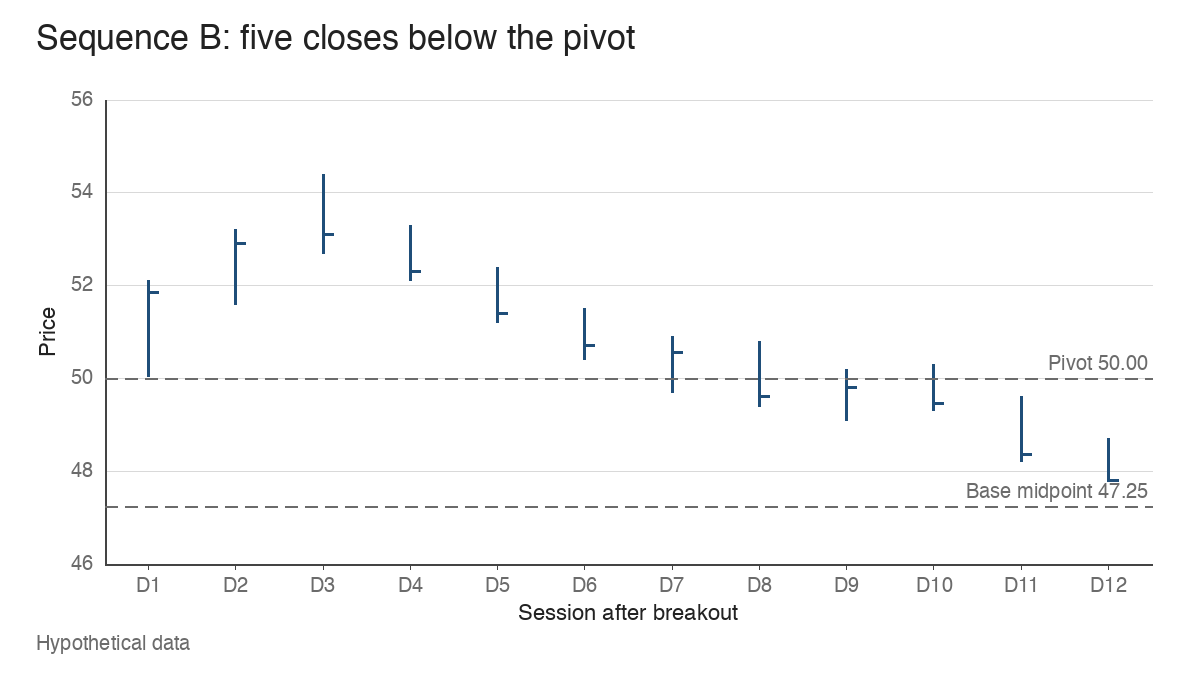
Sequence B doesn’t automatically become a completed failure at any single bar, and it would be a misread to pick one and call it the moment. The useful description is cumulative: more sessions below the boundary, closes drifting toward the lower half of the old base and heavier volume on declines than on advances. What happens after a breakout fully fails, and how traders handle it, is the subject of the guide to failed breakouts and their warning signs. This article stays with the return visit itself.
A brief penetration versus trading back inside the base
The distinction that separates the two sequences is how price behaved around the line, more than how far it went. Day 7 in both versions printed 49.70, below the pivot. Sequence A never closed below 50.00. Sequence B closed below it five times in a row.
That’s the practical difference between an intraday penetration and sustained trading back inside the base. A penetration is a low through the boundary followed by a close back above it, ideally with the close in the upper part of the range. Sustained trading inside the base means closes under the boundary that repeat, with failed attempts to reclaim it, as day 10 showed in Sequence B.
Many traders look for a fixed allowance here, such as a set percentage below the pivot that still “counts”. There isn’t a universal number. A 0.6% dip means one thing in a stock with a 1.17-point average daily range and something else in a stock that routinely moves 5% a day. Any threshold a trader uses is a personal rule fitted to the stock’s volatility, and it should be written down before the retest, for the same reason the pivot is.
Growth-stock traders in the tradition of William O’Neil built their method around the base, the pivot and the volume on the breakout, which is why the behaviour of price on a return to that pivot gets so much attention. The pivot was the reason for the trade, so the pivot is where the evidence gets weighed.
Where the retest reading runs out
The framework has limits, and they’re worth knowing before relying on it.
Strong advances often never retest at all. A stock that clears its pivot on heavy volume and keeps going leaves no return visit to study, and a trader who insists on waiting for one may watch the whole move from the sidelines. A return visit is one possible path after a breakout, and nothing obliges price to take it.
Apparent support can fail abruptly. Sequence A’s day 8 and day 9 looked orderly, and Sequence B’s day 9 looked like a recovery. An orderly-looking sequence can turn in a single session, and nothing in the first two days after a touch rules that out.
Outside events can overwhelm the whole picture. An earnings report can gap a stock from 51.00 to 46.00 overnight, skipping the pivot entirely and leaving no intraday test to read. Broad market weakness does something similar more slowly: when the major indexes are under distribution, many individual retests fail together, whatever their own volume and closing patterns looked like. A retest is always read inside the market it’s happening in.
Describing a retest stage by stage
The cleanest way to use this is as a written description that grows with the chart, using only the information available at each point.
- Before the breakout: record the pivot, the base low and the base depth. Here, 50.00, 44.50 and 11.0%.
- On the breakout: record the close, its distance from the pivot and its volume ratio. Here, 51.85, 3.7% and 1.9 times.
- During the return: track depth from the high, sessions elapsed, average range and volume against the advance. Here, 8.64%, four sessions, 1.17 points and 0.82 times.
- At the touch: note whether the low crossed the pivot and where the close landed. Here, 49.70 and a close at 0.71 of the range above 50.00.
- After the touch: count closes below the pivot, note failed attempts to reclaim it and compare volume on down days with up days.
The description records only what the chart has shown at each stage, measured against a boundary that was fixed before the outcome was known. Read that way, Sequence A and Sequence B were indistinguishable on day 7 and clearly different by day 12, and that gap is exactly what a retest asks a trader to wait through.
Learn the pattern. Ride the trend. Keep the gains.
Educational content only. Not investment advice. Trading involves risk. You are responsible for your decisions.
Get the free Market Wisdom e-book
Join Trends and Breakouts — historical winners, breakout studies, and risk lessons. No spam, unsubscribe anytime.