On 14 May 2020, the day GrowGeneration released its first-quarter results, GRWG opened at 4.81, dipped to 4.53 and then closed at 5.45 on 1,300,848 shares, 4.6 times its 20-day average volume. That close cleared the 5.14 pivot set on 5 May. When GRWG shows up on traders’ screens again, this is the chart worth studying. In short: a mid-May 2020 GRWG base breakout that moved 741.5% from the entry close to the exit close in 287 calendar days.
Key takeaways from the GRWG base breakout
- The pattern: a 61.4%-deep base from a 6.78 high on 18 February 2020 to a 2.62 low on 16 March, with a 5.14 pivot from 5 May.
- The entry day closed at 5.45, above that pivot, on volume 4.6 times the 20-day average.
- The move: 741.5% from the 5.45 close to a 45.86 exit close in 287 calendar days, after a 67.75 peak on 10 February 2021.
- Six add-on points followed, from an 8.52 close on 29 July 2020 to a 51.05 close on 2 February 2021.
- The lesson: the 10-day and 20-day lines both broke in June 2020, while price didn’t close below its 50-day line until the exit day.
| Field | Value |
|---|---|
| Ticker | GRWG |
| Breakout date | 2020-05-14 |
| Breakout close (entry reference) | 5.45 |
| Volume vs 20-day average | 4.6x |
| Exit date | 2021-02-25 |
| Exit close | 45.86 |
| Price change, entry close to exit close | 741.5% |
| Calendar days | 287 |
| Peak before exit | 67.75 (2021-02-10) |
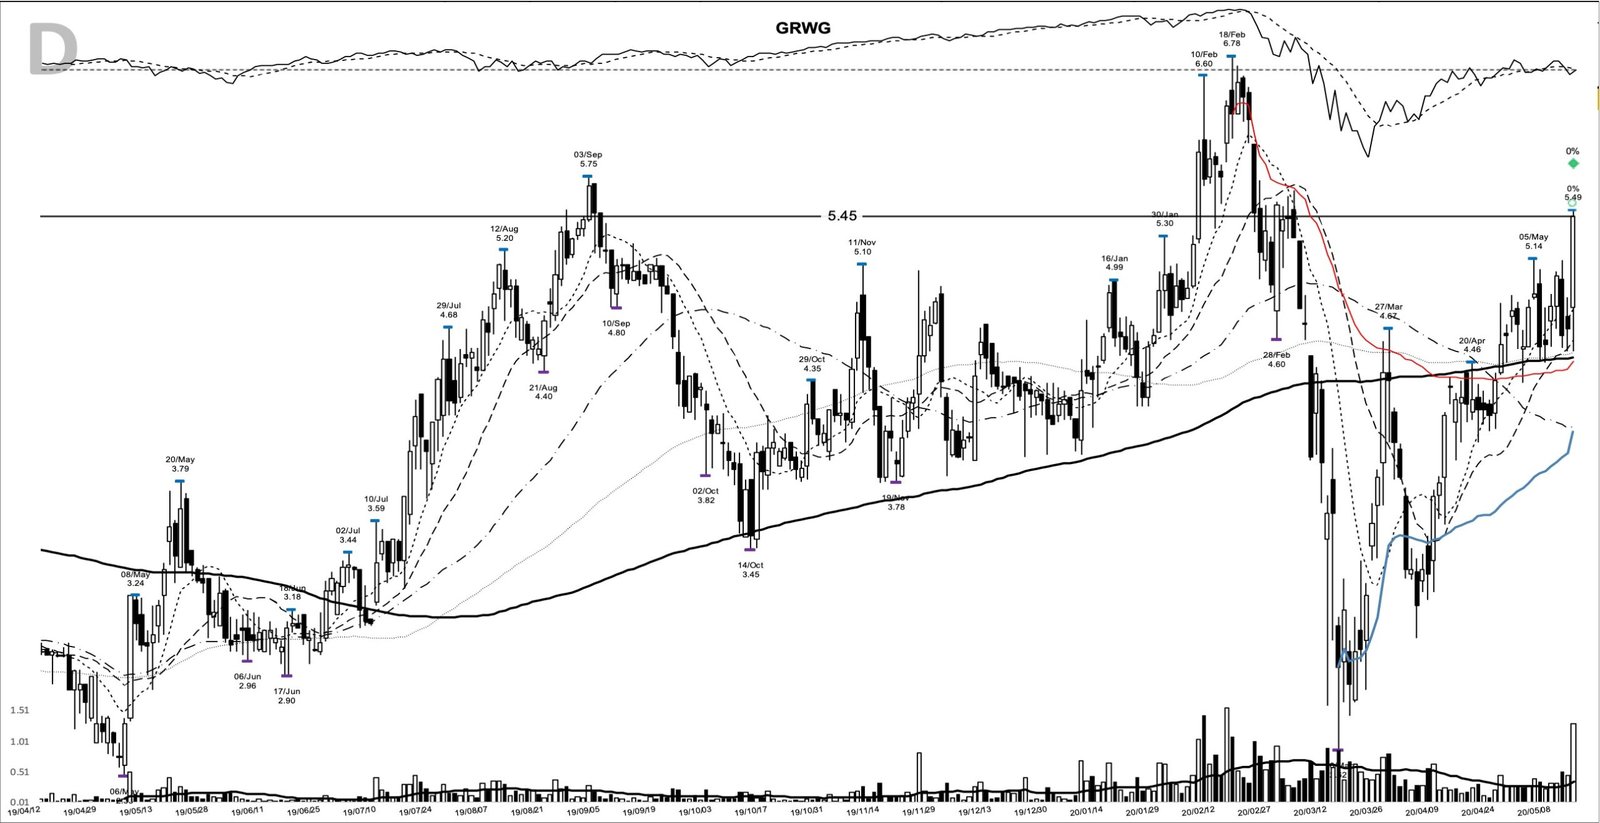
Inside the GRWG base: from 6.78 down to 2.62, then up to the 5.14 pivot
The charts here come from my study archive, and the entry chart shows a stock that had already done a lot of work before May. GRWG reached 6.78 on 18 February 2020, a few weeks before the COVID crash. By 16 March it had traded down to 2.62. That’s a 61.4% drop from top to bottom, deep enough to put this in wide-and-loose base territory rather than a textbook cup.
The recovery came fast. Price bounced to a 4.67 high on 27 March, slipped back to a 3.06 low on 3 April, and then climbed steadily through April. On the chart the late-April bars sit above the thick 200-day line, with the shorter averages curling up underneath price.
The right side tightened in early May. The 5 May session reached 5.14 and closed at 4.90. Two days later the low was 4.46, which became the shelf. On 12 May price tried again, hit 5.13 and closed at 4.63 on 506,429 shares, a rejection right at the pivot.
Then came 14 May. The bar opened at 4.81, held a 4.53 low and closed at 5.45, near its 5.49 high and 6.0% above the pivot. The close cleared the pivot on the day, so this was a confirmed breakout, and volume ran 4.6 times the 20-day average of 284,187 shares.
GrowGeneration in 2020: lockdown gardeners, cannabis growers and a GAAP loss
GrowGeneration ran a chain of hydroponic and organic garden-supply stores selling to commercial cannabis growers and home gardeners. Its 14 May release reported first-quarter revenue more than double the prior year, higher same-store sales, record online sales in April and a raised full-year revenue outlook.
Earnings told a messier story. SEC filings show quarterly EPS of 0.01 in the first quarter of 2019, 0.03 in the second and 0.03 in the third. The first quarter of 2020 came in at a loss of 0.06. The company attributed the loss mainly to non-cash share-based compensation tied to new executive agreements, which explains it but doesn’t change the number. In the model-book frame, where William O’Neil looked for accelerating earnings into a breakout, GRWG went in with sales doing the work.
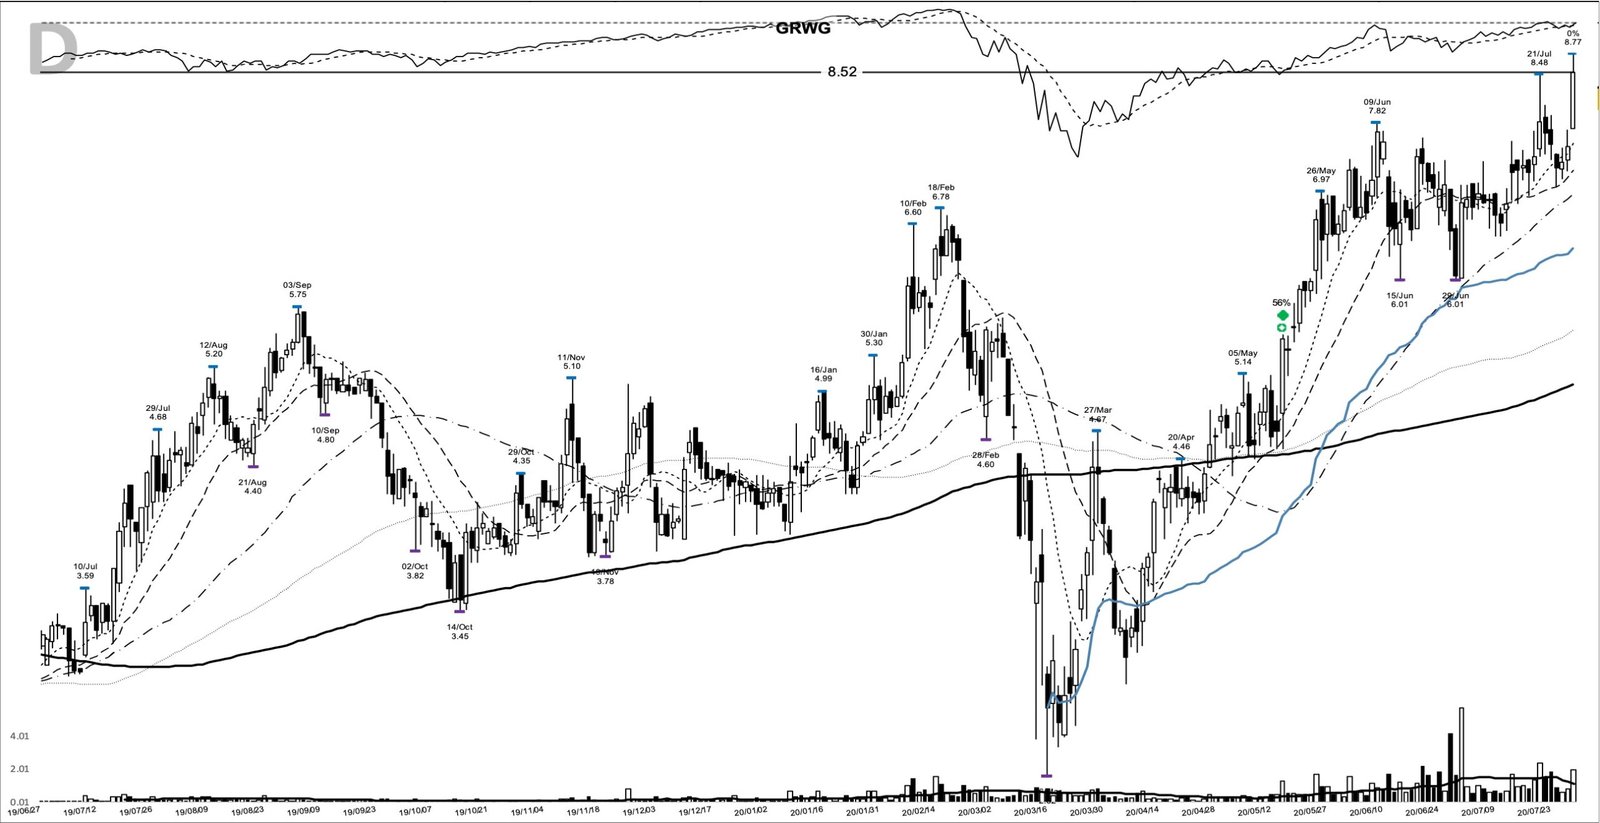
Through the summer the narrative was pandemic gardening plus a growing US cannabis market. By late July the stock had pulled back and tightened under an 8.48 high from 21 July. The 29 July close at 8.52 cleared it on 1.54 times average volume, and that was the first add-on point.
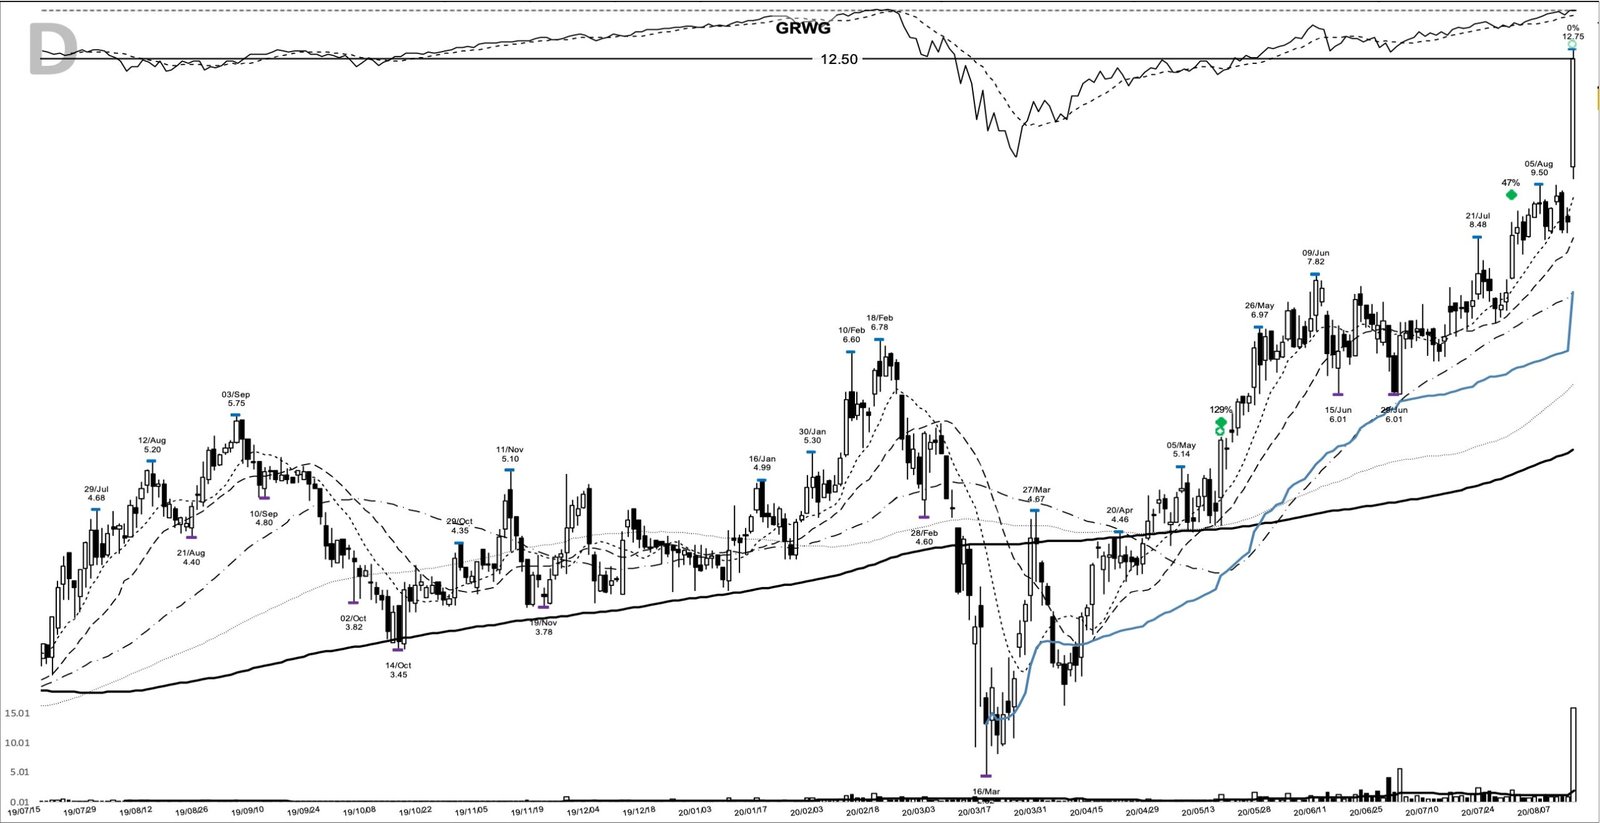
The second came with second-quarter results on 13 August. Sales had more than doubled again and GAAP net income was positive. The stock opened at 9.88, 12.8% above the prior 8.76 close, and finished at 12.50 on 15,809,034 shares, 14.0 times its 20-day average. That’s the kind of volume that sets an earnings gap apart from an ordinary pop.
The May 2020 tape: a Nasdaq back in the black
A week before the entry, on 7 May, the Nasdaq Composite erased its losses for 2020, led by large technology and stay-at-home names, according to Reuters coverage that day. The market was paying for businesses that lockdowns helped, and a garden-supply retailer with doubling sales fit that theme. GRWG’s breakout came with the index already recovered, the backdrop a trader checking market direction with a tool like the follow-through day would want.
Preparing for the 5.14 pivot: posture, shelf and a written plan
The trend posture on 14 May was fresh. Price closed above its 10-day moving average for the first session in this stretch, with the 10-day at 4.80, the 20-day at 4.60 and the 50-day at 4.08, stacked in order. The close sat 13.5% above the 10-day, already a stretch for a first day.
Three things would have put GRWG on a watchlist before the breakout. The stock had recovered most of the March crash while the 5.14 pivot and the 4.46 shelf defined a tight right side. The 12 May rejection showed exactly where supply sat. And the first-quarter report date was known, so the catalyst was on the calendar.
A written plan for that day might have read like this. Entry above the 5.14 pivot from 5 May. An initial stop below the 4.46 shelf low from 7 May, 13.2% under the pivot and 18.2% under the 5.45 close. The 2.62 base low from 16 March was where the structure failed, 51.9% away, far too wide to use. Then trail the 10-day moving average, widening to the 20-day once the stock was well advanced.
From 5.45 to 67.75: six adds and the 50-day line
A trader using this pattern might first have watched whether the pivot held. It did. The 5.12 low on 15 May was the deepest dip, and on 27 May price closed at 6.83, above the February high of 6.78, clearing the last of the overhead supply.
The written plan didn’t survive June, though. On 11 June price closed at 6.58, below its 10-day line, and on 12 June at 6.56, below the 20-day. Followed to the letter, the plan ends about 20% above the entry. Over the full hold, closes below the 10-day line happened 66 times and below the 20-day 36 times. The 50-day line held every close until 25 February 2021.
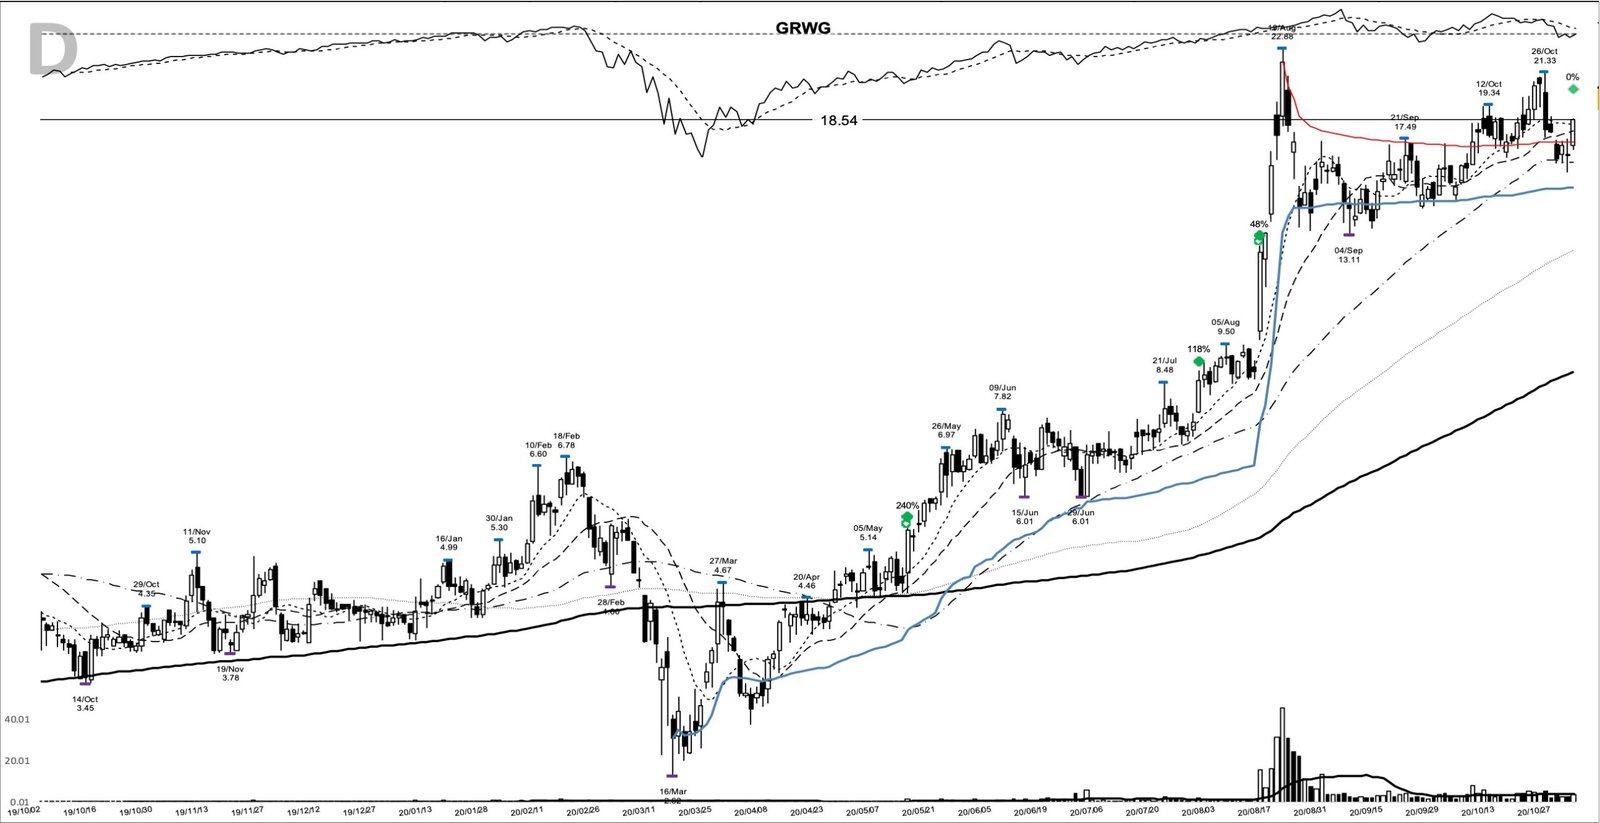
The third add-on point came after a sharp shakeout. From a 21.33 high on 26 October price fell to a 15.84 low on 30 October, a 25.7% drop. On 2 November it closed at 18.54, back above the 10-day line at 18.30.
The fourth, on 15 December, was a 34.70 close near the 10-day line.
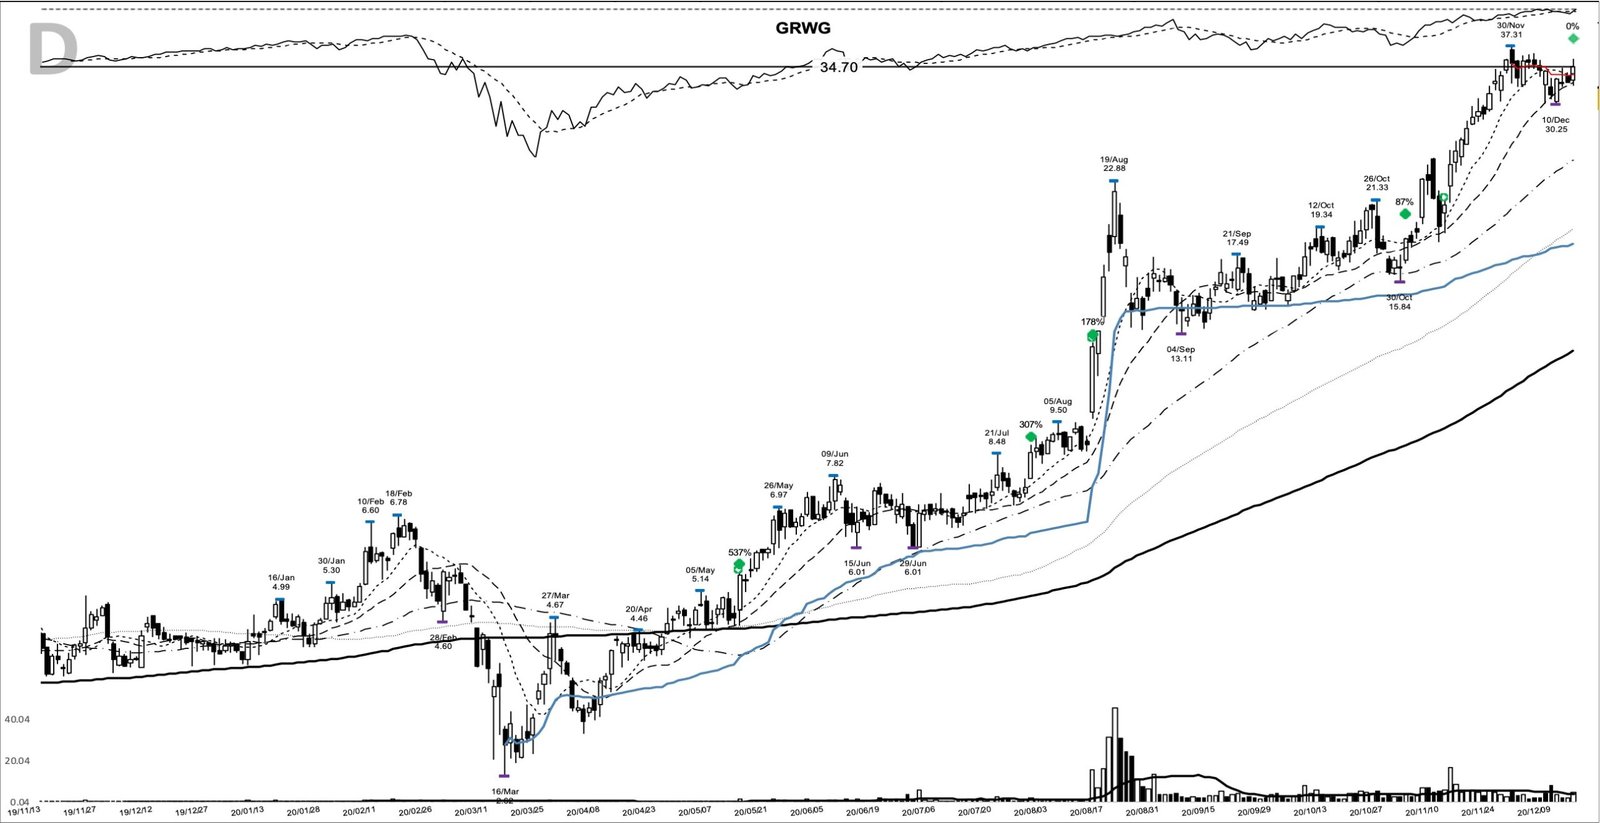
On 6 January 2021 the fifth closed at 44.41, above the 43.14 high from 23 December, on 1.98 times average volume. Five days later the company pre-announced record 2020 revenue.
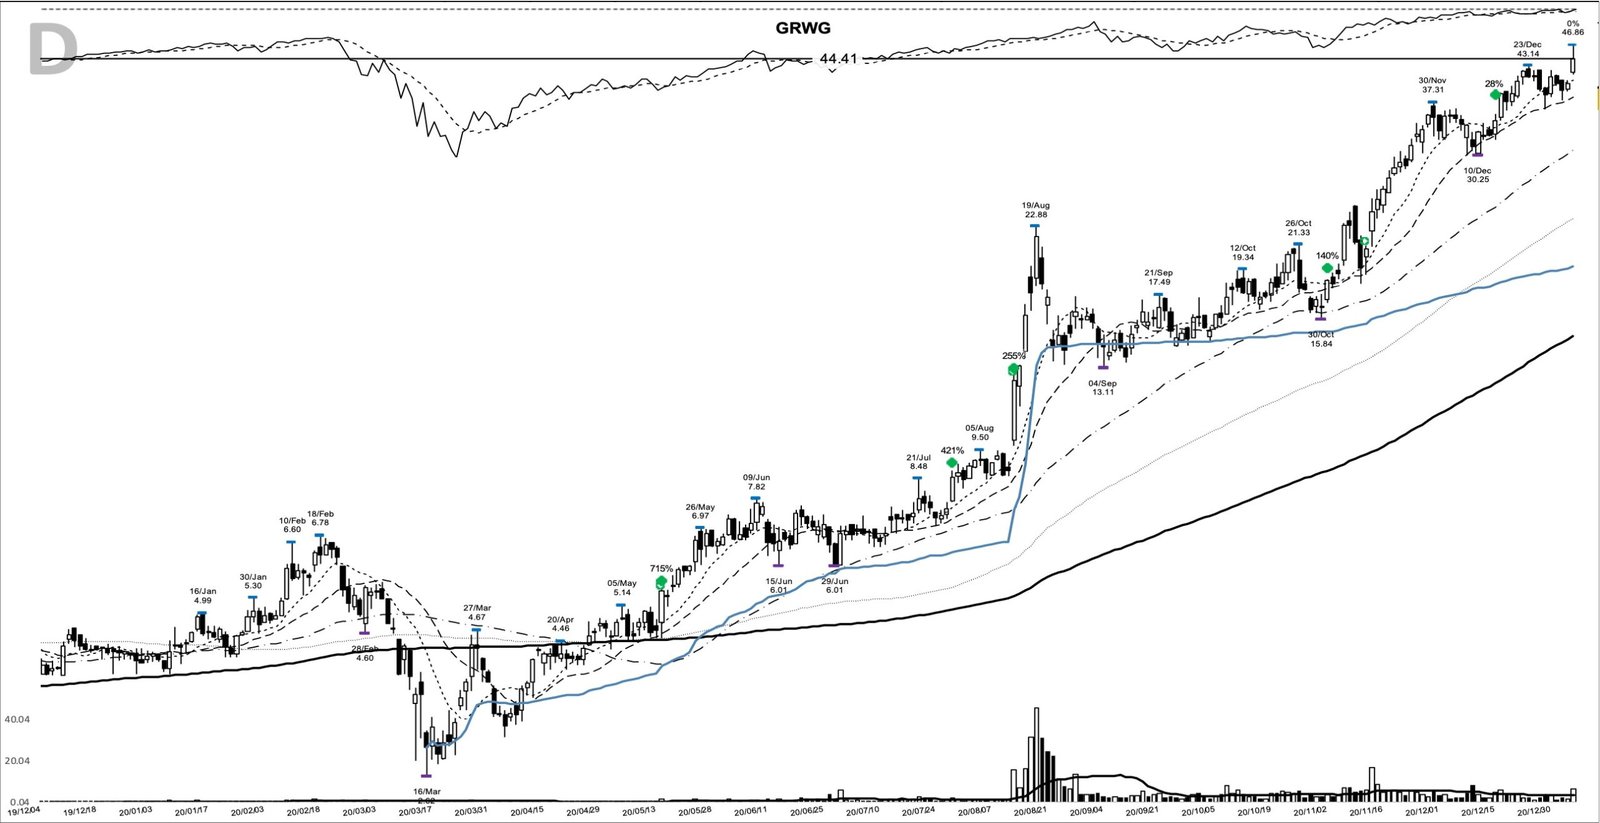
The sixth closed at 51.05 on 2 February 2021.
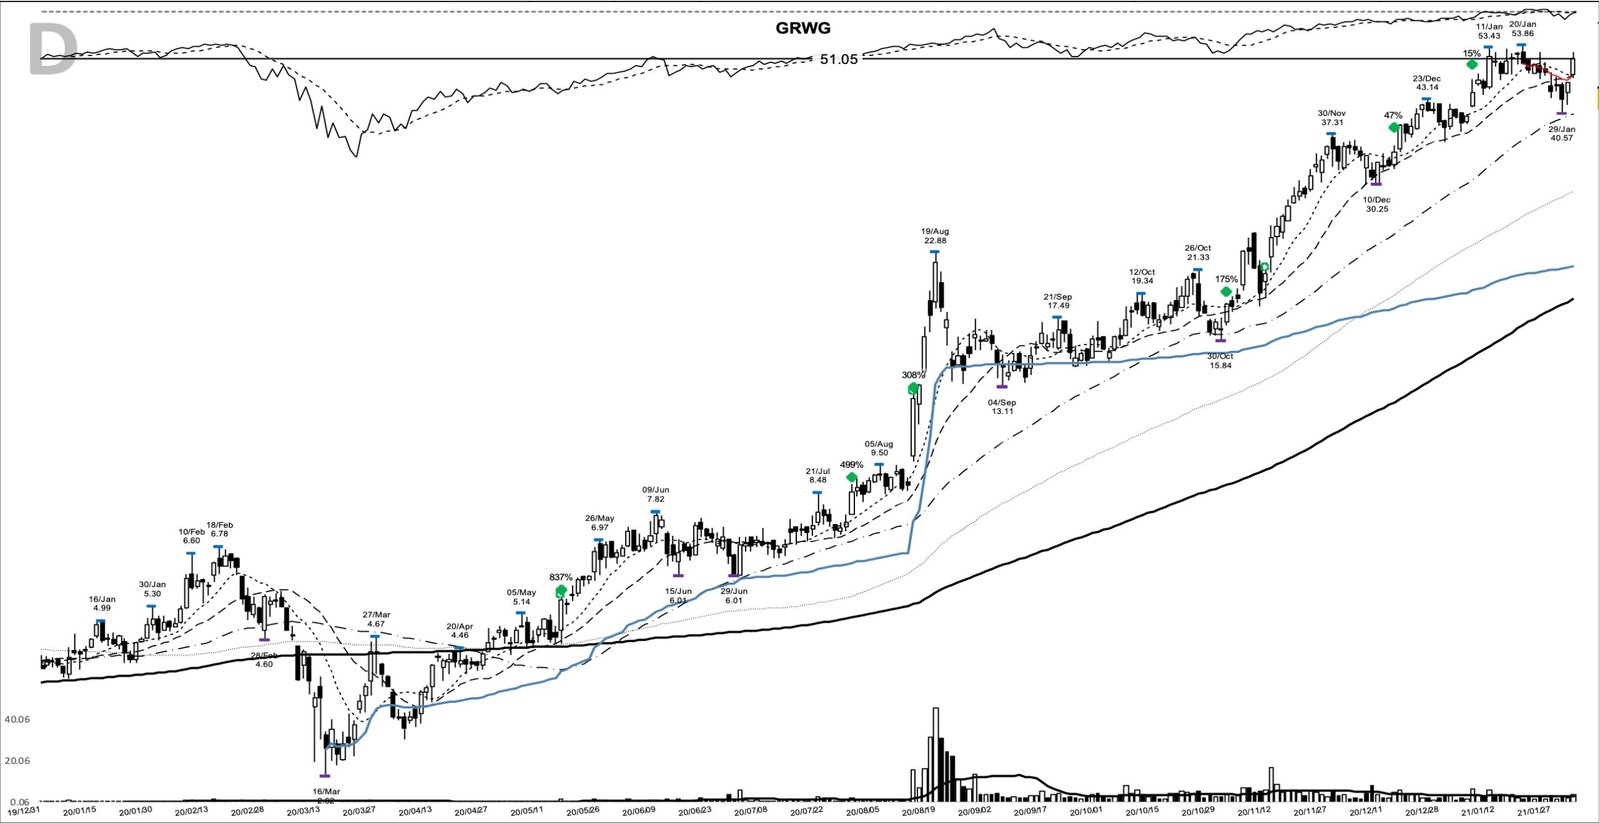
The top was a single bar. On 10 February the stock opened at 67.75, its peak, and closed at 63.19. The next day it closed at 55.04 on 6,308,811 shares as a selloff spread across cannabis stocks from mid-February. On 25 February price closed at 45.86, the first close below the 50-day line since the entry, on volume only 0.87 times the average. That close was the exit, 32.3% below the peak. A notional 1,000 dollars riding the full move from the entry close would have become about 8,400 dollars.
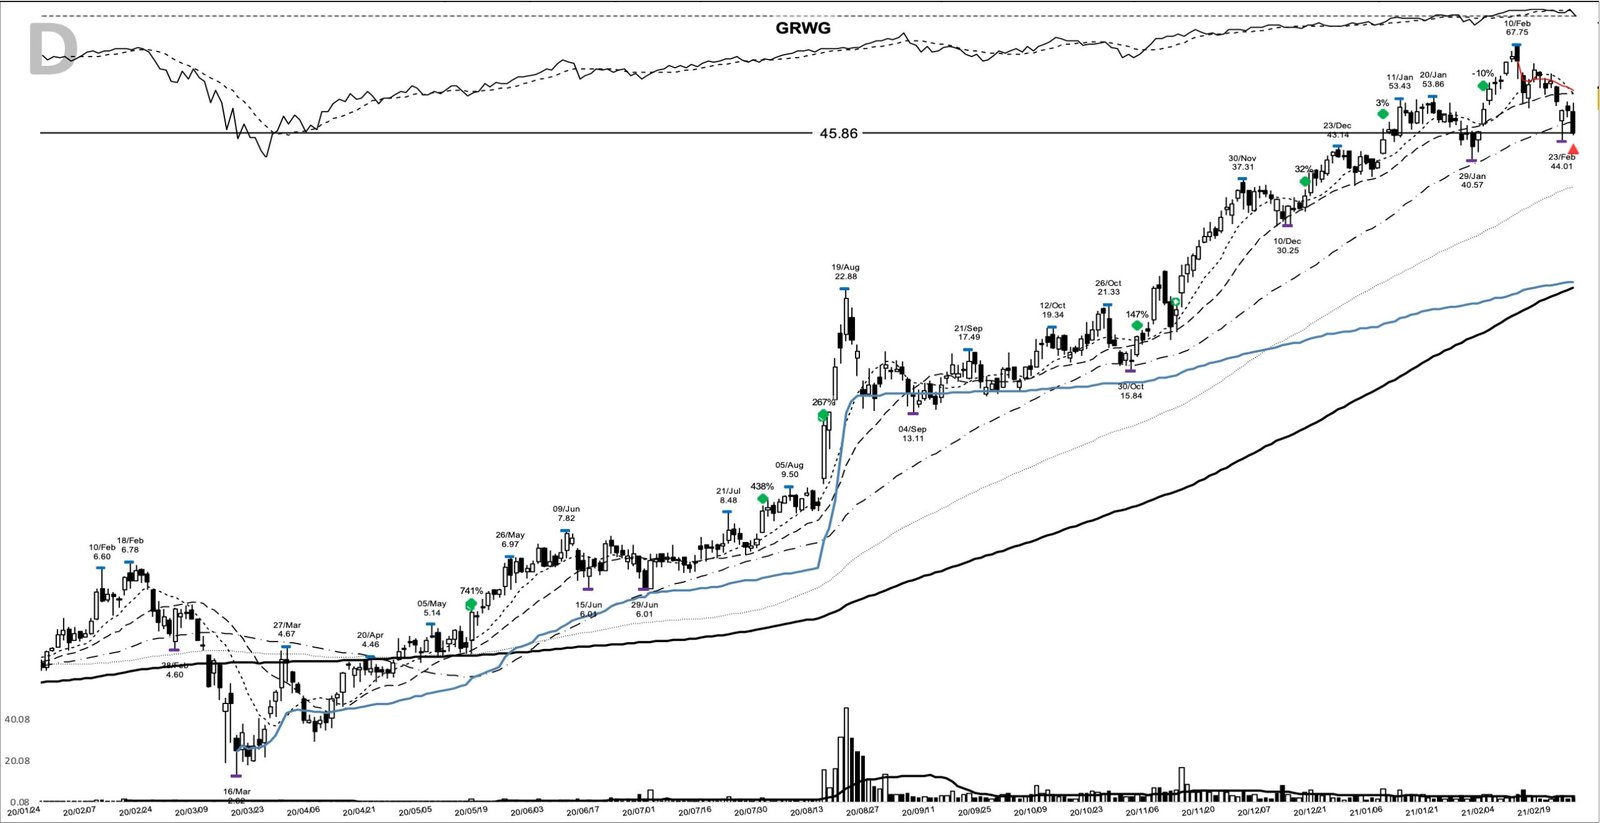
Adding on strength follows the logic of pyramiding into a position, and the early adds had plenty of room: 438.3% from the July add to the exit and 266.9% from the August add.
Where the GRWG chart misleads
First, the breakout was a short-term one. The 5.14 pivot was a 20-day high, and the 5.45 close still sat 19.6% below the 6.78 February high. Nothing on 14 May proved the stock would clear that supply, and plenty of deep bases produce a failed breakout at exactly this point. It took until 27 May.
Second, earnings didn’t confirm the move. The loss of 0.06 in the quarter just reported is the opposite of the earnings acceleration growth screens look for, and a strict earnings filter would have skipped GRWG in May 2020.
Third, the late adds carried little edge. The 6 January add had only 3.3% left to the exit, and the 2 February add ended 10.2% under its own close. Even the initial stop was wide: 18.2% from the 5.45 close to the shelf, well beyond the 7-8% stop-loss rule, so normal risk per trade meant a smaller position than the headline gain suggests.
What GRWG’s 2020 run says about choosing a trailing line
The pattern got the entry right, and the trailing line decided almost everything after it. The 10-day and 20-day lines ended the trade about 20% in. The 50-day line held every close for more than nine months and carried the move to 741.5%. Nobody knows in advance which stock deserves the looser line, but you can decide before the entry how much room a volatile leader gets.
Learn the pattern. Ride the trend. Keep the gains.
Related studies: CZR base breakout May 2020; BLNK base breakout June 2020; JMIA base breakout July 2020. A new winner study lands most evenings.
Price and volume figures are computed from split-adjusted daily OHLCV data; company figures come from SEC filings where cited.
Educational content only. Not investment advice. Trading involves risk. You are responsible for your decisions.
Get the free Market Wisdom e-book
Join Trends and Breakouts — historical winners, breakout studies, and risk lessons. No spam, unsubscribe anytime.