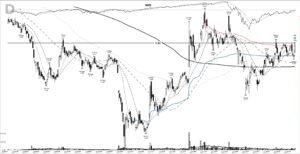
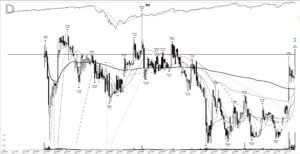
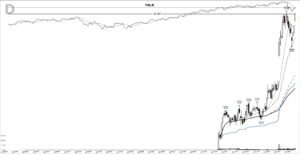
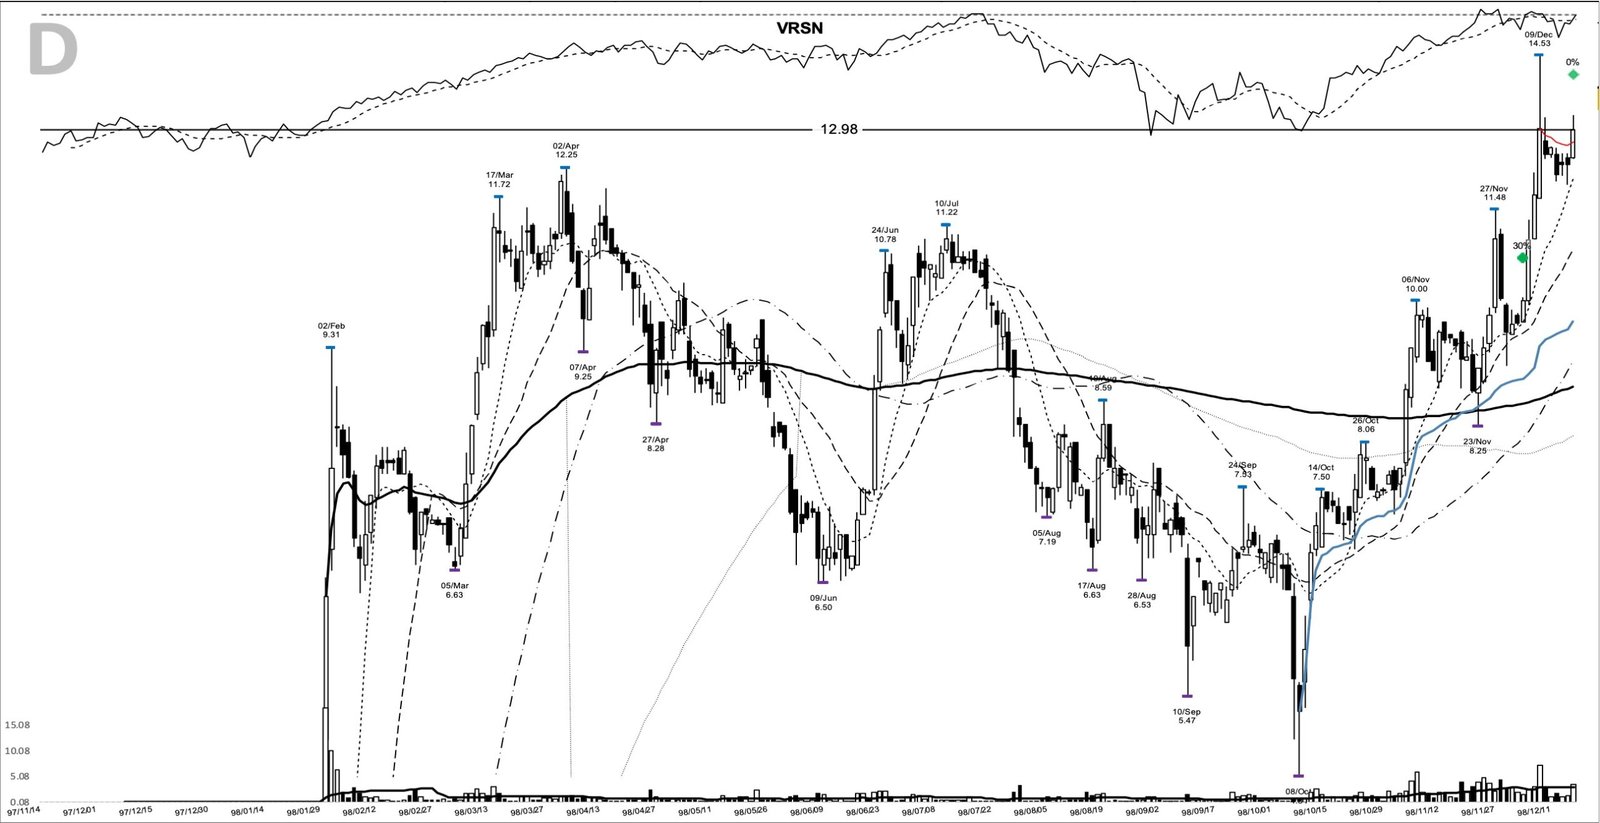
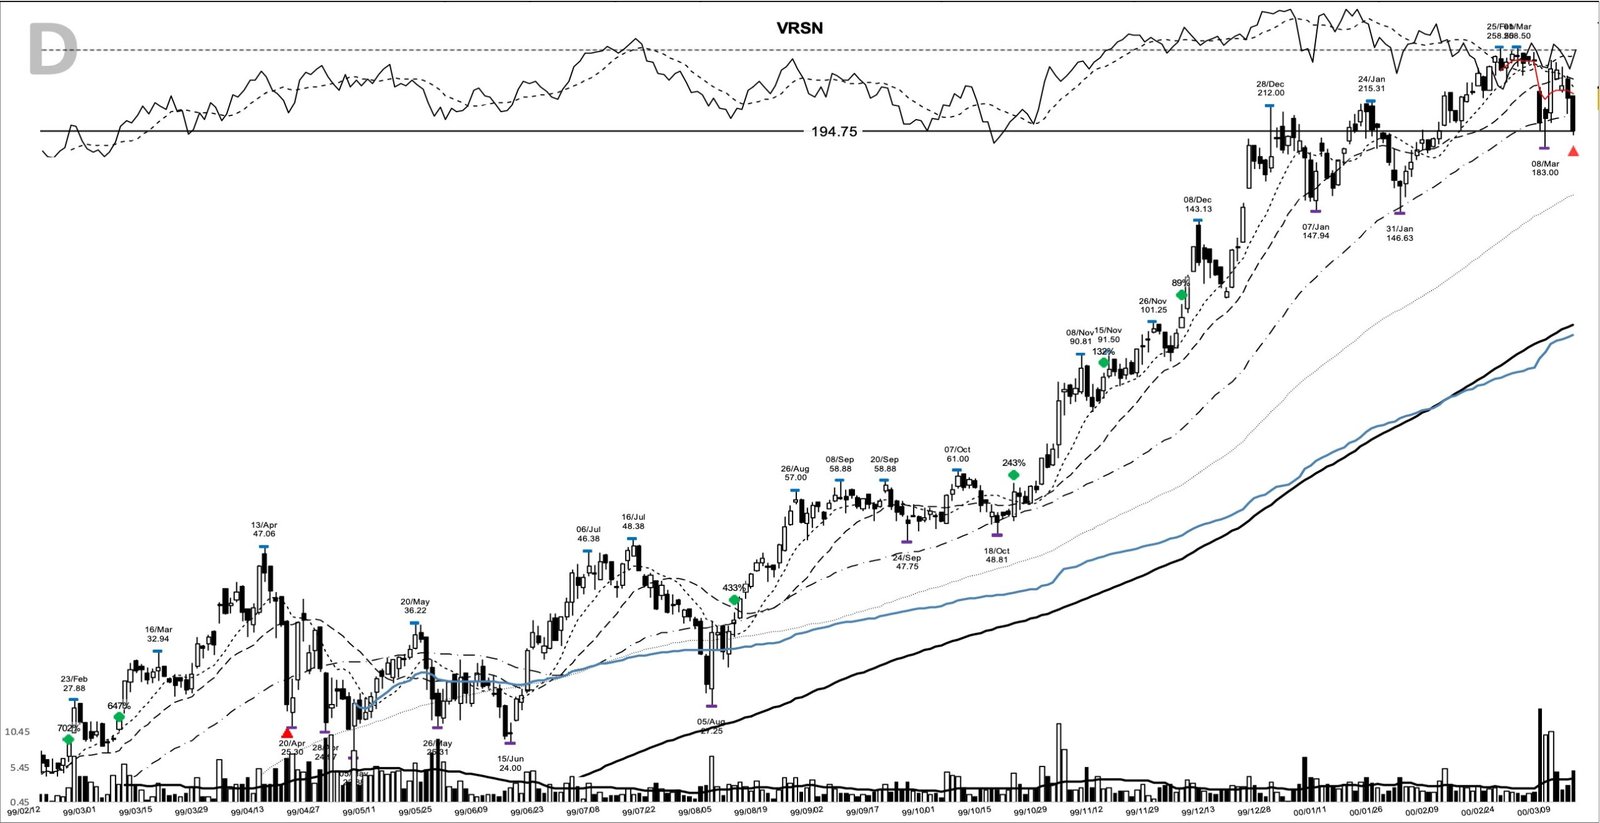
VRSN’s back on traders’ screens this week, popping onto Yahoo’s gainers list after VeriSign’s 23 July quarterly report and a raised full-year outlook. That’s a fair excuse to pull the VRSN base breakout of December 1998 back off the shelf, because the chart’s a clean model of how a real market leader comes out of a long base and then trends for a long time. The setup was simple to state and hard to sit through: an eight-month base under the 11.48 pivot, an entry at the 4 December 1998 close of 10.00, and a run of +1,847.5% over the next 467 calendar days.
Key takeaways from the VRSN base breakout
- The setup was an eight-month base beneath the 11.48 pivot, with the entry taken at the 4 December 1998 close of 10.00 on light 0.5x volume.
- The move ran +1,847.5% from that 10.00 close to the 194.75 exit on 15 March 2000, a hold of 467 calendar days.
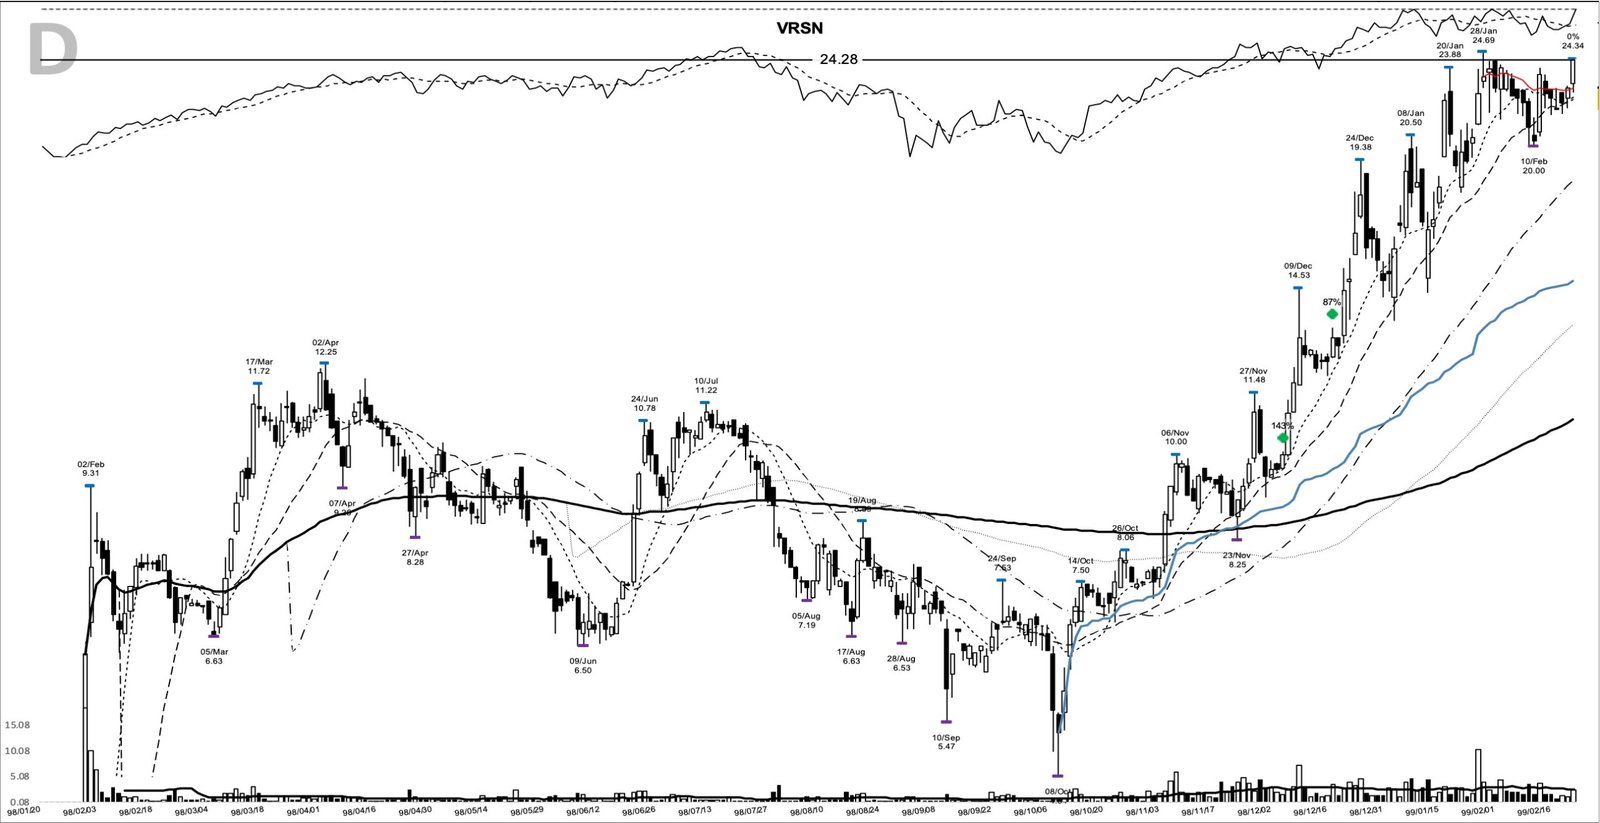
- The chart marks seven add points as the trend extended, from 12.98 in December 1998 up to 102.97 a year later.
- Price peaked at 258.50 on 25 February 2000, roughly +2,485% at its high, before the exit booked the 194.75 close.
- 1,000 riding the full move would’ve become about 19,475, and nearly all of that came from holding the trend, not from timing the base.
The VRSN trade at a glance
| Field | Value |
|---|---|
| Ticker | VRSN |
| Study entry date (anticipatory) | 4 December 1998 |
| Entry close | $10.00 |
| Pivot | $11.48 |
| Pivot cleared | 8 December 1998 at a close of $11.75 |
| Volume vs 20-day average | 0.5x |
| Exit date | 15 March 2000 |
| Exit close | $194.75 |
| Gain | +1,847.5% |
| Calendar days held | 467 |
| Peak before exit | $258.50 (25 February 2000) |
How VRSN built its 1998 base
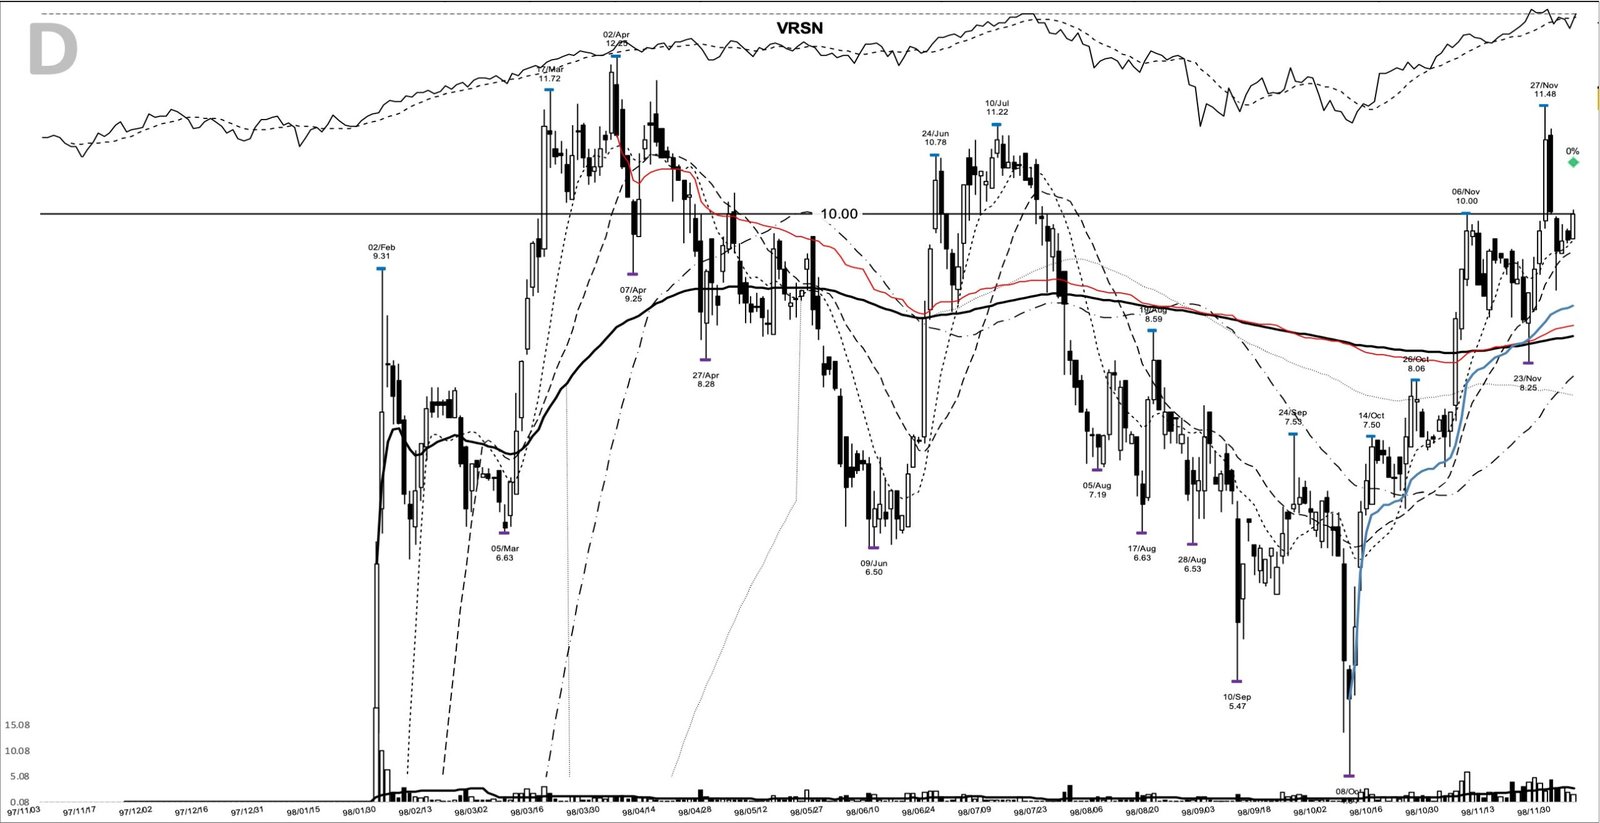
VeriSign came public in January 1998 and spent its first year on the market building the base you’ll find on the left of the chart. The high water mark was 12.25 in early April 1998, the prior 52-week high. From there the stock ground lower with a nervous tape, bottoming at 4.84 on 8 October 1998. Top to bottom, the base was about 57.8% deep, a wide, punishing structure. Depth like that’s usually a warning rather than an invitation.
The right edge is where it turned. By early November price had reclaimed the 10 area, tagged 11.48 on 27 November, then pulled back to a shelf low of 9.06 on 1 December before the entry bar on 4 December closed at 10.00. The long moving average had flattened and price was pushing back above it, with the shorter lines curling up underneath.
There’s one honest wrinkle right on the entry bar. Volume that day was light, about 1.48 million shares against a 20-day average near 2.83 million, or 0.5x. The textbook breakout bar carries a volume surge, and this one didn’t. This study classifies the entry as anticipatory: the 4 December close of 10.00 sat below the 11.48 pivot, and price didn’t clear that pivot until 8 December, when it closed at 11.75. The heavier follow-through came the next session, when 9 December traded roughly 7.16 million shares and the stock ripped to 13.
What VeriSign was selling in 1998
The business behind the chart explains why the trend had legs. VeriSign was the original certificate authority, the first company to issue the SSL certificates that let a browser trust a website, and by the late 1990s it owned that market. Its OnSite public-key product had shipped in January 1998 and reached version 4.0 that October, adding centralized key management the company ran for its customers.
The timing lined up with the question every investor argued about in 1999: whether online commerce was real. VeriSign sold the trust layer underneath it. The company had bought SecureIT in July 1998, then signed a wide distribution deal with Netscape’s Netcenter portal and absorbed the rival authority Thawte. This study stays on price rather than the earnings line, since clean quarterly figures aren’t in the evidence set, but the strategic story is plain: a category leader selling the picks and shovels of e-commerce, as e-commerce went vertical.
The tape behind the December 1998 breakout
Context is half the read. The 8 October 1998 base low was struck in the middle of a real scare, with Russia’s default and the collapse of Long-Term Capital Management dragging US stocks down about 19% from their summer highs. The Federal Reserve cut rates through the autumn, the market bottomed, and a tech-led melt-up carried the Nasdaq roughly 84% higher into November 1999.
The VRSN entry came off that washed-out low, into an uptrend that rewarded leadership and punished caution. The bookend’s just as telling: the 15 March 2000 exit landed within days of the Nasdaq’s own top. A strong stock in a strong tape is the setup this whole study rests on.
Spotting the VRSN setup before the 11.48 pivot
What put this name on a watchlist before the move was the trend posture. Into the entry, price had closed above its 10-day line for eight straight sessions and sat about 3.4% above it, with the 10-, 20-, and 50-day averages stacked in order at 9.67, 9.53, and 8.11 and all turning up. That’s the signature of a base handing off to a trend, visible on the chart before any of the fireworks.
Written on the day, a trend follower’s plan was mechanical. Buy the break above the 11.48 pivot, the 27 November swing high that capped the base. Set the initial stop below the 9.06 shelf low of 1 December, with the 4.84 base low of 8 October marking the level where the whole structure would’ve failed. Then trail the rising 10-day line, widening to the 20-day once the position was well advanced.
The chart’s entry sits a step ahead of that plan, at the 10.00 close, taken as price bounced off the 9.06 shelf with the trend already reasserting. It front-runs the 11.48 pivot, which didn’t clear until 8 December, two sessions later, so you’re trading wider risk for an earlier seat. Both reads are defensible; the earlier entry simply asks you to accept a failed base as a live risk.
From 10.00 to the 2000 top: how the VRSN trend paid out
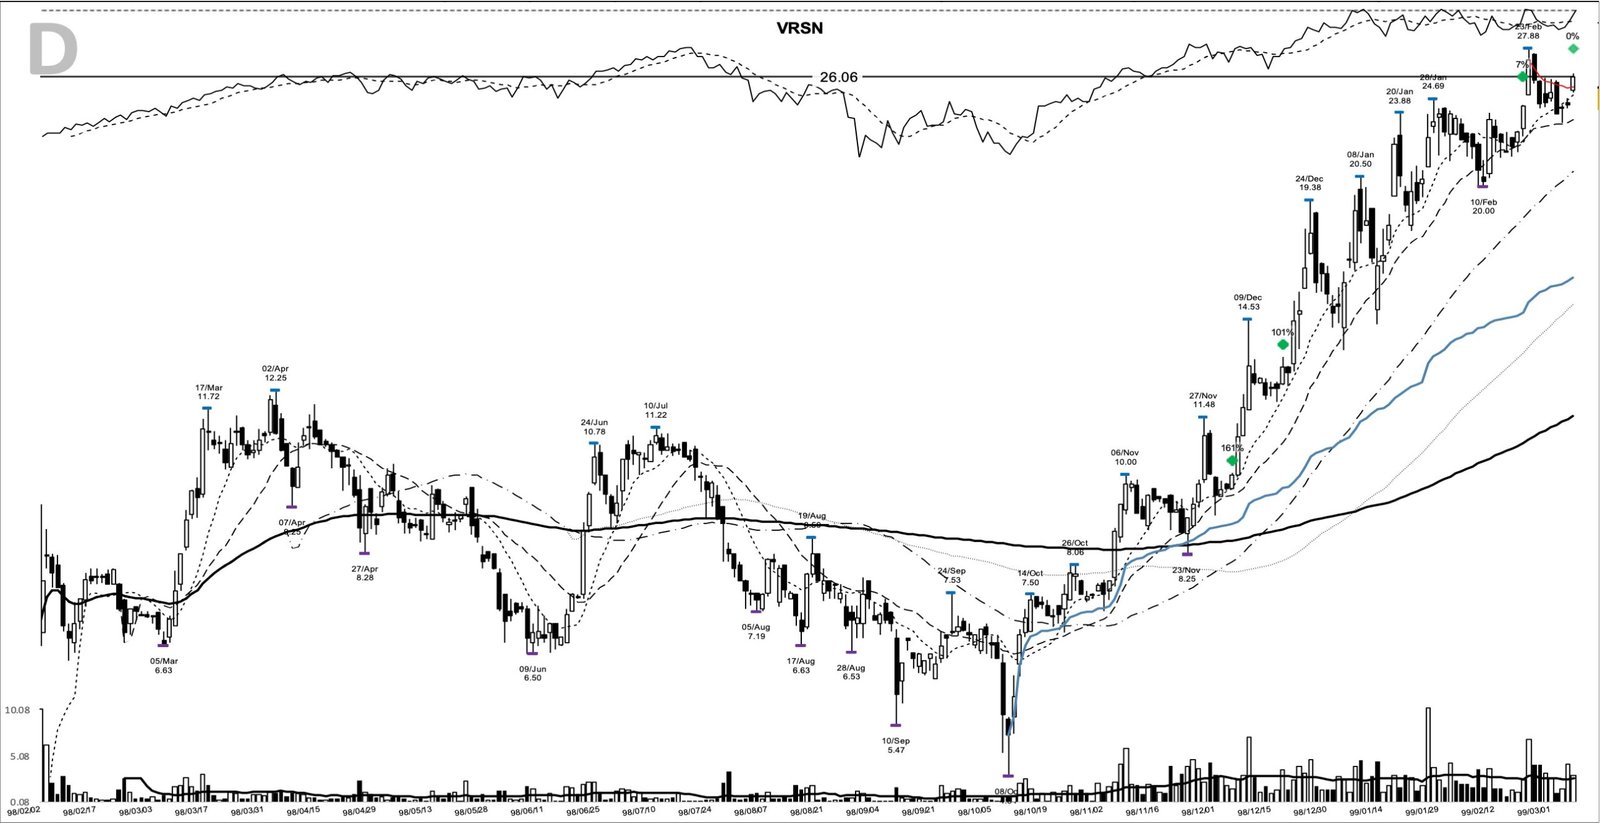
A trend follower holding this pattern would’ve watched for higher highs above a rising 10-day line, and for months the stock obliged. The chart marks seven add points: 12.98 that December, then 24.28 and 26.06 in the spring of 1999, and later 36.56, 56.81, 84.00, and 102.97 as the advance accelerated into year end, each on a fresh high with the trend intact.
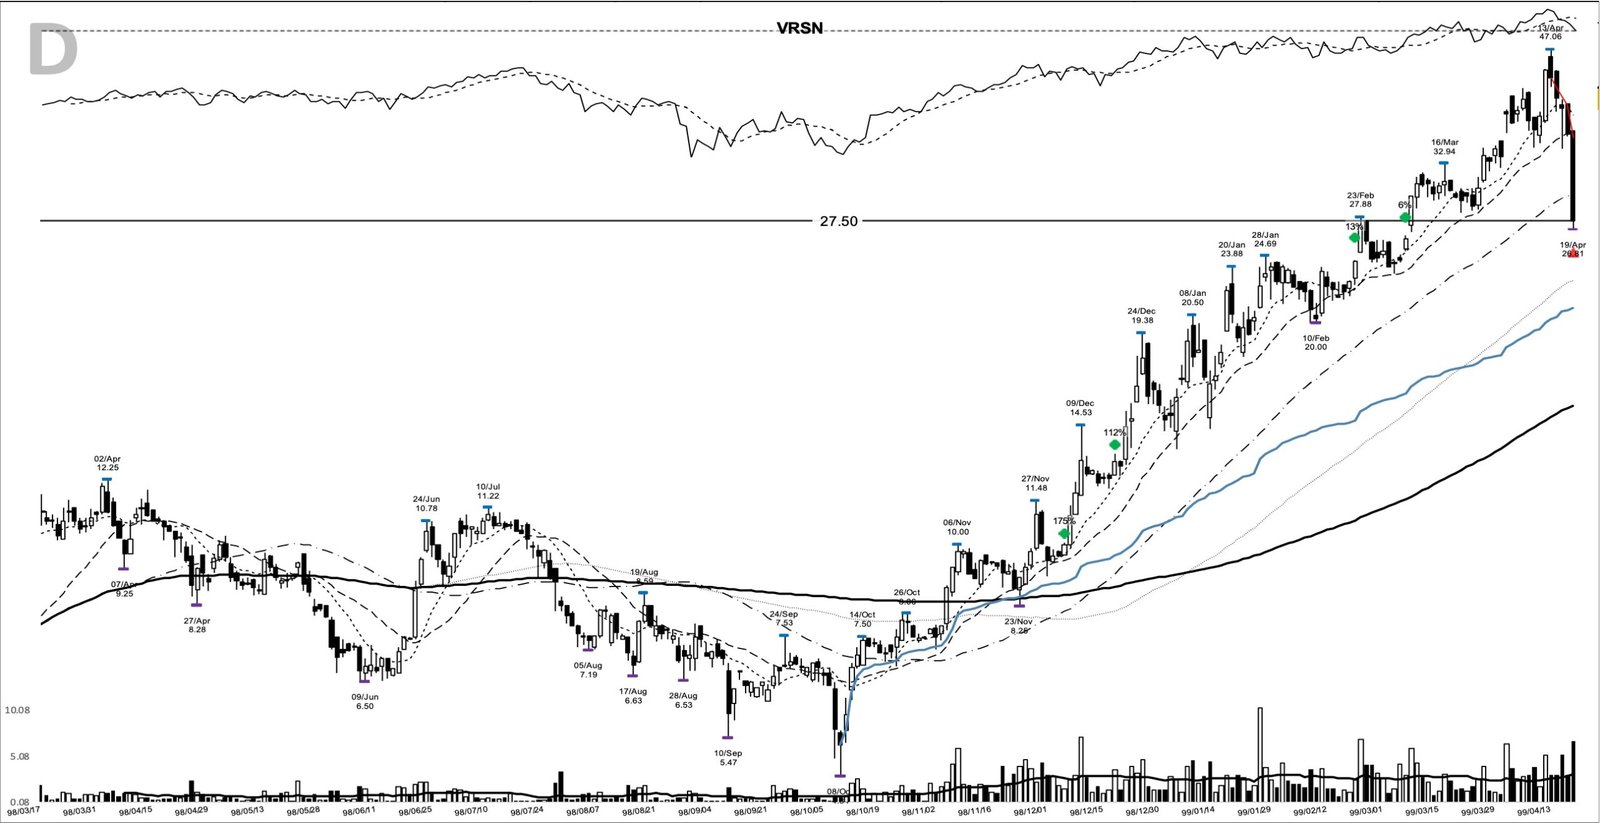
The hold wasn’t comfortable. After the stock ran into the mid-40s in April 1999, it broke hard, tagging 26.81 intraday and closing at 27.50 on 19 April on about 6.65 million shares. That’s roughly a 40% drawdown inside the uptrend, and the chart marks it as a spot to lighten. The stock rebuilt through the summer, and the 11 August close of 36.56 offered a fresh place to re-engage as the higher-high structure resumed.
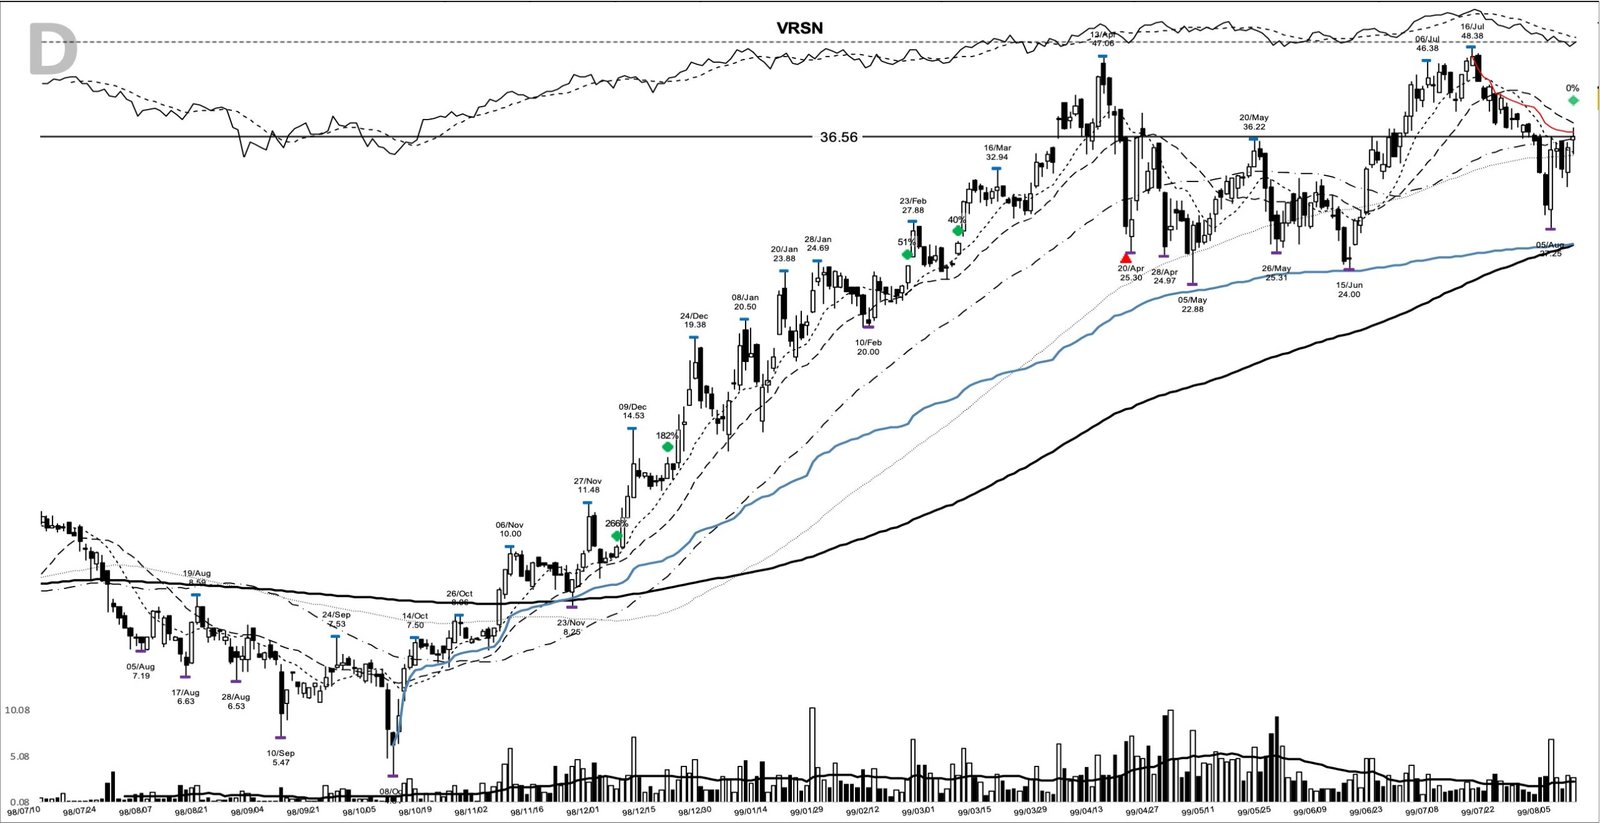
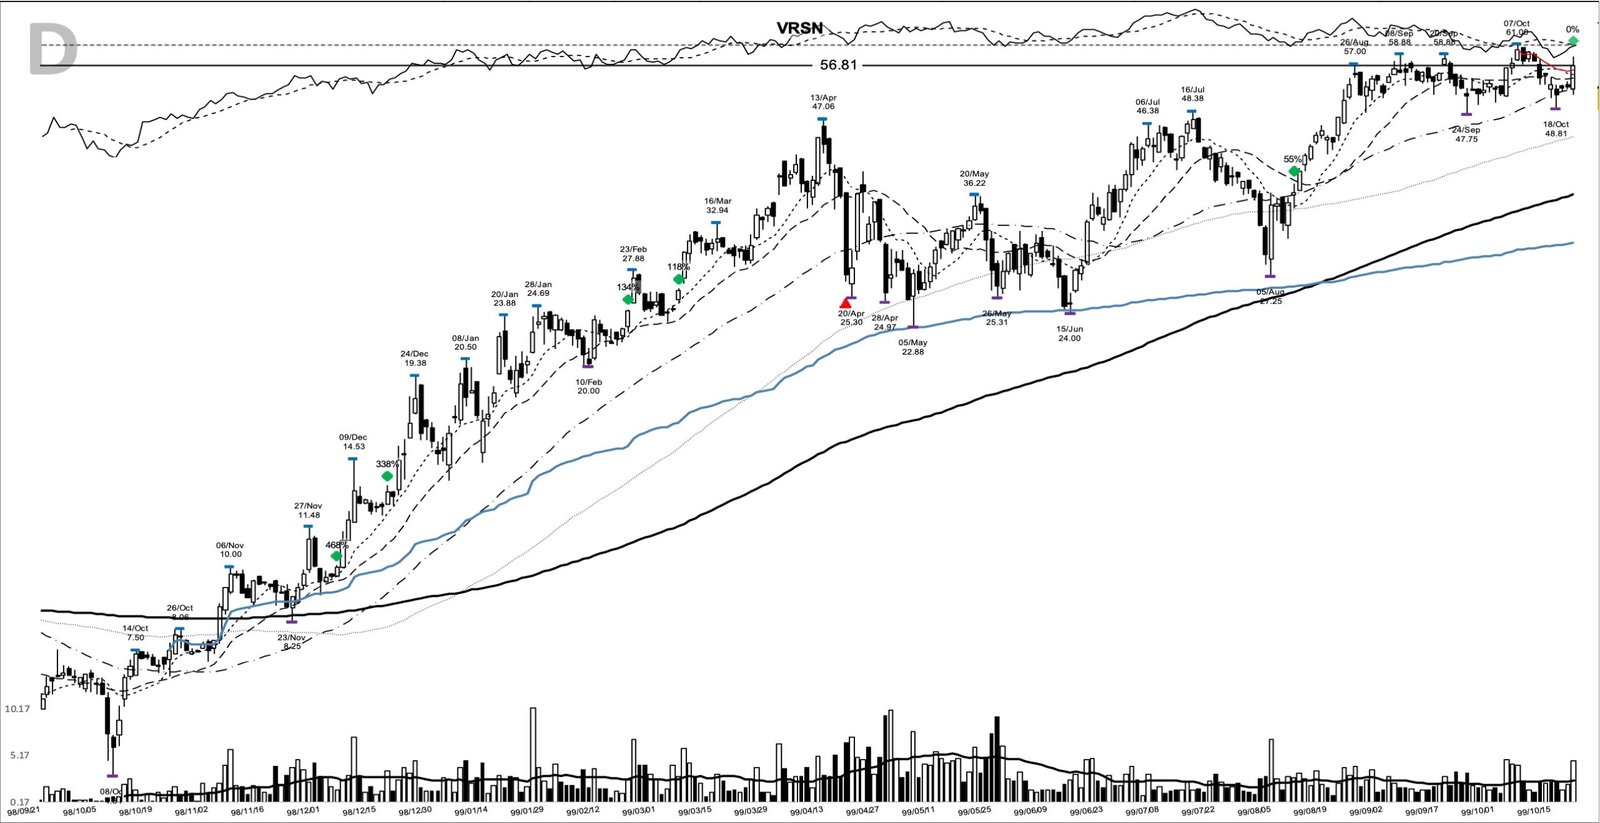
The autumn’s where the move went parabolic. The 21 October close of 56.81 gave way to 84.00 by mid-November and 102.97 by early December, the trend steepening as the whole Nasdaq stretched toward its blow-off. The same steepness that pays a late add also tends to mark the end.
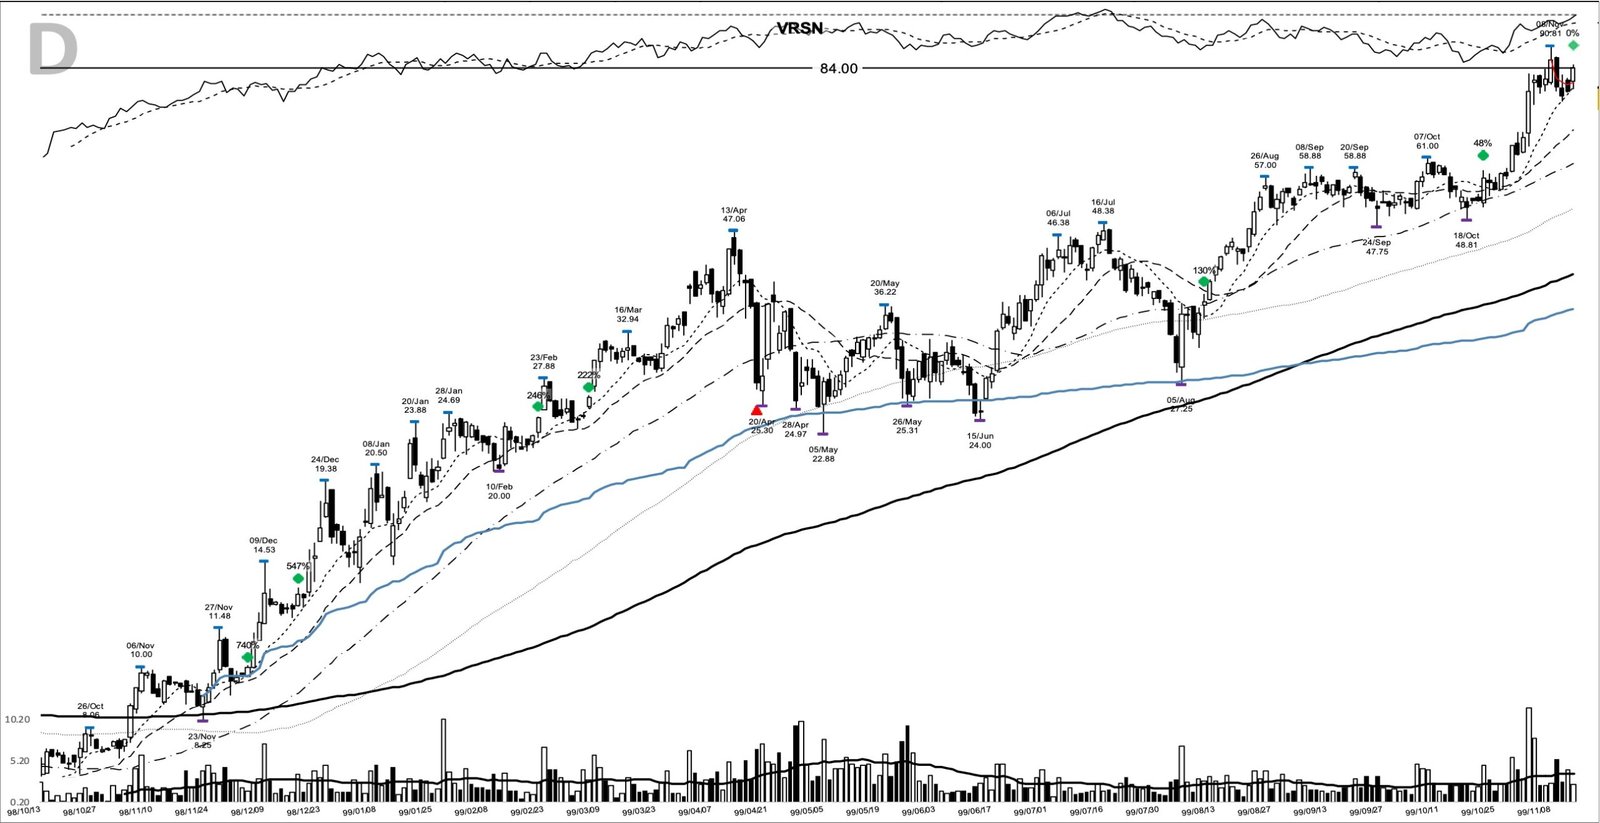
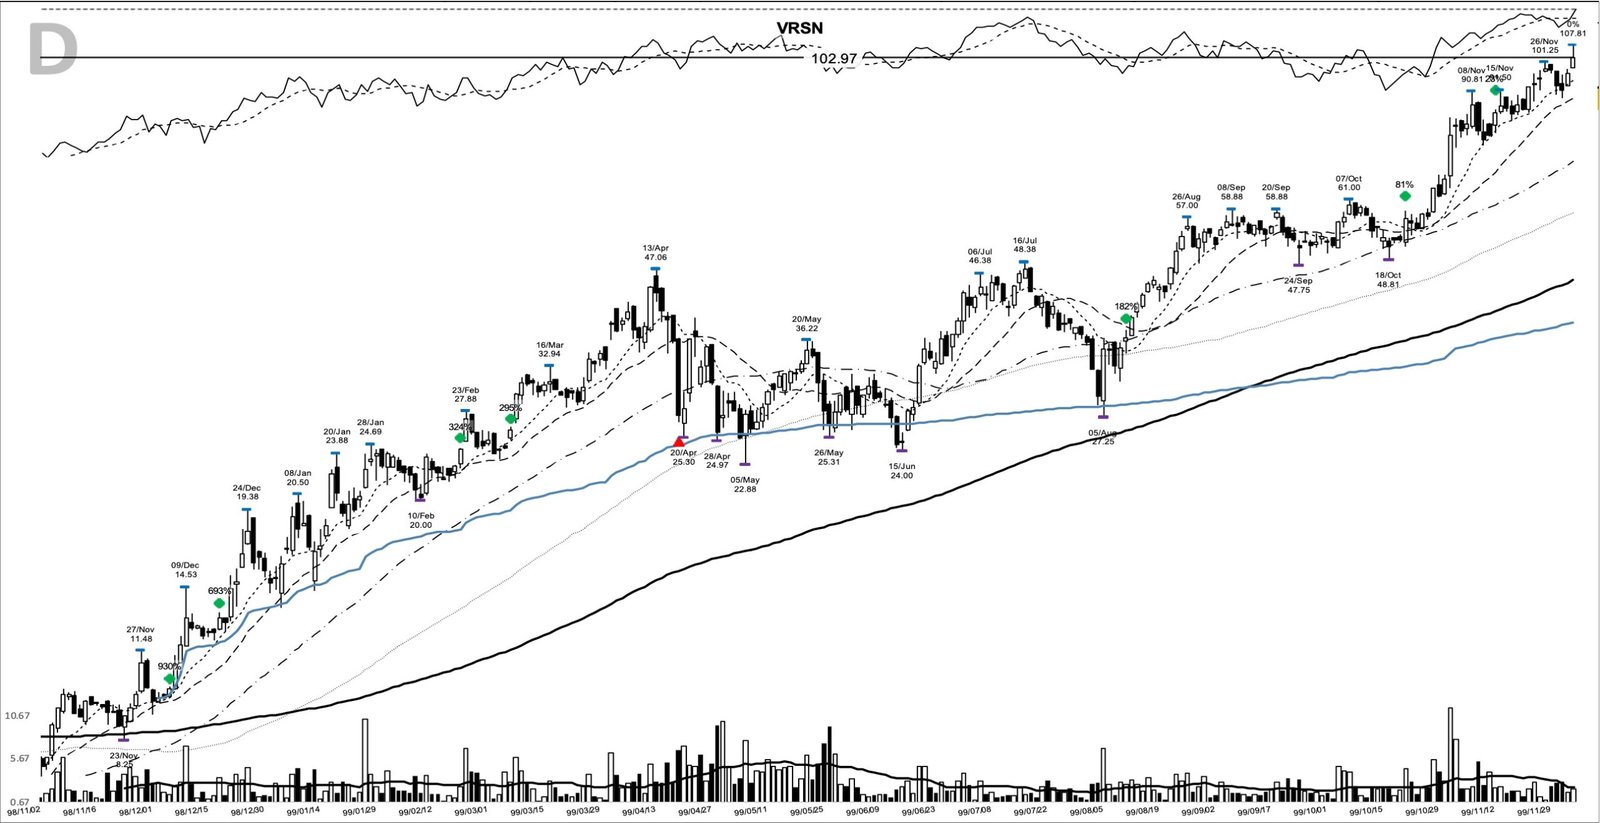
Price peaked at 258.50 on 25 February 2000, then the character changed. The 7 March session gapped down from the high 240s and traded almost 13.8 million shares, and the chart marks the exit on 15 March 2000 at the 194.75 close. That’s off the top by design: a trailing exit gives back some of the last leg so you’re never guessing the high. From the 10.00 entry, the exit still booked +1,847.5%.
What the VRSN chart didn’t promise
Read forward instead of backward, and you’ll see this setup carried real ways to lose. The entry bar’s 0.5x volume is the first. A trader waiting only for a heavy-volume breakout candle would’ve skipped the 10.00 close and chased the 11.48 pivot clear days later at 13 or higher, a worse price and a wider stop.
The deep base is the second. A 57.8% structure fails far more often than it works, and nothing on 4 December 1998 guaranteed it’d hold. The reason to lean in was the trend posture and the leading business, not the shape alone. Buying deep bases because one of them became VeriSign is exactly the survivorship trap a study like this can feed.
The third is the run itself. Anyone who bought the extended push into the mid-40s in April 1999 sat through a 40% drawdown within weeks. The trend paid, but only for a position sized to survive that shakeout and a plan that treated the pullback as noise. It’s one winner pulled from a library of studied charts, and the same base breakout fails plenty of times for every VRSN.
Learn the base, then let the trend work
The VRSN chart’s a lesson in patience twice over: patience to wait for a wrecked base to hand off to a trend, and patience to hold that trend through a 40% shakeout on the way to a multi-year move. The precise entry mattered less than the willingness to sit. That’s the model-book point William O’Neil built a whole method around, and this chart wears it plainly. Learn the pattern. Ride the trend. Keep the gains.
Related reading: the CANSLIM base-breakout system and how support and resistance define a pivot. A fresh winner study lands here most evenings.
Price and volume figures are computed from split-adjusted daily OHLCV data; company figures come from SEC filings where cited.
Educational content only. Not investment advice. Trading involves risk. You are responsible for your decisions.
Get the free Market Wisdom e-book
Join Trends and Breakouts — historical winners, breakout studies, and risk lessons. No spam, unsubscribe anytime.