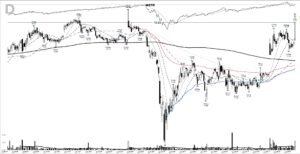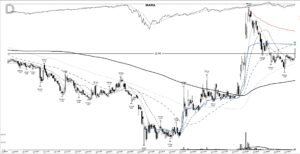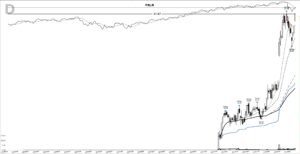
On 7 July 2020 Jumia Technologies closed at 5.77, still 19.7% under the 7.19 high it had printed a month earlier. When JMIA shows up on traders’ screens again, this is the chart worth studying. The JMIA base breakout came one session after that close, and the entry it offered was early by design. In short: an early July 2020 entry in a 76.9%-deep base that moved 845.1% from the entry close to the exit close in 226 calendar days.
Key takeaways from the JMIA base breakout
- The pattern: a six-month base from a 9.30 high in January 2020 to a 2.15 low in March, with a 7.19 pivot set on 8 June.
- The entry came early: a 5.77 close on 7 July, below the pivot. The pivot cleared the next day on a 7.88 close.
- Entry-day volume ran 1.3 times the 20-day average. The heavy volume arrived on 8 July.
- The move: 845.1% from the entry close to the 54.53 exit close in 226 calendar days, with a 69.89 peak on 10 February 2021.
- Three add-on points followed, and the last of them, at 56.96, sat above the exit.
| Field | Value |
|---|---|
| Ticker | JMIA |
| Study entry date (anticipatory) | 2020-07-07 |
| Entry close | 5.77 |
| Pivot | 7.19 |
| Pivot cleared | 2020-07-08, close 7.88 |
| Volume vs 20-day average | 1.3x |
| Exit date | 2021-02-18 |
| Exit close | 54.53 |
| Price change, entry close to exit close | 845.1% |
| Calendar days | 226 |
| Peak before exit | 69.89 (2021-02-10) |
Inside the 76.9% base: how the 7.19 pivot formed
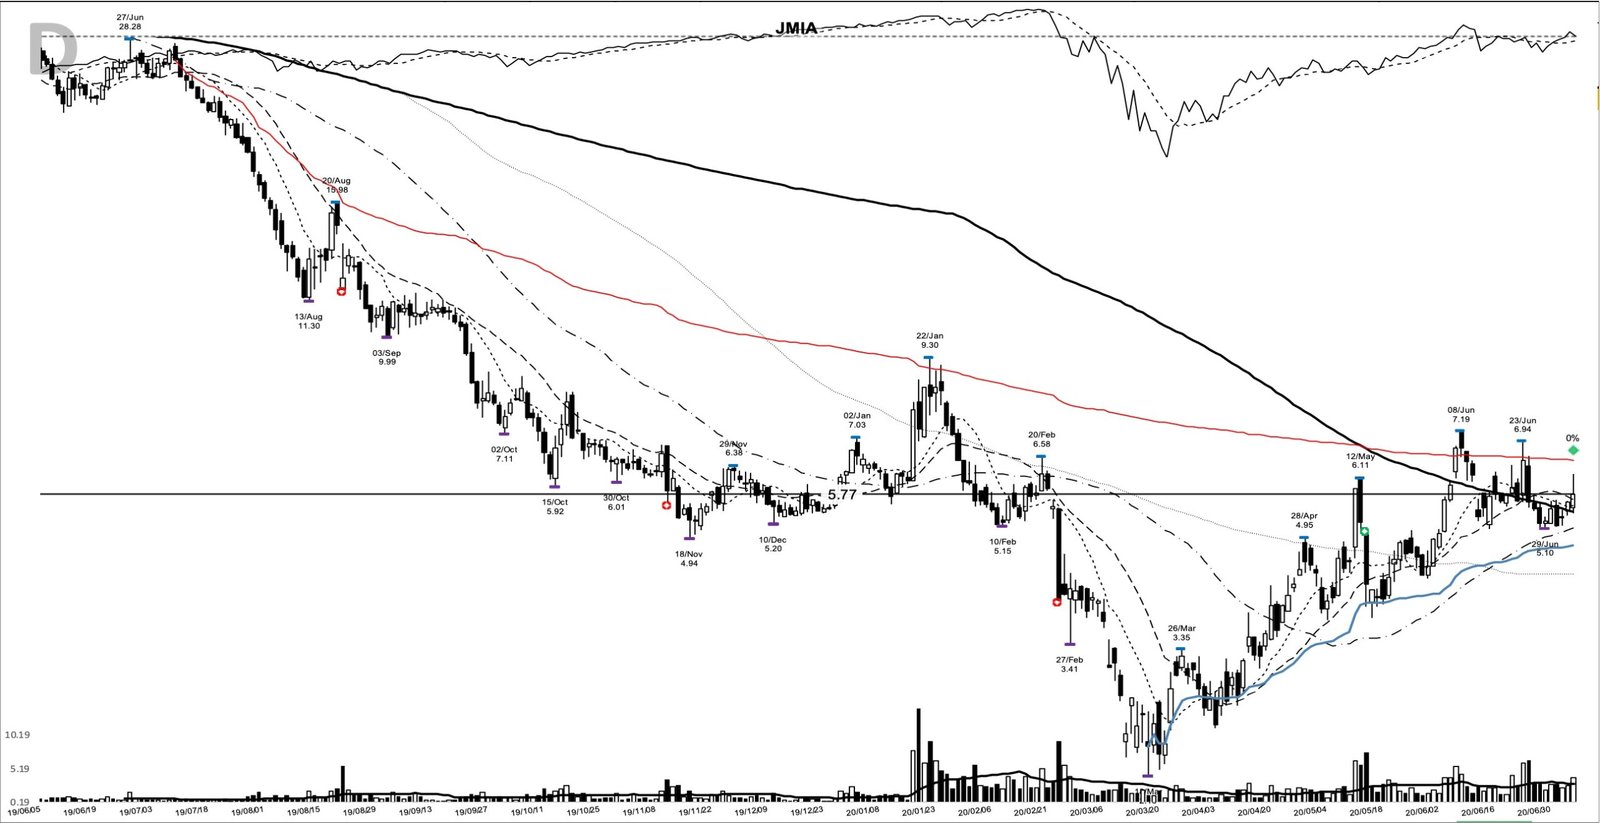
The charts here come from my study archive, and the entry chart is mostly a picture of damage. JMIA had traded at 27.99 on 10 July 2019. By 22 January 2020 the best it could manage was a 9.30 high, and on 18 March it touched 2.15. That’s a 76.9% drop inside six months, on top of the 2019 decline.
The repair started in April. A rally to a 6.1101 high on 12 May failed hard: the next session, 13 May, the stock fell to a 3.89 low on 7,594,858 shares. Then June brought the push that mattered. Price closed at 5.65 on 3 June, 6.77 on 5 June, and on 8 June it opened at 7.17, reached 7.19 and closed back at 6.77. That intraday high is the pivot.
What followed was a tight, untidy shelf. A 23 June probe reached 6.94 on 6,020,878 shares and closed at 6.50. The next day gave it all back, closing at 5.62 on 6,415,031 shares, the heaviest volume of the month. Lows of 5.10 on 26 June and 29 June marked the floor.
The study entry on 7 July was anticipatory. Price opened at 5.50, traded up to 6.20 and closed at 5.77, a close that sat 19.7% below the 7.19 pivot. Volume ran 1.3 times the 20-day average, which is ordinary participation and no sign of demand. The pivot cleared one session later, on 8 July, with a 7.88 close on 21,725,472 shares, about 7.55 times the 20-day average and the heaviest volume in this data to that point.
Jumia in mid-2020: falling sales volume, a growing payments arm
Jumia is a pan-African e-commerce marketplace that listed on the NYSE in April 2019 and spent the next year being questioned, including a short seller’s fraud allegation. Its first-quarter release on 13 May 2020 showed the shape of the business going into this chart. Gross merchandise volume fell year over year as lockdowns from mid-March and cross-border disruption hit electronics and fashion. Active consumers and JumiaPay payment transactions grew, and losses narrowed.
The model-book earnings test can’t be run here. The SEC data in hand carries no quarterly EPS or revenue series for Jumia, so this study cites no earnings figures. The qualitative picture is clear enough: a loss-making company with shrinking sales volume, valued on what African e-commerce might become.
The July news flow was thin. Coverage at the time traced the month’s rally to momentum in technology and online retail stocks, with Airtel Money’s arrival as a payment option as the main company item. The stock moved with a theme while the business itself hadn’t turned.
That pattern held at the first add-on point. On 8 October Jumia announced Jumia Games, a gaming platform for JumiaPay users in five countries, and the stock closed at 10.52 on 35,209,635 shares, 82.3% above the first buy. The next day short seller Citron Research said it would no longer short the stock.
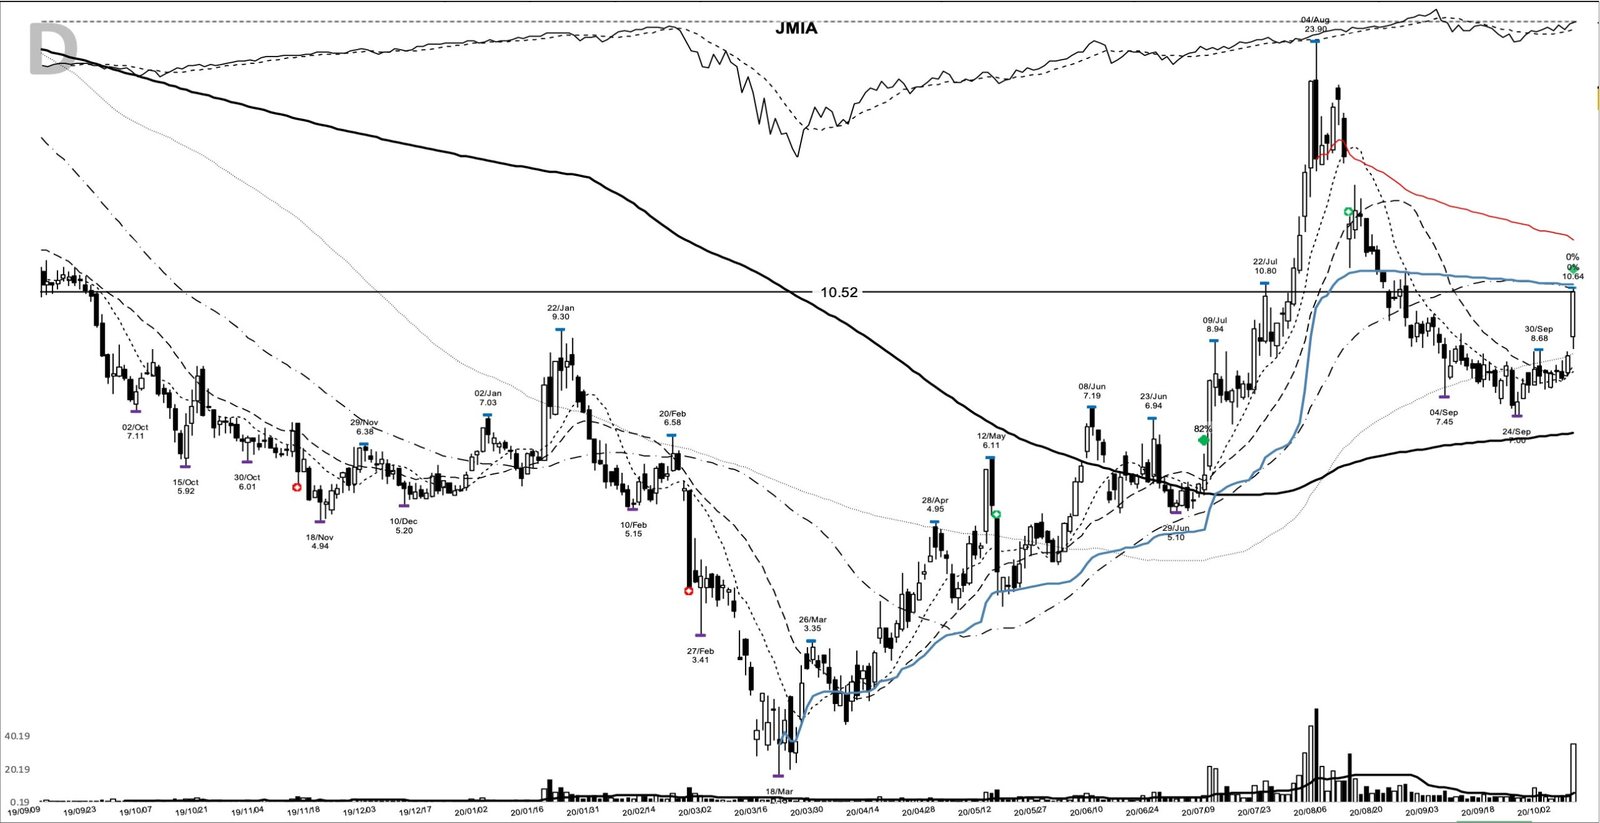
A record Nasdaq the day before the entry
The tape was doing the heavy lifting. On 6 July 2020, the day before the entry, the Nasdaq Composite closed at a record, its biggest daily gain since mid-May, with Amazon pushing past 3,000 dollars a share for the first time. Stay-at-home spending had made e-commerce the market’s favourite story, and in July even a speculative African marketplace caught the bid. A trader timing exposure off the follow-through day signal was long since in gear.
Preparing for the 7.19 pivot: the shelf, the averages and the plan
The trend posture on 7 July was young. Price had closed above its 10-day moving average for only 2 straight sessions, and the 10-day line at 5.55 sat below the 20-day at 5.67, with the 50-day at 5.12 underneath both. The entry close was 4.0% above the 10-day. On the chart, the two longest averages were still falling from the 2019 decline.
What would have put JMIA on a watchlist was the June push: from 3 to 8 June the stock traded between 3,825,471 and 5,403,016 shares a day while it ran into the pivot. Then, from 26 June to 6 July, price held between 5.10 and 5.65, and from 29 June volume stayed below the 20-day average every session. A trend follower could have written this plan that day. Entry above the 7.19 pivot from 8 June. An initial stop below the 5.10 shelf low from 29 June. The 2.15 base low from 18 March was where the whole structure failed, far too distant for a stop. Then trail the 10-day moving average, widening to the 20-day once the stock was well advanced.
Set that plan beside the 7 July entry and the risk looks very different. A buy near 5.77 with a stop under 5.10 risked 11.6%. A buy at the 7.19 pivot with the same stop risked 29.1%. The early entry bought a tighter stop at the cost of a real chance that the pivot never cleared. On 8 July price traded through 7.19 during the session and closed 9.6% above it.
From 5.77 to 69.89, then the February 2021 exit
A trader using this pattern might have watched whether 7.19 held after the clearance. It did, and the first leg was violent: a 21.00 close on 3 August, then a 23.90 high on 4 August that reversed to a 16.28 close on 57,144,858 shares, the heaviest session in this data set. The first close below the 10-day line came on 11 August at 16.37, and a strict 10-day trail would have ended the trade there, 183.7% above the entry close. The next day Jumia reported second-quarter revenue and merchandise volume down year over year, and the stock closed at 13.15.
By 24 September price had fallen to 7.00, 70.7% below the August high but still above the 5.77 entry. The 8 October add-on marked the restart. A 25 November close at 37.61 and a 49.00 high on 23 December followed.
In January 2021, as Citron turned openly bullish and a filing showed Baillie Gifford holding more than 20% of the shares, two more add-on points came: a 43.30 close on 13 January and a 56.96 close on 22 January on 26,050,062 shares.
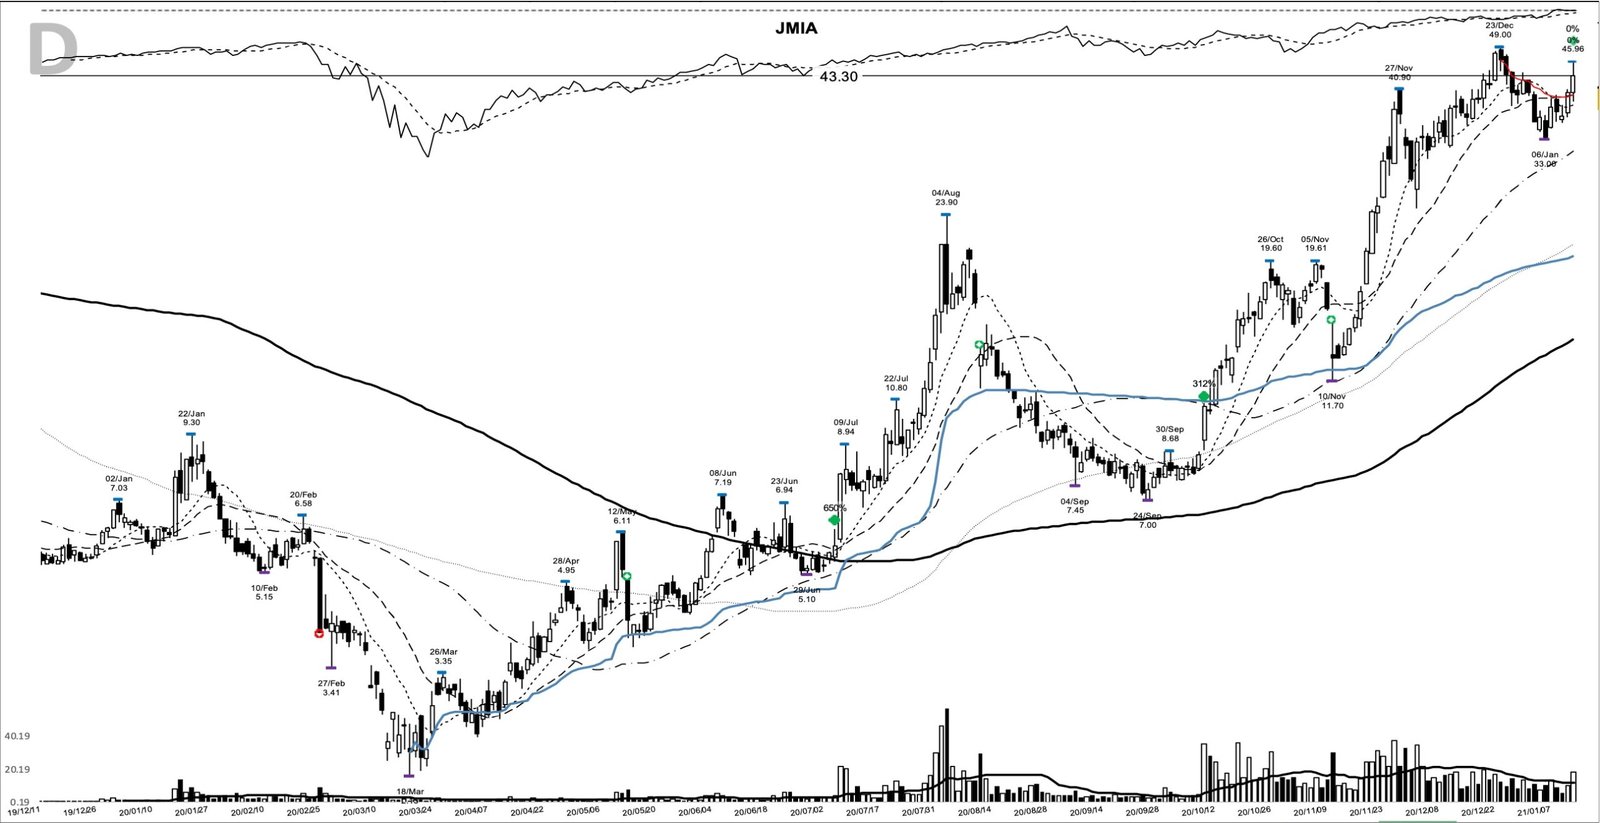
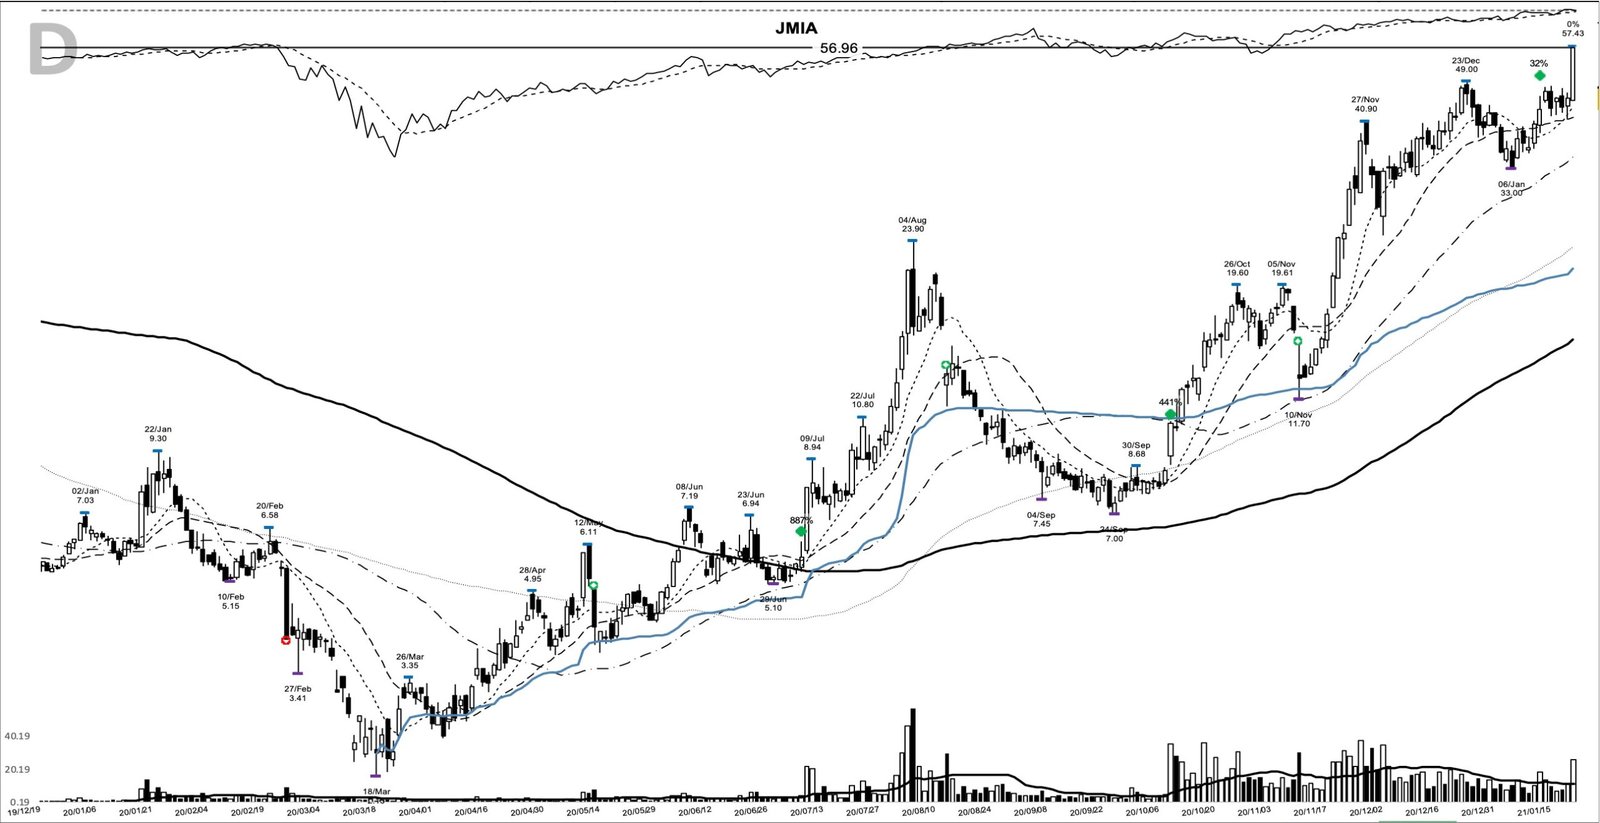
The peak came on 10 February at 69.89, intraday, with a close at 65.51. The first close below the 10-day line arrived on 12 February at 62.43. On 18 February the stock closed at 54.53, the first close below its 20-day average since the 22 January add-on, and that was the exit, 22.0% below the peak. Jumia’s fourth-quarter results were due six days later. A notional 1,000 dollars riding the full move from the first buy would have become about 9,500 dollars.
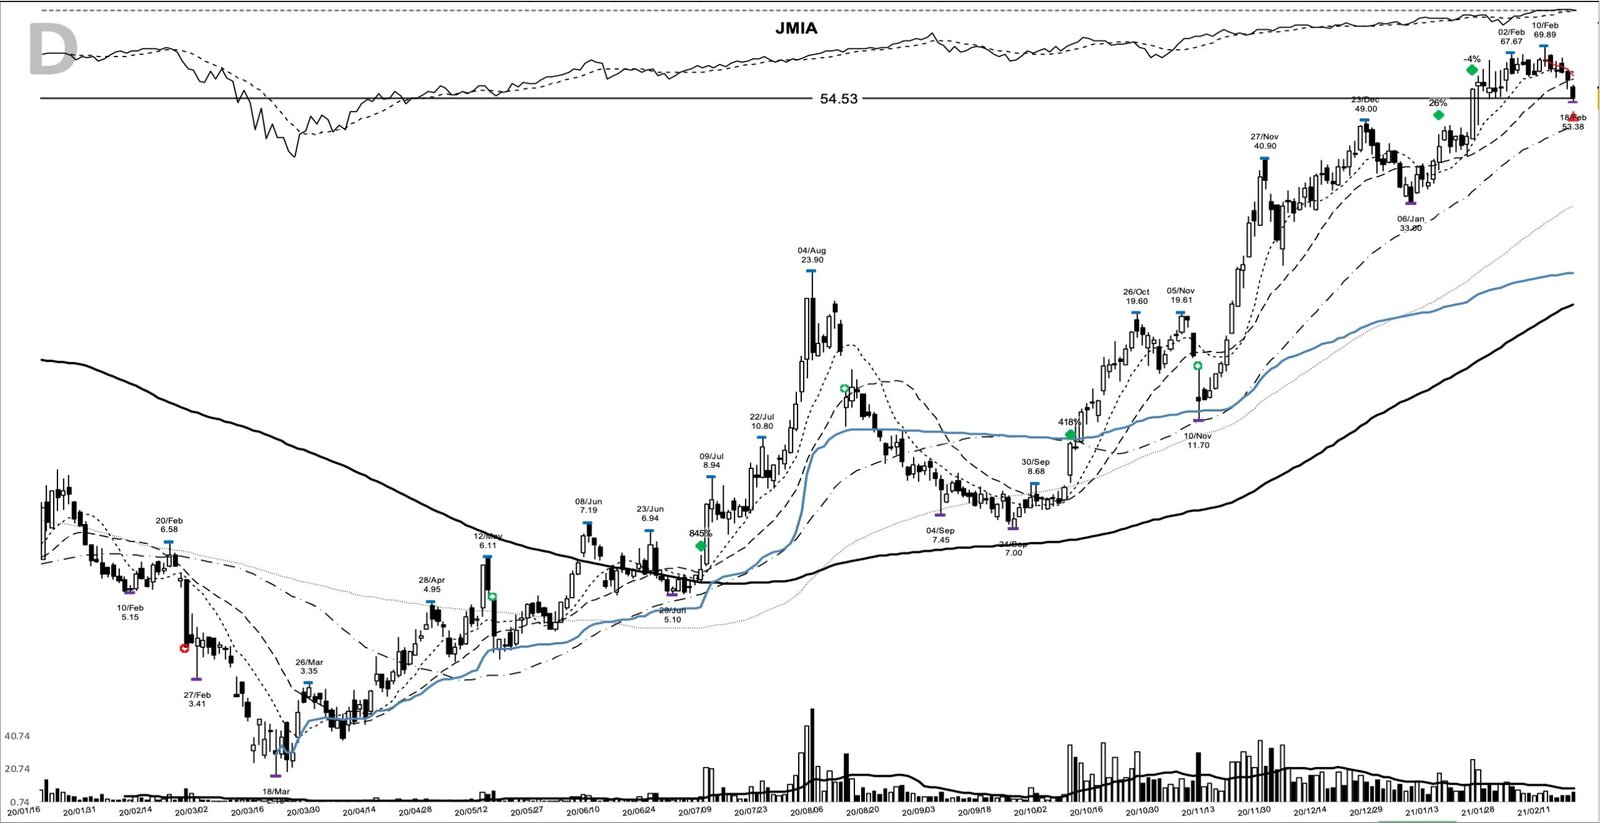
Adding on strength follows the logic of pyramiding into a position, and this chart shows its limit. The October add came 82.3% above the first buy and still had 418.3% left in it. The exit closed 4.3% below the 22 January add.
Three ways the JMIA chart misleads
First, the entry day proved nothing. A 5.77 close on 1.3 times average volume, 19.7% under the pivot, is a bet on what comes next. Without 8 July, the same bar is one more session in a sideways shelf.
Second, the fundamentals didn’t carry this trade. William O’Neil’s model leaders paired base breakouts with accelerating earnings. Jumia had losses and falling merchandise volume, and the 4 August reversal from 23.90 to a 16.28 close shows how fast a story stock can lose its bid.
Third, the late add-ons weren’t free. The 56.96 add on 22 January bought into a stock that had moved 887.2% from the first buy, during the speculative frenzy of early 2021, and it ended under water at the exit. With the pivot that far behind price, each new add carried more risk than the last.
What the July 2020 JMIA entry teaches about risk
An early entry is a trade-off you can measure. On 7 July the early buy risked 11.6% to the shelf, and the pivot buy risked 29.1% to the same level. The early buyer took the risk that the pivot would never clear. Here it cleared the next session, and a stock with no earnings support rode a sector theme for 226 days.
Learn the pattern. Ride the trend. Keep the gains.
Related studies: RUN base breakout July 2020; UPWK base breakout June 2020; BLNK base breakout June 2020. A new winner study lands most evenings.
Price and volume figures are computed from split-adjusted daily OHLCV data; company figures come from SEC filings where cited.
Educational content only. Not investment advice. Trading involves risk. You are responsible for your decisions.
Get the free Market Wisdom e-book
Join Trends and Breakouts — historical winners, breakout studies, and risk lessons. No spam, unsubscribe anytime.