
Two hypothetical indexes share the same 18 weeks of history. Each topped at 112.00, failed at a lower high of 103.00, failed again at 96.00, and slid to a low of 85.00. Each then rebounded to 91.00, a gain of 7.06% in under three weeks, with a follow-through day on the way up. On the week-18 close at 90.70, the charts are identical. One of them is a bear market rally that rolls over and breaks 85.00. The other becomes the first leg of a new uptrend.
Nothing on the week-18 chart tells you which is which. What separates them is the order in which evidence arrives: the daily chart produces rally evidence within days, while the weekly chart needs several more weeks before its structure changes. This guide walks both indexes forward one close at a time.
What a bear market rally looks like on the weekly chart
A bear market rally is an advance inside a broader downtrend. The weekly chart defines that downtrend through its swing points. In the shared history, the highs step down from 112.00 to 103.00 to 96.00, and the lows step down from 97.10 to 89.90 to 85.00. From the 112.00 top to the 85.00 low the index lost 24.11%.
The marked level that matters most is 96.00, the most recent lower high. As long as the index trades below it, every advance still fits the description of a lower high in progress. From the 91.00 rebound high, the index needs another 5.49% to reach it. That gap is the distance between “the market is bouncing” and “the weekly sequence has changed.”
This is the same structure Weinstein stage analysis on the weekly chart classifies as Stage 4: declining highs and lows with price below a falling average. In both figures below, the 10-week simple moving average is still pointing down at week 18.
Zooming in: the daily rebound off 85.00
Drop to the daily chart for the same rebound and the evidence looks better, quickly. The hypothetical sessions below cover the first eight days after the low.
| Day | High | Low | Close | Volume (bn) | What the close adds |
|---|---|---|---|---|---|
| 1 | 86.30 | 85.00 | 86.10 | 1.21 | Rally attempt begins: the low is set and the close is off it |
| 2 | 86.90 | 85.90 | 86.60 | 0.98 | Up 0.58%, low held |
| 3 | 86.80 | 85.70 | 86.30 | 1.05 | Down 0.35%, still above 85.00, so the attempt stays alive |
| 4 | 88.20 | 86.20 | 88.10 | 1.32 | Up 2.09% on 25.7% more volume than day 3: a follow-through day |
| 5 | 88.90 | 87.90 | 88.50 | 1.10 | New rebound high at 88.90 |
| 6 | 88.60 | 87.40 | 87.90 | 0.95 | First pullback, lighter volume, low 87.40 |
| 7 | 89.80 | 87.80 | 89.60 | 1.18 | Daily higher high above 88.90 after a higher low at 87.40 |
| 8 | 90.20 | 89.10 | 89.90 | 1.02 | Rebound extends; week 18 later tops at 91.00 |
Day 4 is the session O’Neil’s method treats as initial confirmation. A follow-through day comes on day four or later of a rally attempt, with a strong percentage gain on volume above the prior session. Here the index rose 2.09% on 1.32 billion shares against 1.05 billion the day before. By day 7 the daily chart has also printed a higher low at 87.40 and a higher high at 89.80. On a daily chart, that’s an uptrend.
The common misread is to carry that daily verdict straight onto the weekly chart. A follow-through day says buyers returned with size after a low. It says nothing yet about whether the weekly sequence of lower highs has ended, because the index is still 5.49% below 96.00 at the 91.00 peak. William O’Neil’s market-direction work framed the follow-through day as a signal to start looking at leading stocks, with confirmation still to come from how those stocks and the index behave afterwards.
Revealing the two indexes, one weekly close at a time
The paths split at week 19. Each row below is a weekly close, and the question for each is the same: what does this close add to the assessment that the previous one didn’t?
| Week | Index A | Index B | What changes |
|---|---|---|---|
| 18 | High 91.00, close 90.70 | High 91.00, close 90.70 | Identical. Daily rally evidence, weekly lower-high structure intact |
| 19 | High 93.40, close 91.80 | High 92.20, close 89.90 | A looks stronger on the week. B starts its first pullback |
| 20 | Low 88.00, close 88.40 | Low 87.60, close 88.90 | A has turned down 2.71% short of 96.00. B’s low sits 3.06% above 85.00 |
| 21 | Low 85.60, close 86.00 | High 93.80, close 93.50 | A is retesting the low. B has confirmed 87.60 as a weekly higher low |
| 22 | Low 83.20, close 83.90 | High 96.90, close 96.60 | A breaks 85.00 by 2.12%. B closes 0.62% above the 96.00 lower high |
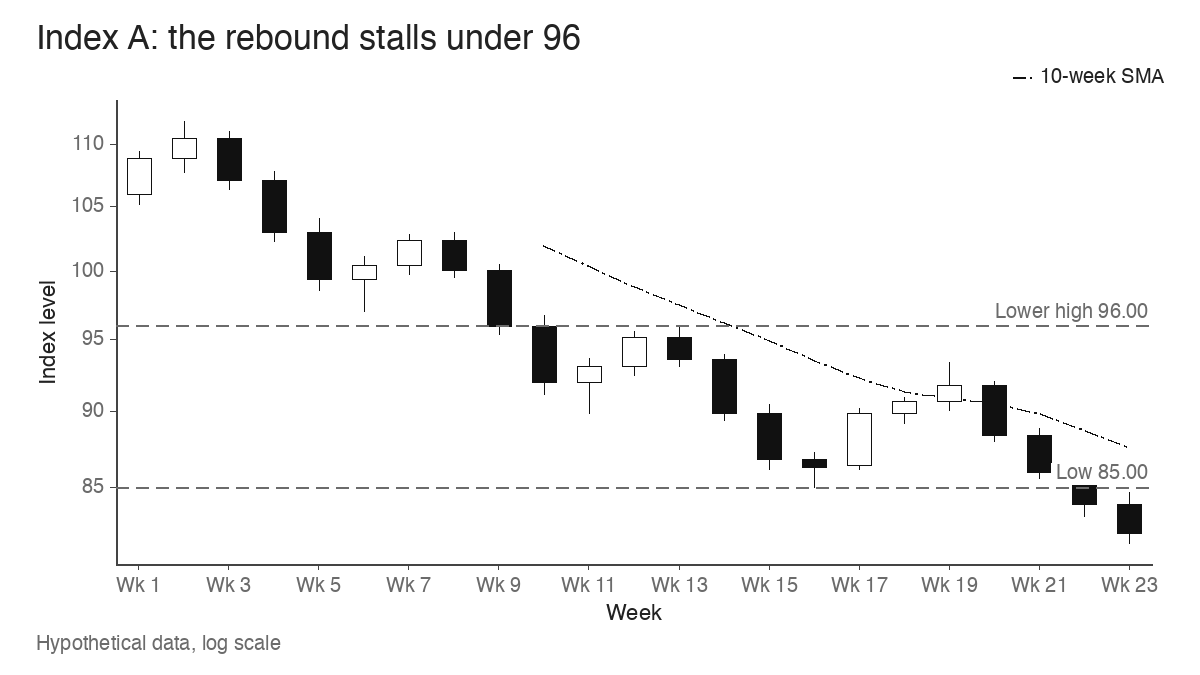
Week 19 is worth pausing on. Index A, the one that fails, has the better week: a higher high at 93.40 and a higher close. Anyone grading the rebound on its most recent bar would have rated A ahead of B. The weekly structure only clarifies once both the pullback low and the response to 96.00 are on the chart.
Index A’s peak at 93.40 is simply the next lower high in the sequence (112.00, 103.00, 96.00, 93.40). Its week-22 break of 85.00 extends the series of lower lows. The day-4 follow-through was valid evidence when it printed. Five weeks later, weekly evidence that took longer to form outweighed it.
Index B’s week-22 close at 96.60 is the first weekly close above a prior lower high since the 112.00 top. Combined with the 87.60 higher low, it gives the weekly chart its first higher low and higher high together.
One break above a swing high is still thin evidence
It’s tempting to call the trend changed at week 22. The close at 96.60 is only 0.62% above 96.00, and a single swing-high break can reverse within a week or two. The stronger test comes on the next pullback.
Index B tops at 100.30 in week 24, then pulls back 5.58% to a low of 94.70 in week 26. That low sits above the 87.60 higher low, which makes it a second higher low in the new sequence. Notice that it also dips 1.30 points under the 96.00 breakout level and closes the week at 95.90, just below it. A strict “never back under the breakout” rule would have flagged that week as a failure, while the weekly swing structure stayed intact. Week 28 then closes at 101.50, above the 100.30 peak.
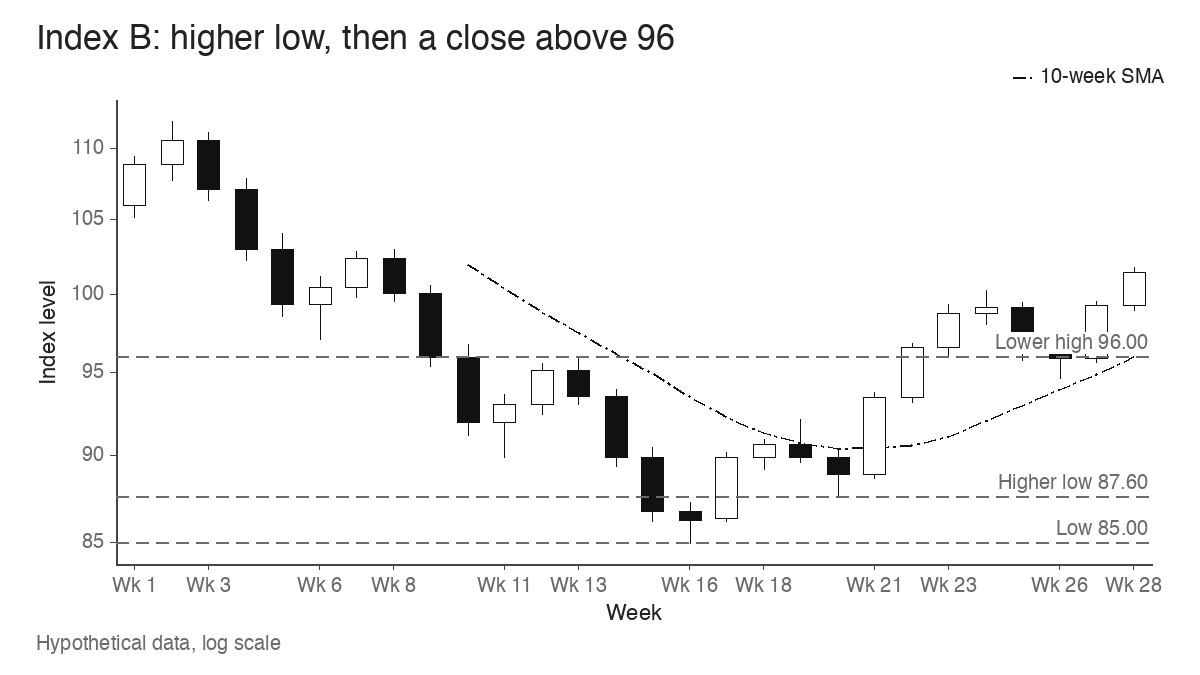
By week 28, Index B’s weekly chart reads higher lows at 87.60 and 94.70 with higher highs at 96.90, 100.30 and 101.80. That’s 11 weeks after the follow-through week. The daily evidence was available in four sessions; the weekly confirmation needed most of a quarter.
Leaders repairing bases versus stocks bouncing off lows
Index charts average everything together, so a rebound can look identical in A and B while the stocks underneath behave very differently. Three hypothetical growth-stock charts during the same rebound show the distinction.
| Stock | Chart during the rebound | Read |
|---|---|---|
| Stock X | Seven-week base from 52.40 down to 41.10, a 21.56% depth. Closes at 49.30, 2.28% above its 48.20 pivot, and the next pullback low is 48.40 | Repairing: a base completed during the downtrend and the pivot is holding on the first test |
| Stock Y | Fell from 72.00 to 38.50, a 46.53% drop. Bounces 20.00% to 46.20 with no base | Bouncing: still 35.83% below its high and needs a 55.84% gain to get back there |
| Stock Z | Breaks out to 65.10, 2.52% above a 63.50 pivot, then closes the week at 61.80 | Failed breakout: back 2.68% under the pivot within the week |
Stock Y often looks like the best performer in the first two weeks of a rebound, because the most beaten-down stocks bounce hardest. A 20.00% rise from 38.50 says nothing about leadership. Stock X is the chart a trader using O’Neil’s approach might watch: a base that formed while the index was still falling and a pivot that holds once tested. If the rebound list fills with charts like Y and Z, it fits Index A’s path. More charts like X fit Index B’s.
Breadth adds a third check. In new highs and new lows data, a bear market rally typically shows new lows shrinking while new highs stay scarce. A healthier recovery shows new highs expanding as stocks like X clear their pivots. In Index A’s case, a rising count of distribution days during weeks 19 and 20 would have been another early sign that the advance was meeting supply below 96.00.
Where weekly confirmation arrives late
The obvious limitation is speed. A stronger trend becomes easier to identify as evidence accumulates, and by the time Index B had two weekly higher lows, it already stood at 101.50, 19.41% above the 85.00 low. Waiting for the full weekly sequence costs part of the move.
V-shaped recoveries make this worse. When an index rises straight off a low without a meaningful pullback, there’s no higher weekly low to mark for weeks, sometimes months. The weekly chart keeps describing a downtrend while price climbs through it. The daily follow-through and the behaviour of leading stocks are the only evidence available in that window.
The two hypothetical indexes looked the same for 18 weeks and for the first follow-through day. The difference showed up in the pullback low and in the response to 96.00, and neither could be seen before it happened. A daily signal opens the question; the weekly swing points answer it.
Learn the pattern. Ride the trend. Keep the gains.
Educational content only. Not investment advice. Trading involves risk. You are responsible for your decisions.
Get the free Market Wisdom e-book
Join Trends and Breakouts — historical winners, breakout studies, and risk lessons. No spam, unsubscribe anytime.