Strategy Capacity: When Trade Size Changes the Result

A backtest can look flawless and still be untradeable. I've watched rules with clean equity curves that assumed every signal filled at the closing print fall apart the moment real…

Comments Off on Strategy Capacity: When Trade Size Changes the Result

Rank Correlation: Measuring Screen Ranking Stability

You run a factor screen at the end of August, and the ten names at the top look familiar. You run it again four weeks later. The same companies are…

Comments Off on Rank Correlation: Measuring Screen Ranking Stability

Heteroskedasticity: Why Model Errors Change Size in Markets

A backtest hands you a clean-looking number. The strategy's average edge is 0.4% a week, the confidence interval sits comfortably away from zero, and the significance test says a result…

Comments Off on Heteroskedasticity: Why Model Errors Change Size in Markets

Maximum Drawdown: Reading a Peak-to-Trough Decline

Two accounts finish the year at the same value, built from the same set of returns. One you could have held without much stress. The other spent months trading below…

Comments Off on Maximum Drawdown: Reading a Peak-to-Trough Decline
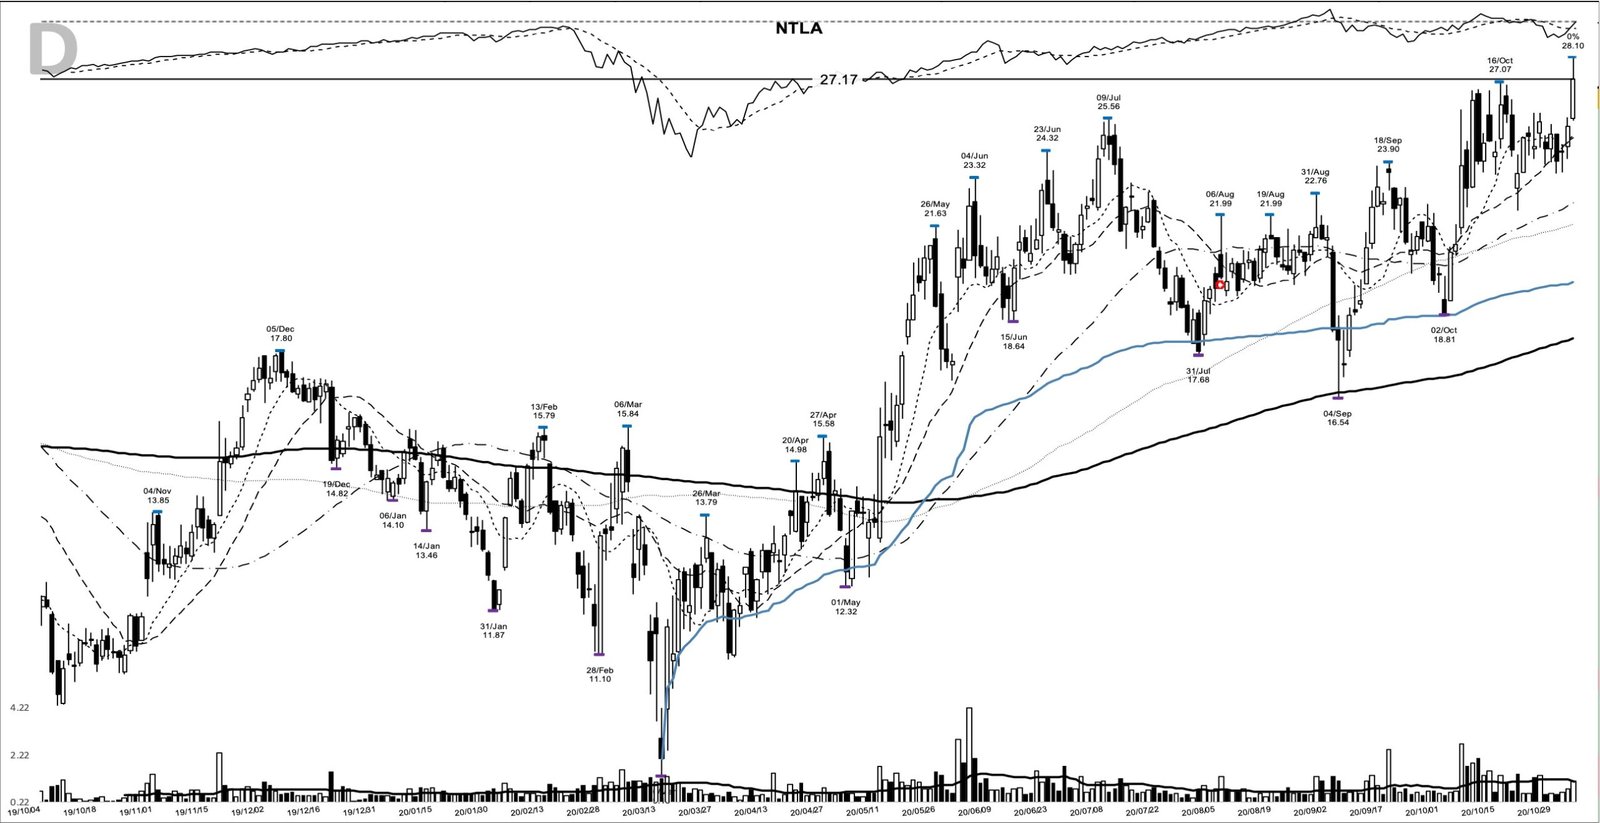
Read more about the article NTLA +114%: a CRISPR base breakout, November 2020
NTLA on the 2020-11-04 breakout entry, from my chart archive

NTLA +114%: a CRISPR base breakout, November 2020

NTLA is back near the top of the trending lists this week, and every time a ticker like this reappears it is worth pulling the chart that made it interesting…

Comments Off on NTLA +114%: a CRISPR base breakout, November 2020

Market Fragmentation: How One Stock Trades Across Venues

Pull up two market data feeds on the same stock at the same second and you'll often see them disagree. One shows 1,200 shares offered at 48.75. The other shows…

Comments Off on Market Fragmentation: How One Stock Trades Across Venues
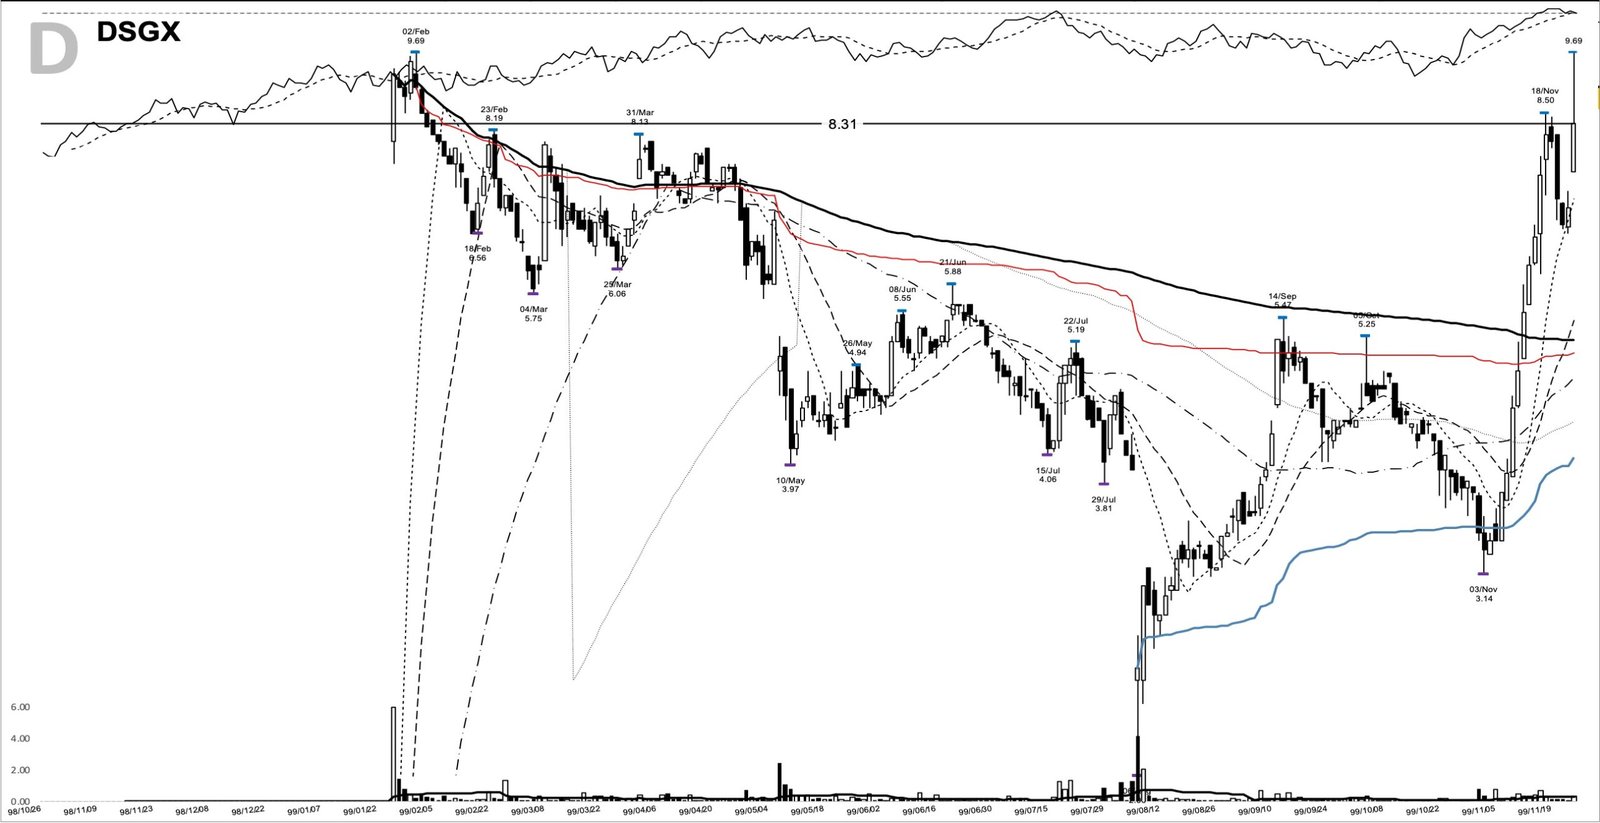
Read more about the article DSGX +399%: a deep base breakout into the dot-com run, November 1999
DSGX on the 1999-11-26 breakout entry, from my chart archive

DSGX +399%: a deep base breakout into the dot-com run, November 1999

DSGX is back among the day's big gainers this week, helped by a higher analyst price target, so it's worth pulling up a much older chart. Back in late 1999,…

Comments Off on DSGX +399%: a deep base breakout into the dot-com run, November 1999

Investable Universe: The List Behind Every Stock Screen

Two traders run what they call the same momentum screen on Monday morning. Both rank US equities by six-month price change, both take the top twenty, and both trust the…

Comments Off on Investable Universe: The List Behind Every Stock Screen

Cross-Impact in Trading: How One Order Moves Another

An index future ticks higher on a burst of buying. A beat later, the best offer on one of its larger constituents lifts by a couple of cents, and the…

Comments Off on Cross-Impact in Trading: How One Order Moves Another

Price Discovery: How Markets Turn Orders Into Prices

A company reports earnings after the close, the print lands a little ahead of estimates, and by the time the stock reopens it's trading four percent higher. Stare at that…

Comments Off on Price Discovery: How Markets Turn Orders Into Prices