Time Aggregation: Why the Chart Clock Changes What You See

Two traders pull up the same stock on the same day and come away describing two different markets. One calls it a quiet session, up a fraction, nothing worth a…

Comments Off on Time Aggregation: Why the Chart Clock Changes What You See

Queue Priority: How Order Position Shapes Execution

Picture a bid at 50.00 showing 40,000 shares. You add a limit buy at that same price, then watch the prints roll by. Trades go off, the tape ticks, and…

Comments Off on Queue Priority: How Order Position Shapes Execution
Read more about the article FUTU +1170%: a base breakout off the 2020 washout, May 2020
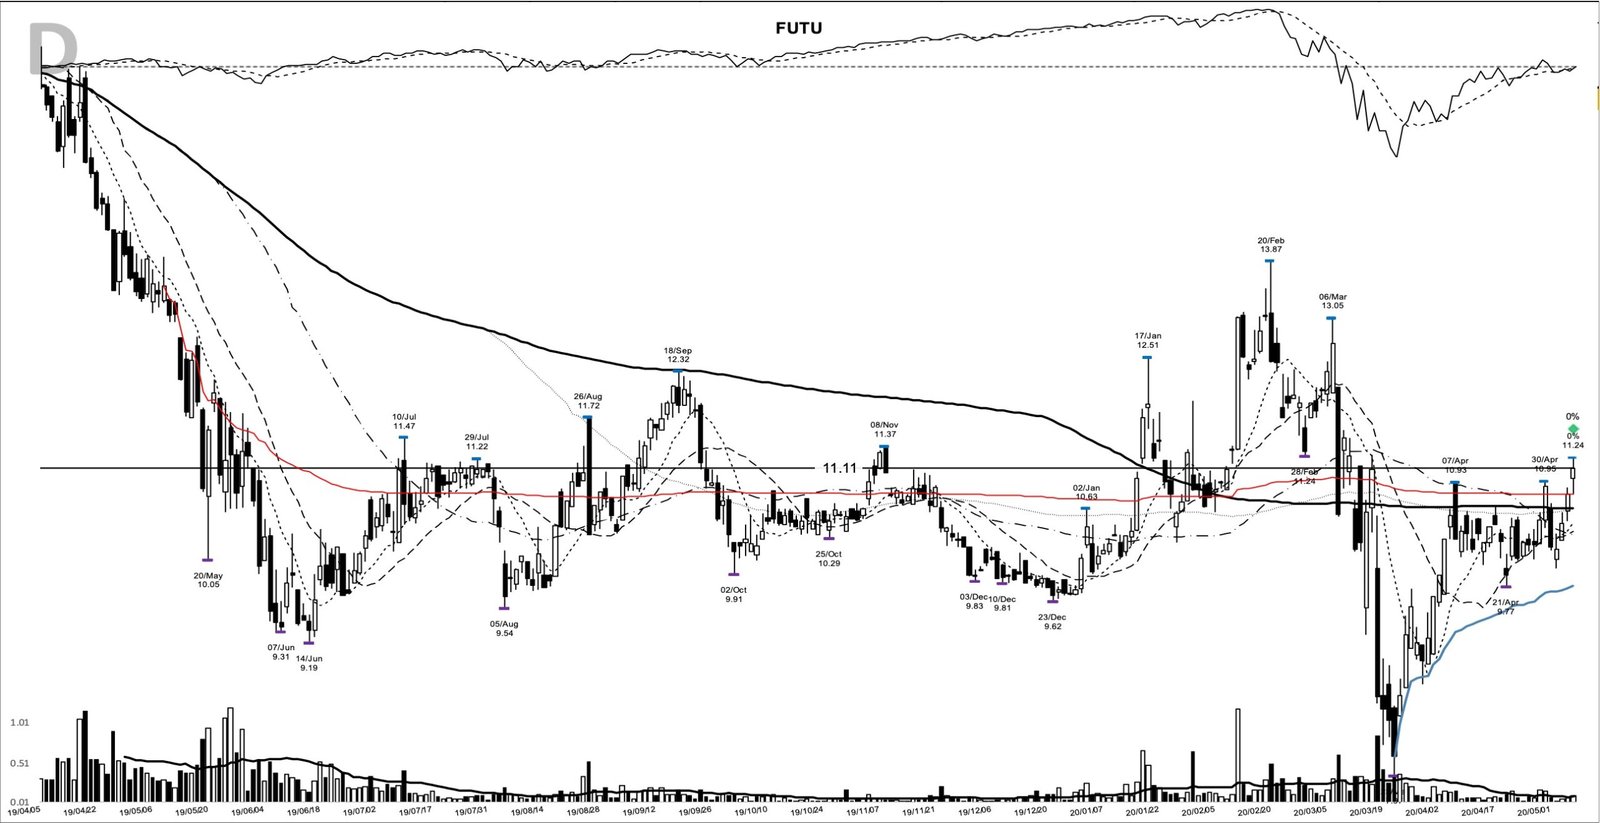
FUTU on the 2020-05-07 breakout entry, from my chart archive

FUTU +1170%: a base breakout off the 2020 washout, May 2020

FUTU is back near the top of the day's gainers, and that pulls a familiar chart out of the archive. Long before Futu Holdings was posting record quarters, the FUTU…

Comments Off on FUTU +1170%: a base breakout off the 2020 washout, May 2020

Effective Number of Holdings: A Concentration Check

A trader opens a brokerage statement and counts twenty tickers. Twenty names feels diversified. Then two of those positions have run so far that together they carry roughly half the…

Comments Off on Effective Number of Holdings: A Concentration Check

Order Flow Persistence: Reading Runs of Signed Flow

Watch a fast tape long enough and you'll see it: a stream of prints that keep lifting the offer, one after another, twenty or thirty in a row, and not…

Comments Off on Order Flow Persistence: Reading Runs of Signed Flow
Read more about the article AMR +1526%: the coal-cycle base breakout, December 2020
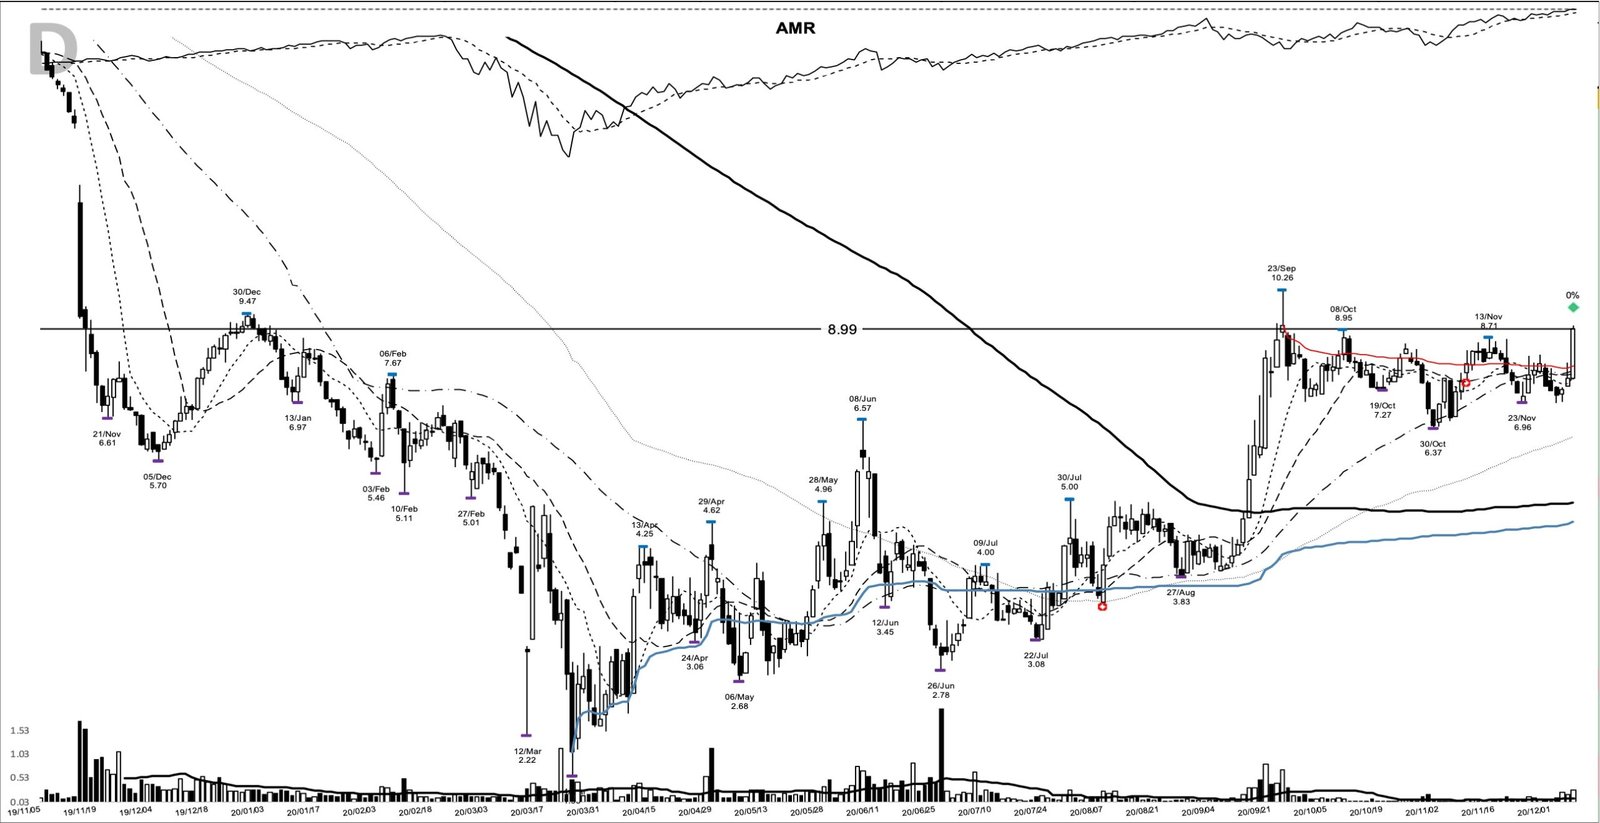
AMR on the 2020-12-07 breakout entry, from my chart archive

AMR +1526%: the coal-cycle base breakout, December 2020

AMR is back among the day's biggest gainers, which makes this a good moment to pull the chart that turned a forgotten coal miner into a textbook base breakout. In…

Comments Off on AMR +1526%: the coal-cycle base breakout, December 2020

Information Coefficient: How to Judge a Ranking Model

Someone hands you a backtest. The headline reads: an information coefficient of 0.06, a smooth equity curve, and a claim that the model ranks stocks better than the market does.…

Comments Off on Information Coefficient: How to Judge a Ranking Model

Futures Curve: Contango, Backwardation and Roll Yield

A commodity chart can mislead you without a single bad print. Pull up a multi-year continuous chart for crude oil or natural gas, watch it grind higher, and it's tempting…

Comments Off on Futures Curve: Contango, Backwardation and Roll Yield

Adjusted Price Series: Why Your Old Chart Prices Change

Two charts of the same stock, side by side, and they disagree. One shows a long climb toward 100.00 that halves to 50.00 in a single session. The other runs…

Comments Off on Adjusted Price Series: Why Your Old Chart Prices Change

Hidden Markov Model: What Market Regime Labels Mean

You open a backtest and one line stops you. The strategy, it reports, only performs in the low-volatility regime. Somewhere a stretch of the chart has been tagged calm and…

Comments Off on Hidden Markov Model: What Market Regime Labels Mean