Trading Around Macro Data Releases: Why the Chart Breaks

You're long a clean setup. Price has held a shelf for two sessions, the anchored VWAP off the low keeps rising, and order flow has leaned to the bid since…

Comments Off on Trading Around Macro Data Releases: Why the Chart Breaks
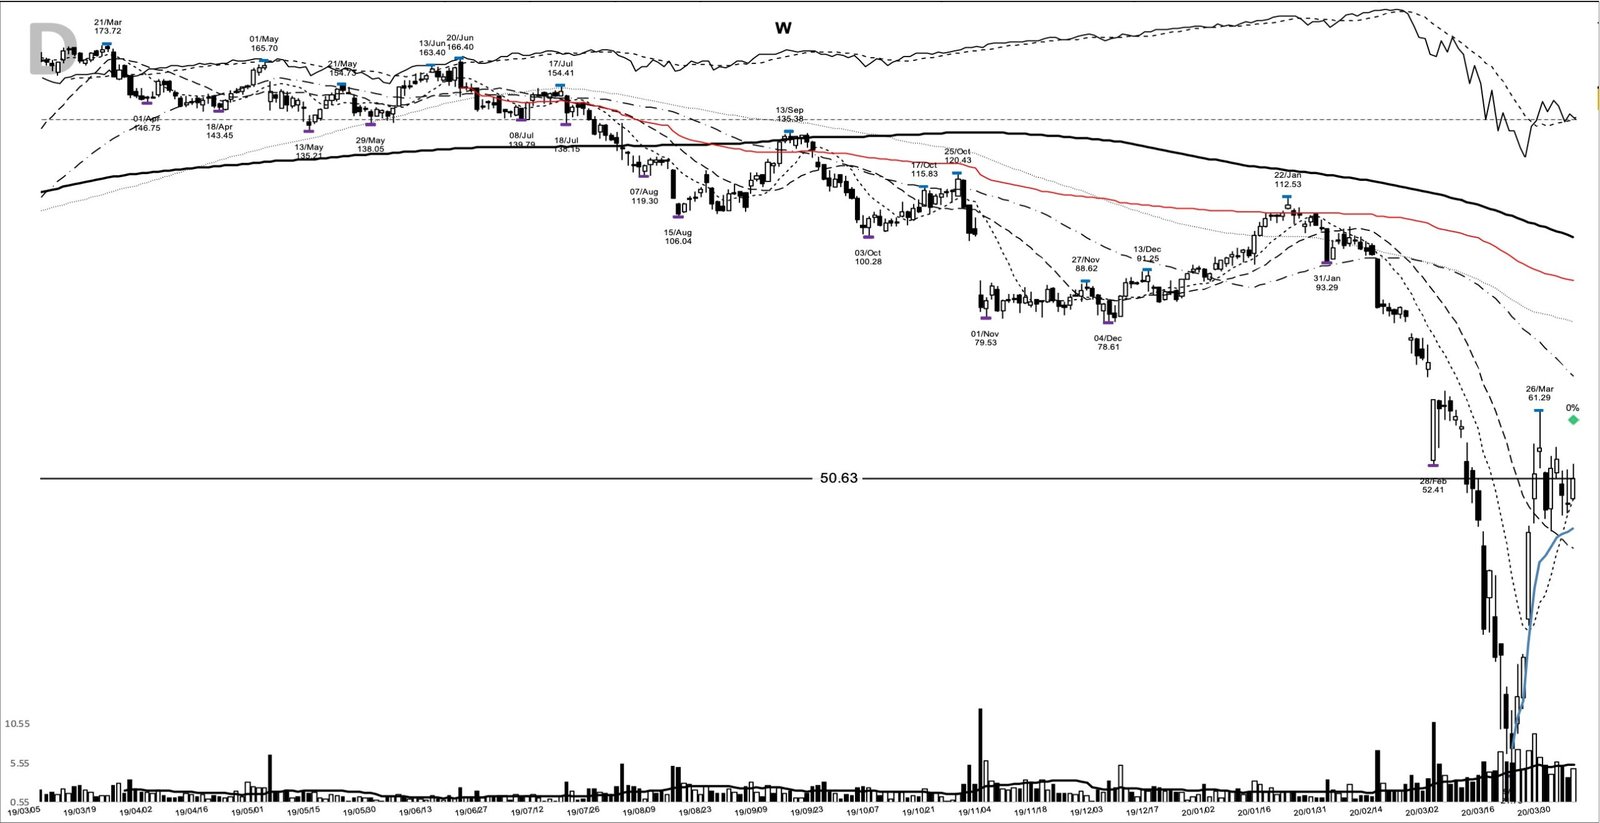
Read more about the article W +486%: the base breakout out of the COVID crash, April 2020
W on the 2020-04-03 breakout entry, from my chart archive

W +486%: the base breakout out of the COVID crash, April 2020

Wayfair (W) is trending again, sitting near the top of the day's gainers on 27 July 2026 as brokers hike their price targets into the company's 4 August earnings date…

Comments Off on W +486%: the base breakout out of the COVID crash, April 2020

Trend Following Systems: Three Ways to Read a Trend

You pull up a chart of a stock that's clearly been climbing for months. The 50-day moving average sits comfortably above the 200-day, so your trend filter says long. Then…

Comments Off on Trend Following Systems: Three Ways to Read a Trend

Bull Flag Pattern: How the Flagpole Defines the Setup

A stock runs 30% in six sessions, then goes quiet. The candles shrink, the volume dries up, and price drifts sideways for a week. Most traders read that stall as…

Comments Off on Bull Flag Pattern: How the Flagpole Defines the Setup
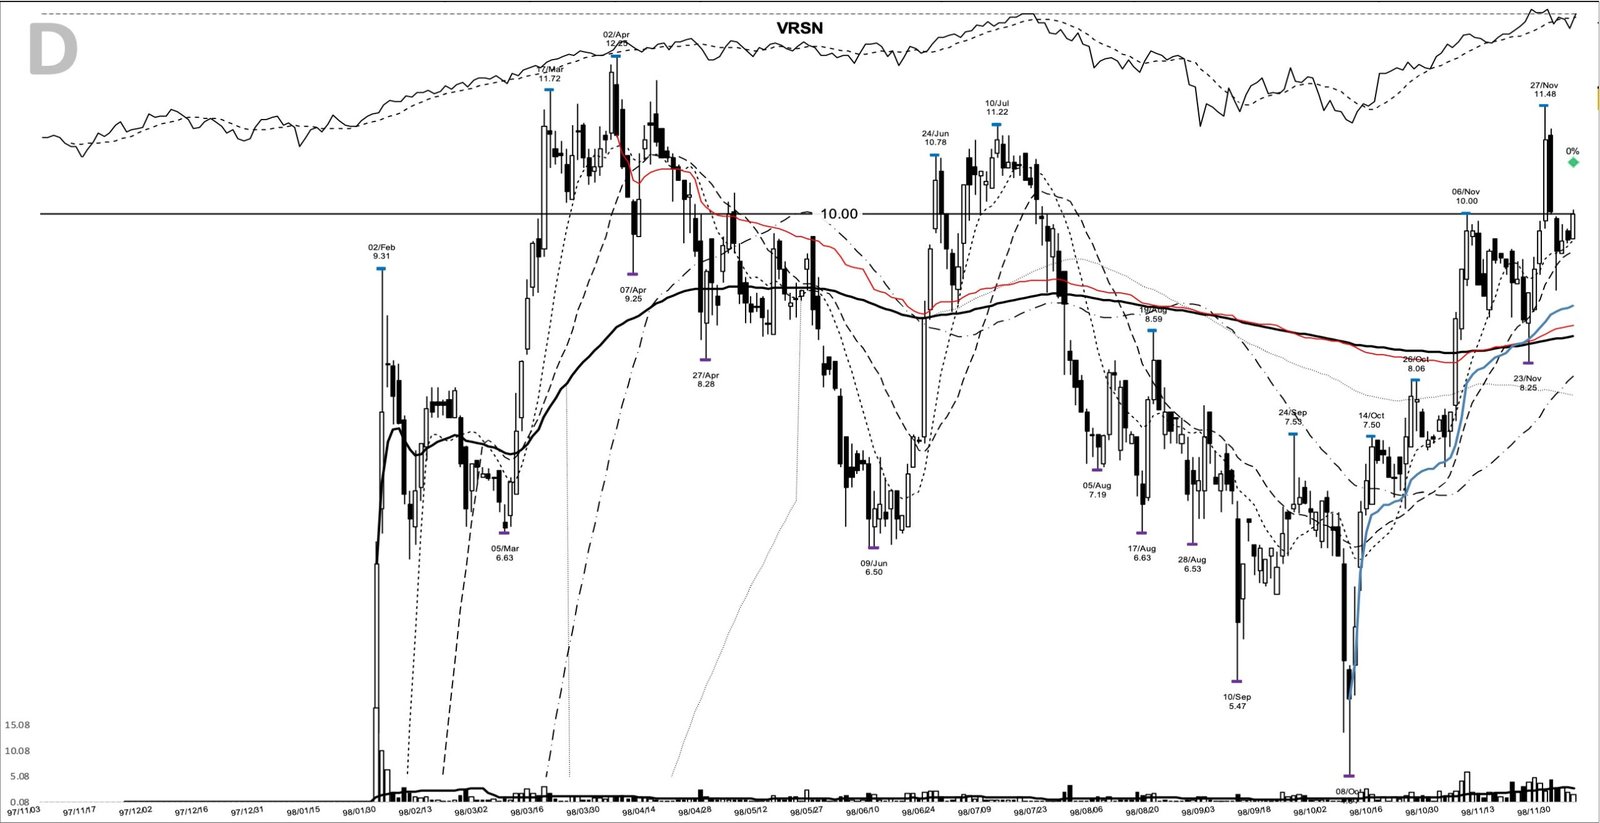
Read more about the article VRSN +1848%: a base breakout that ran 467 days, December 1998
VRSN on the 1998-12-04 breakout entry, from my chart archive

VRSN +1848%: a base breakout that ran 467 days, December 1998

VRSN's back on traders' screens this week, popping onto Yahoo's gainers list after VeriSign's 23 July quarterly report and a raised full-year outlook. That's a fair excuse to pull the…

Comments Off on VRSN +1848%: a base breakout that ran 467 days, December 1998
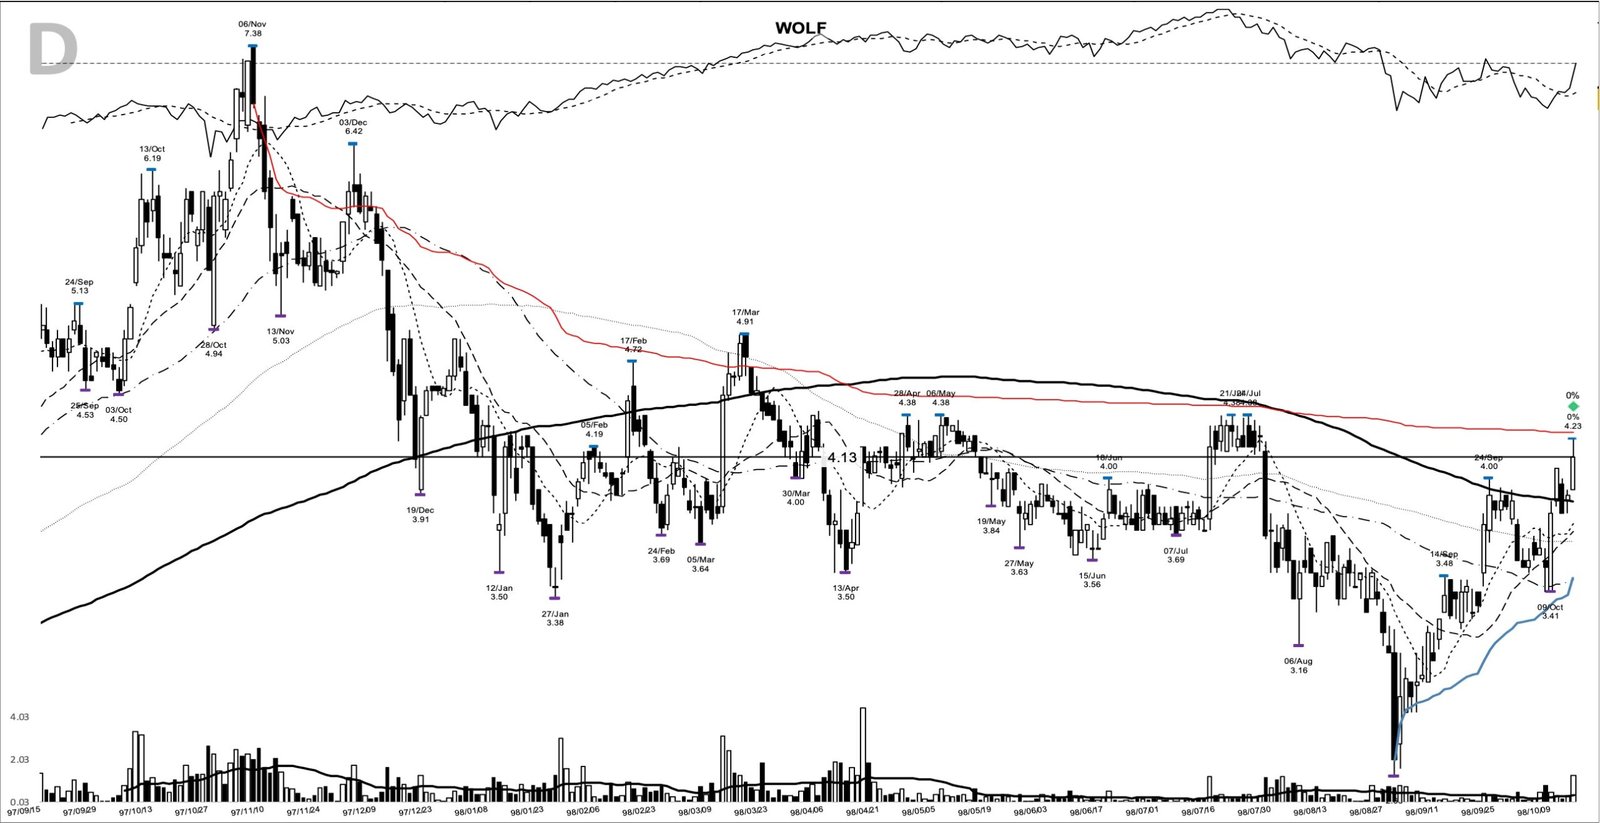
Read more about the article WOLF +1876%: the silicon-carbide base breakout, October 1998
WOLF on the 1998-10-15 breakout entry, from my chart archive

WOLF +1876%: the silicon-carbide base breakout, October 1998

On 15 October 1998, a small silicon carbide chip maker closed at 4.12 and pushed above the shelf it had been building for the better part of a year. That…

Comments Off on WOLF +1876%: the silicon-carbide base breakout, October 1998

Variance Ratio: Is Your Market Trending or Reverting?

You've got a chart in front of you and a decision to make before you touch a single indicator: reach for a breakout tool that assumes the move keeps running,…

Comments Off on Variance Ratio: Is Your Market Trending or Reverting?
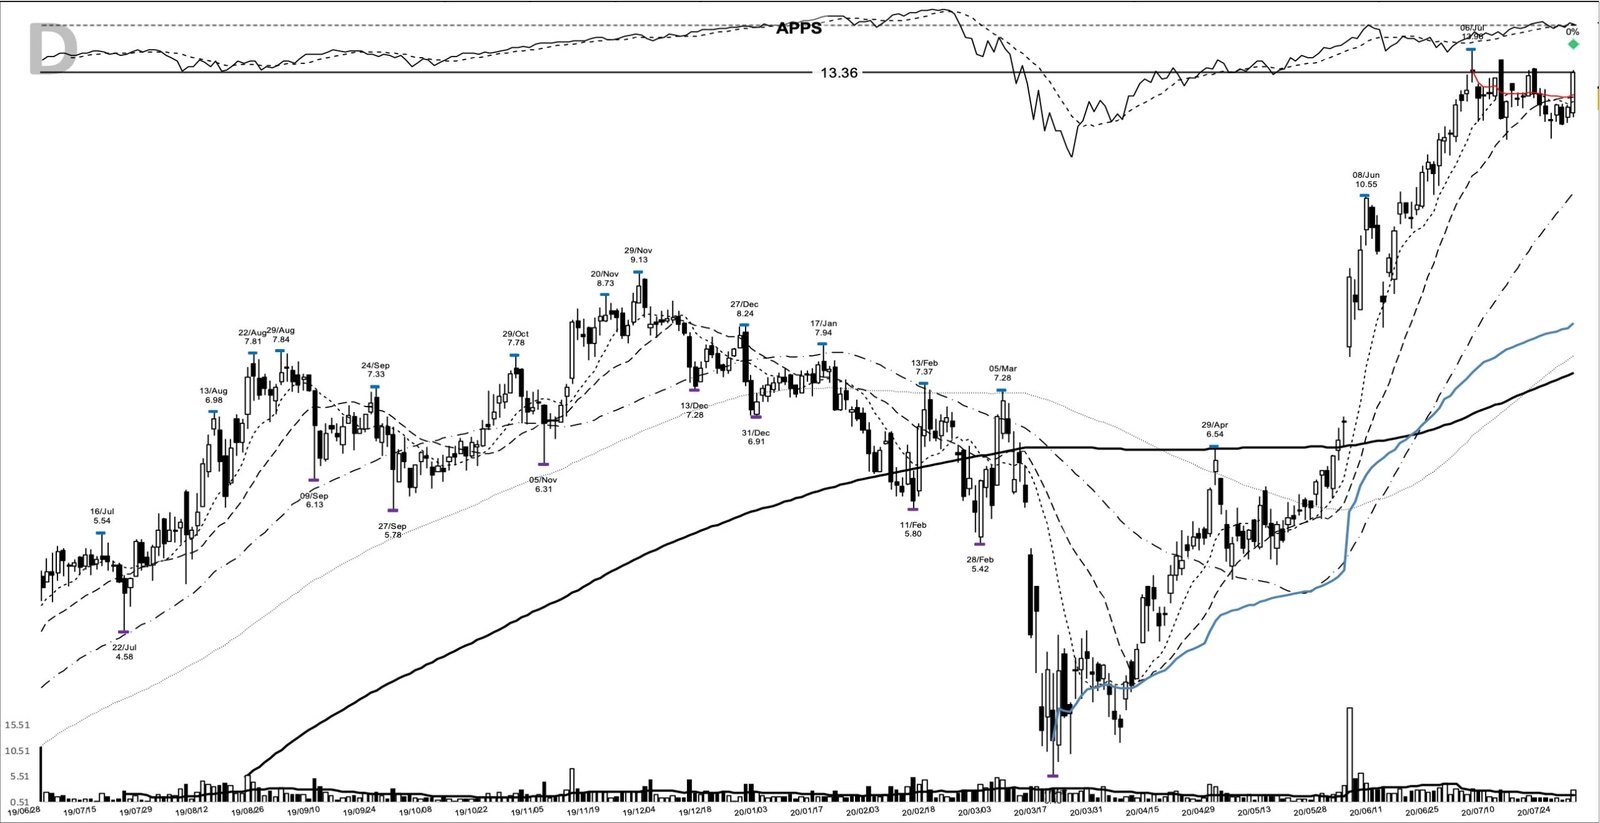
Read more about the article APPS +364%: the base breakout that ran into 2021, July 2020
APPS on the 2020-07-30 breakout entry, from my chart archive

APPS +364%: the base breakout that ran into 2021, July 2020

Digital Turbine, which trades under the ticker APPS, is back among the most-watched names on StockTwits this week. That's reason enough to pull up its chart from the summer of…

Comments Off on APPS +364%: the base breakout that ran into 2021, July 2020

End-to-End Portfolio Policies vs a Simple Momentum Rule

You have two versions of the same trend system in front of you. One is a single line of code: take each market's own return series, smooth it with a…

Comments Off on End-to-End Portfolio Policies vs a Simple Momentum Rule

The 52-Week High Effect: Why New Highs Lead to More Gains

A stock posts a clean earnings beat, raises guidance, and the tape barely moves. It sits four percent under its 52-week high and drifts sideways for three weeks while the…

Comments Off on The 52-Week High Effect: Why New Highs Lead to More Gains