Digital Turbine, which trades under the ticker APPS, is back among the most-watched names on StockTwits this week. That’s reason enough to pull up its chart from the summer of 2020, when the stock was a very different size and setting up as one of the cleaner leaders of that year. Price had spent months carving a deep base after the March crash, coiling under a well-defined ceiling on quiet volume. The APPS base breakout that followed ran 363.5% over the next 221 calendar days, from a 13.36 entry close in July 2020 to a 61.92 exit the following March.
What you’re studying here is how ordinary the setup looked the week it triggered, and how much the fundamentals underneath were already moving. The size of the gain is almost beside the point.
Key takeaways from the APPS base breakout
- The pivot to clear was 13.96, the 6 July 2020 high that capped a deep post-crash base.
- The 13.36 entry close on 30 July 2020 came on volume running 1.6 times the 20-day average.
- Revenue growth was accelerating into the move: up 44.7% year over year in the March 2020 quarter, then 93.1% in the June quarter.
- The move ran 363.5% in 221 calendar days to a 61.92 exit on 8 March 2021, after a 102.56 peak on 2 March.
- There were two clean opportunities to add on strength, in December 2020 and January 2021, as the stock rode its moving averages higher.
The APPS trade at a glance
| Ticker | APPS |
|---|---|
| Study entry date (anticipatory) | 30 July 2020 |
| Entry close | 13.36 |
| Pivot | 13.96 |
| Pivot cleared | 3 August 2020 at a close of 14.88 |
| Volume vs 20-day average | 1.6x |
| Exit date | 8 March 2021 |
| Exit close | 61.92 |
| Gain | 363.5% |
| Calendar days | 221 |
| Peak before exit | 102.56 (2 March 2021) |
Reading the APPS daily chart at the 30 July 2020 entry
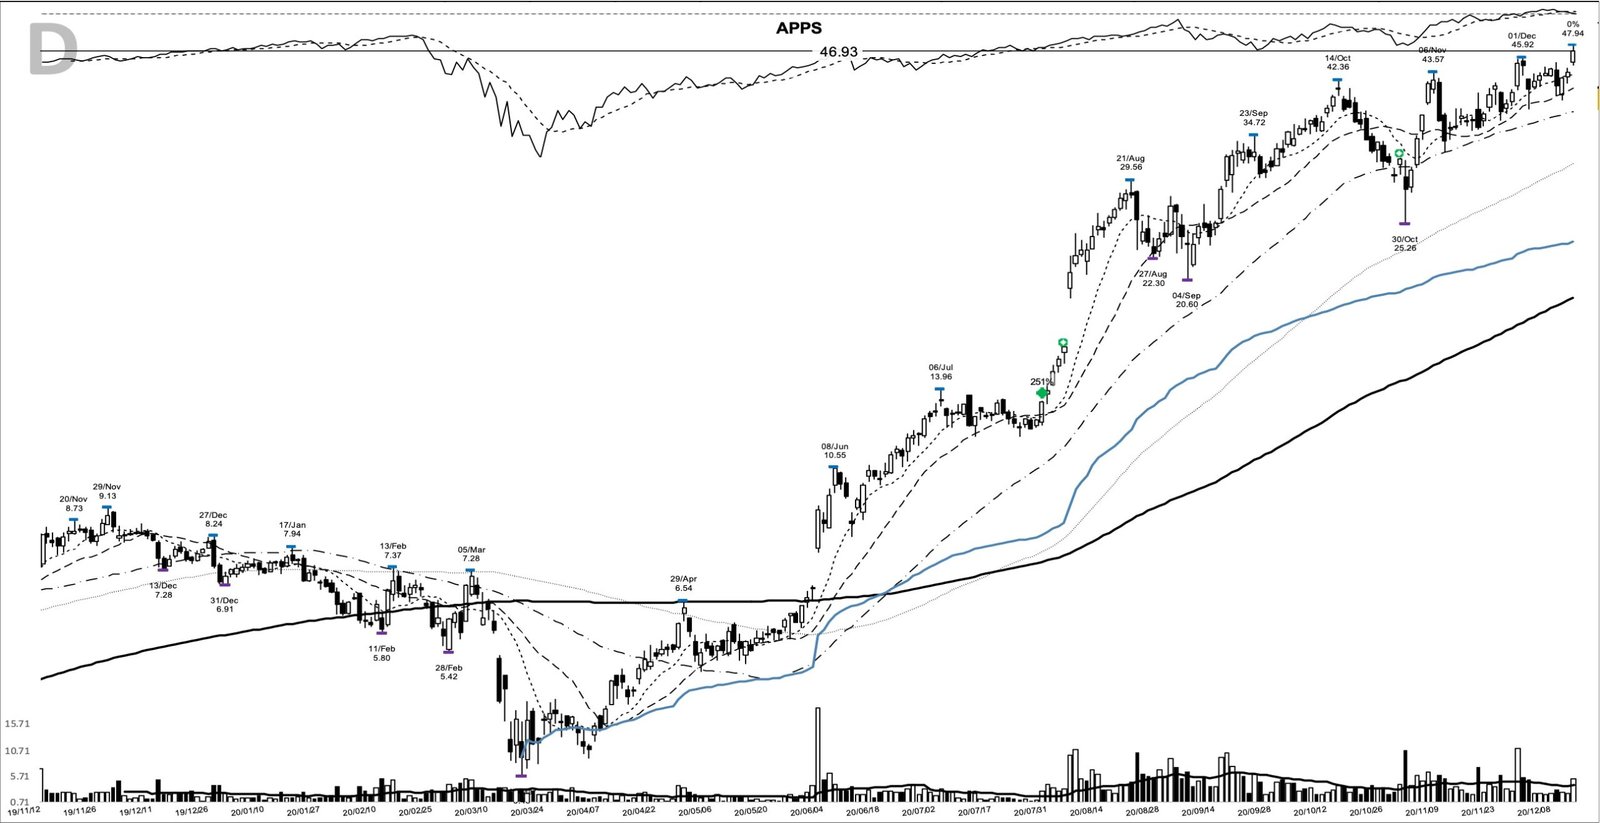
The chart below comes from my study archive. It’s the daily view as of the entry, and it tells the story in three parts. On the left, the stock spends 2019 grinding higher in the mid-single digits. In the middle, the March 2020 crash tears it down to a 3.48 low on 18 March, a drop of about 75% from the base high. On the right, a large-volume push in early June, the tall bar on the histogram, kicks off the recovery leg that carries price back toward the old ceiling.
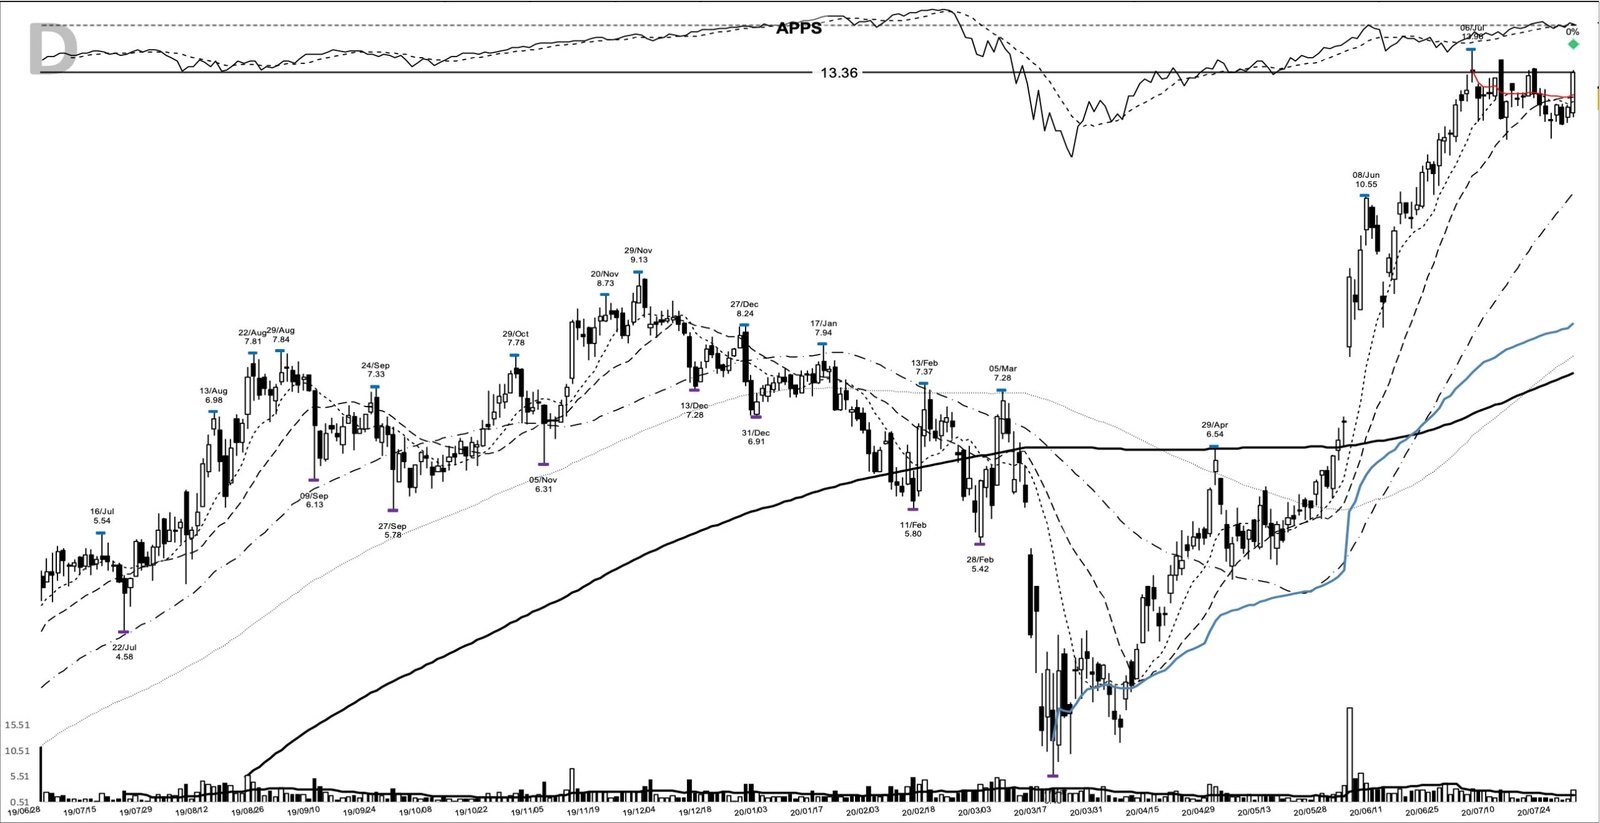
By the entry, the 50-day line at 10.62 had turned up and price sat well above it. The 10-day at 12.66 and the 20-day at 12.75 were clustered together, and the 30 July bar was the first close back above them after a quiet week. That’s a calm posture, not an extended one, which is exactly what you’re after under a pivot.
How the base and the 13.96 pivot formed
The base ran roughly six months, from the March low to late July, and it was deep. From 3.48 the stock rebuilt all the way to a 13.96 high on 6 July, then pulled back and went quiet. That 13.96 print is the pivot, and it’s the overhead resistance a breakout has to clear. The tightest part of the shelf sat at an 11.79 low on 24 July, and price coiled between there and the pivot for the back half of the month.
The 30 July bar opened at 12.39, ran to a 13.42 high, and closed at 13.36 on volume of about 2.88 million shares, 1.6 times the 20-day average. Rising volume on the push off the shelf is the tell trend followers look for, and it’s worth reading volume as closely as price here. Note what the entry didn’t do: it didn’t clear the 13.96 pivot that day. The close of 13.36 was still under it. The pivot gave way over the next few sessions, with a 14.27 high on 31 July and a 14.88 close by 3 August. That sequence makes the marked entry an anticipatory one, set two sessions before the 13.96 pivot cleared on a 14.88 close.
What Digital Turbine’s business was doing as the base built
Digital Turbine sits in software and IT services, and its niche is on-device app delivery. Its SingleTap technology installs apps on carrier and manufacturer handsets with a single tap, bypassing the app store, and it sells mobile advertising and content on top of that footprint. In July 2020 the company was widening those deals, including a partnership to distribute TikTok on device inventory in North America.
The numbers underneath were accelerating, and that’s what separates a real leader from a chart that merely looks ready. Into the entry, the last reported quarter, the three months to March 2020, showed revenue up 44.7% year over year, a step up from the high-30s pace it ran through 2019. Earnings had swung from a two-cent quarterly loss in mid-2019 to a four-cent profit by the December 2019 quarter. A week after the entry, the June quarter landed up 93.1% with eleven cents of earnings, and the stock gapped from the mid-teens toward a 21.27 close on 6 August. That’s the earnings-plus-price combination the CANSLIM trading system is built around, and it’s what traders like William O’Neil spent careers cataloguing.
The market backdrop in the summer of 2020
Context helped. By late July 2020 the broad market was in the fourth straight month of a powerful recovery off the March low, and the leadership was firmly in growth and technology. Big-cap software and internet names were posting strong reports and getting rewarded for them. A young, fast-growing mobile software company was pushing off its base with the tape at its back, and that’s an alignment that matters as much as any single candle.
Strictly read, the tape that week was moving sideways while earnings season played out, digestion after a huge run rather than fresh acceleration. In a consolidating market the names that keep printing relative strength are the ones carrying real demand, and APPS pressing its highs while the averages caught their breath was exactly that tell.
Preparing for the APPS breakout before it happened
A trader watching this name in July 2020 had a short, concrete checklist. Price was holding above a rising 50-day line at 10.62, revenue growth was accelerating, and the stock had built a defined shelf under a clear 13.96 pivot. Those three conditions, structure plus growth plus a level, are what put a name on a watchlist before it moves. That’s the trend-following preparation that turns a breakout from a surprise into a plan.
Here’s the plan a trend follower could’ve written that day, straight off the anchors. Enter on strength above the 13.96 pivot. Set the initial stop below the 11.79 shelf low, with the 3.48 base low as the deeper point where the whole structure fails. Then manage the winner by trailing the 10-day line, at 12.66 on the entry day, and widening the trail to the 20-day once the move is well advanced. The entry gets you in; it’s the trail that lets a 363.5% run actually reach your account.
How the APPS move played out into 2021
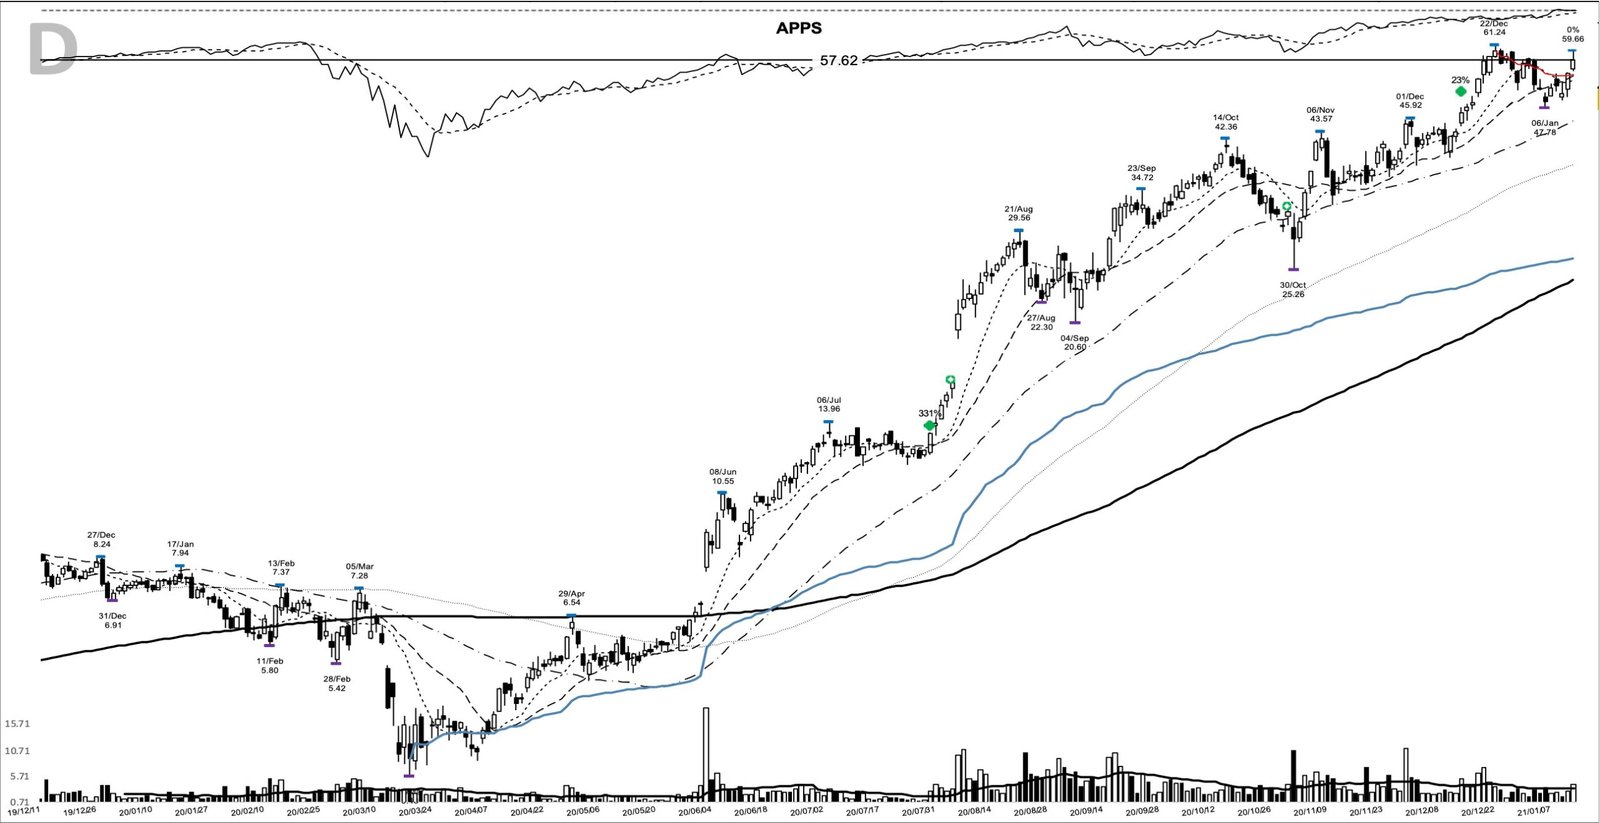
From here on it’s a historical record, retold for the lesson, not a recommendation. A trader using this pattern might’ve watched for the pivot to clear and the trail to hold, and both did. After the 6 August gap the stock trended up through the autumn, and the marked chart shows two spots where strength offered a chance to add: a 46.93 close on 14 December, up 251.3% from the entry, and a 57.62 close on 13 January 2021, up 331.3%. Adding on strength rather than on weakness is a position-sizing choice that keeps risk anchored to the trend.
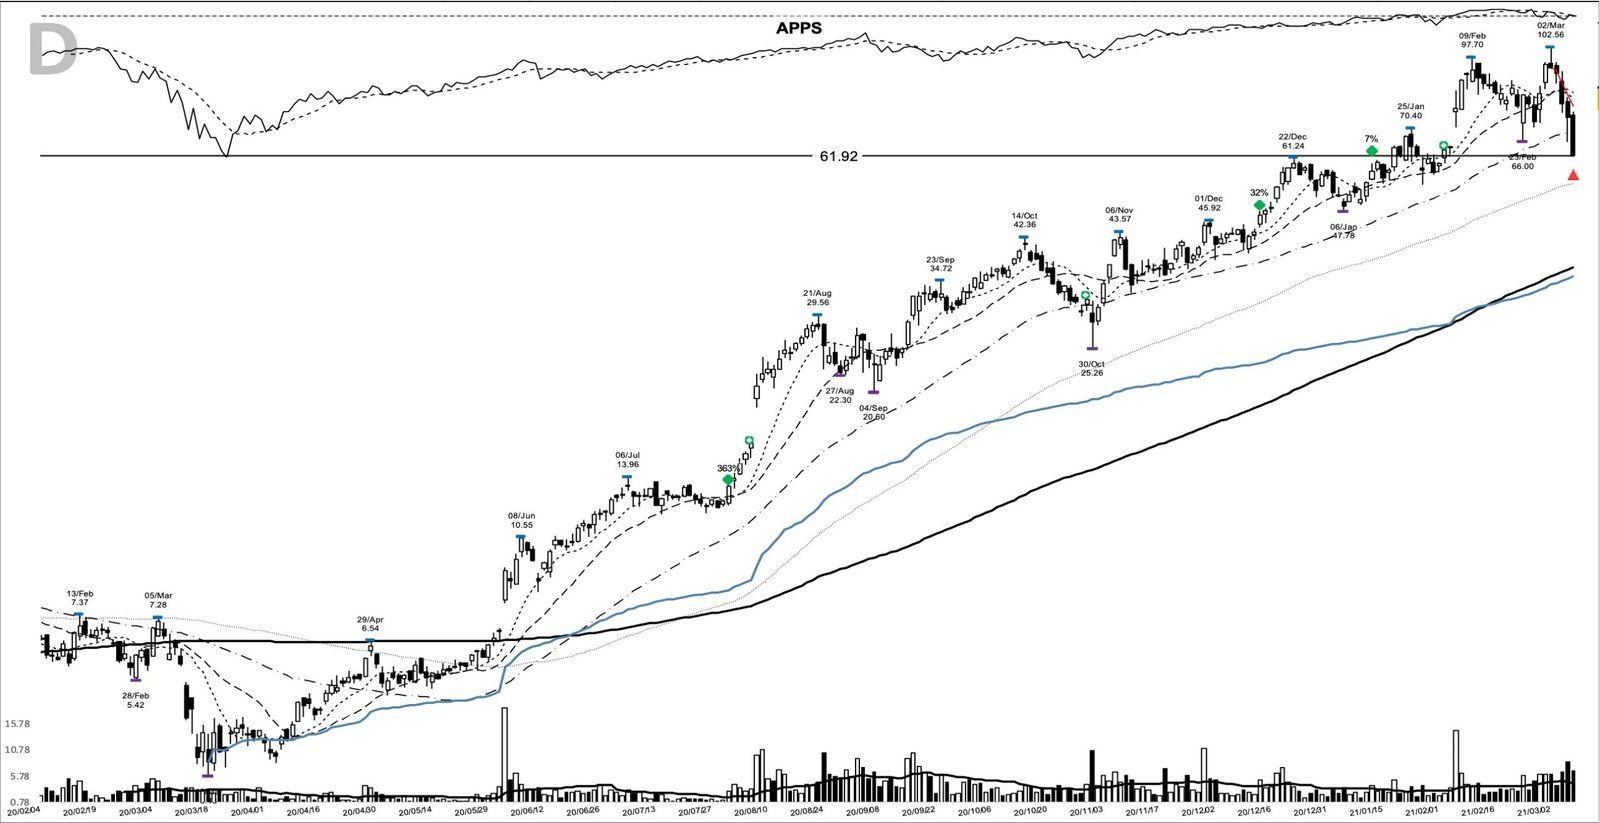
The run peaked at 102.56 on 2 March 2021, up about 668% from the entry at the high. It didn’t hold. The exit closed the move at 61.92 on 8 March, still 363.5% above the entry close, but roughly 40% below that peak. Held from the entry, 1,000 dollars committed at the 13.36 close and carried to the exit would’ve become about 4,635 dollars.
By the second week of March the market itself had rolled into a correction, with the heaviest damage concentrated in the Nasdaq and in growth names just like this one. The playbook in a correction is defense first, and an exit taken on the stock’s own break, while the averages were confirming the damage, was that playbook executed rather than abandoned.
Common misreads on the APPS breakout
The first misread is treating the entry bar as a confirmed clearance of the pivot. It wasn’t. The 13.36 close sat under the 13.96 line, and the pivot only broke in the sessions that followed. Buying the first green bar and calling it a breakout of 13.96 would’ve been early by a few days.
The second misread is copying the base shape. A drop of about 75% to 3.48 and a full round trip back to the highs is a deep V, and that’s a lower-odds base than a shallow, orderly one. This one worked because the earnings were accelerating underneath it, not because the shape was textbook.
The third is expecting a straight line. Late August 2020 handed back about 24%, from a 29.56 high on 21 August to a 22.30 low on 27 August, and that’s the kind of shakeout a stop set tight under the entry wouldn’t have survived. The give-back from the 102.56 peak to the 61.92 exit is the same lesson at the other end: trailing a trend always returns the final leg. The pattern never promised the top.
Learn the pattern on APPS and names like it
The APPS chart is a clean example of the trade that pays trend followers: a leader with accelerating numbers, a defined pivot, and a base that gave a low-risk place to lean. Get the preparation right, respect the level, and let the trail decide when the trend is over. Learn the pattern. Ride the trend. Keep the gains.
Related studies
For the structure behind this kind of setup, see the guides on Weinstein stage analysis, support and resistance, and volume confirmation on breakout candles. A new winner study lands most evenings, so there’s usually a fresh chart worth walking through.
Price and volume figures are computed from split-adjusted daily OHLCV data; company figures come from SEC filings where cited.
Educational content only. Not investment advice. Trading involves risk. You are responsible for your decisions.
Get the free Market Wisdom e-book
Join Trends and Breakouts — historical winners, breakout studies, and risk lessons. No spam, unsubscribe anytime.