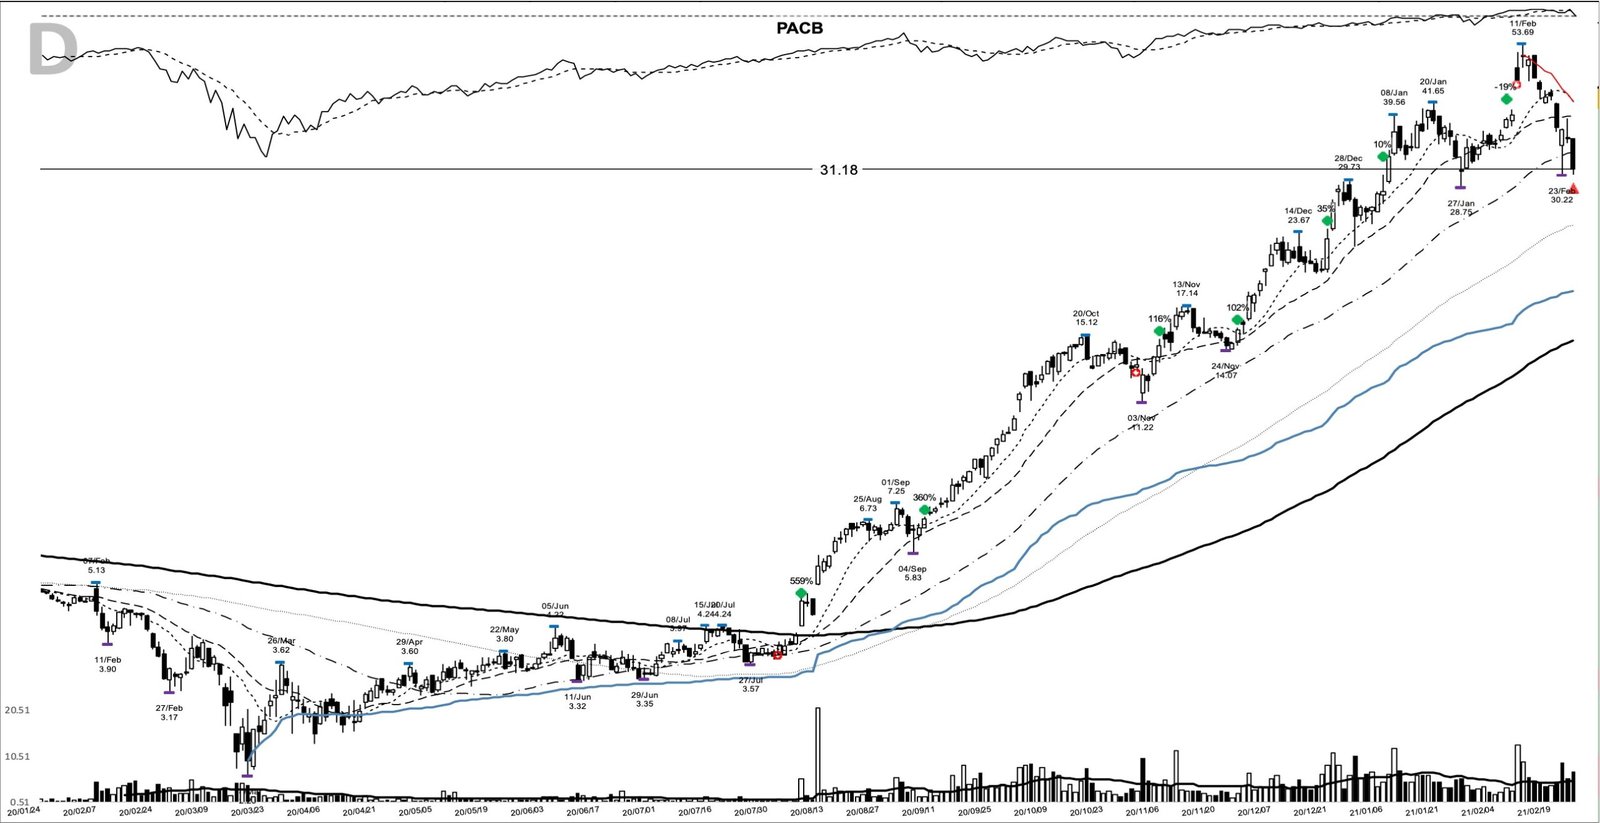
On 7 August 2020, Pacific Biosciences opened at $4.26, two cents above its July high, and closed at $4.73, up 15.9% on volume 5.9 times its 20-day average. Seven months earlier Illumina had walked away from buying the company, and the March crash had taken the stock down to $2.20. That PACB base breakout started a trend that closed 559.1% higher at the February 2021 exit, 202 calendar days later.
When PACB shows up on traders’ screens again, this is the chart worth studying. It shows a deep, ugly base that tightened properly on the right side, and a trend that kept offering fresh entry points until a single close below the 50-day line ended it.
PACB base breakout: key takeaways
- Pattern: a 57.1% deep base from the 7 February high of $5.13 to the 18 March low of $2.20, finished by rising lows under a $4.24 pivot.
- The move: +559.1% from the $4.73 close on the entry day to the $31.18 exit close, across 202 calendar days, with a $53.69 peak on 11 February 2021.
- Six add-on points, from $6.78 on 9 September 2020 to $38.65 on 8 February 2021.
- The business was shrinking into the entry: March-quarter revenue fell 5.0% year over year.
- The trend lesson: PACB never closed below its 50-day line between the entry and the exit day itself.
| Ticker | PACB |
| Breakout date | 2020-08-07 |
| Breakout close | $4.73 |
| Volume vs 20-day average | 5.9x |
| Exit date | 2021-02-25 |
| Exit close | $31.18 |
| Price change, entry close to exit close | +559.1% |
| Calendar days | 202 |
| Peak before exit | $53.69 (2021-02-11) |

Six months from $5.13 to the $4.24 pivot
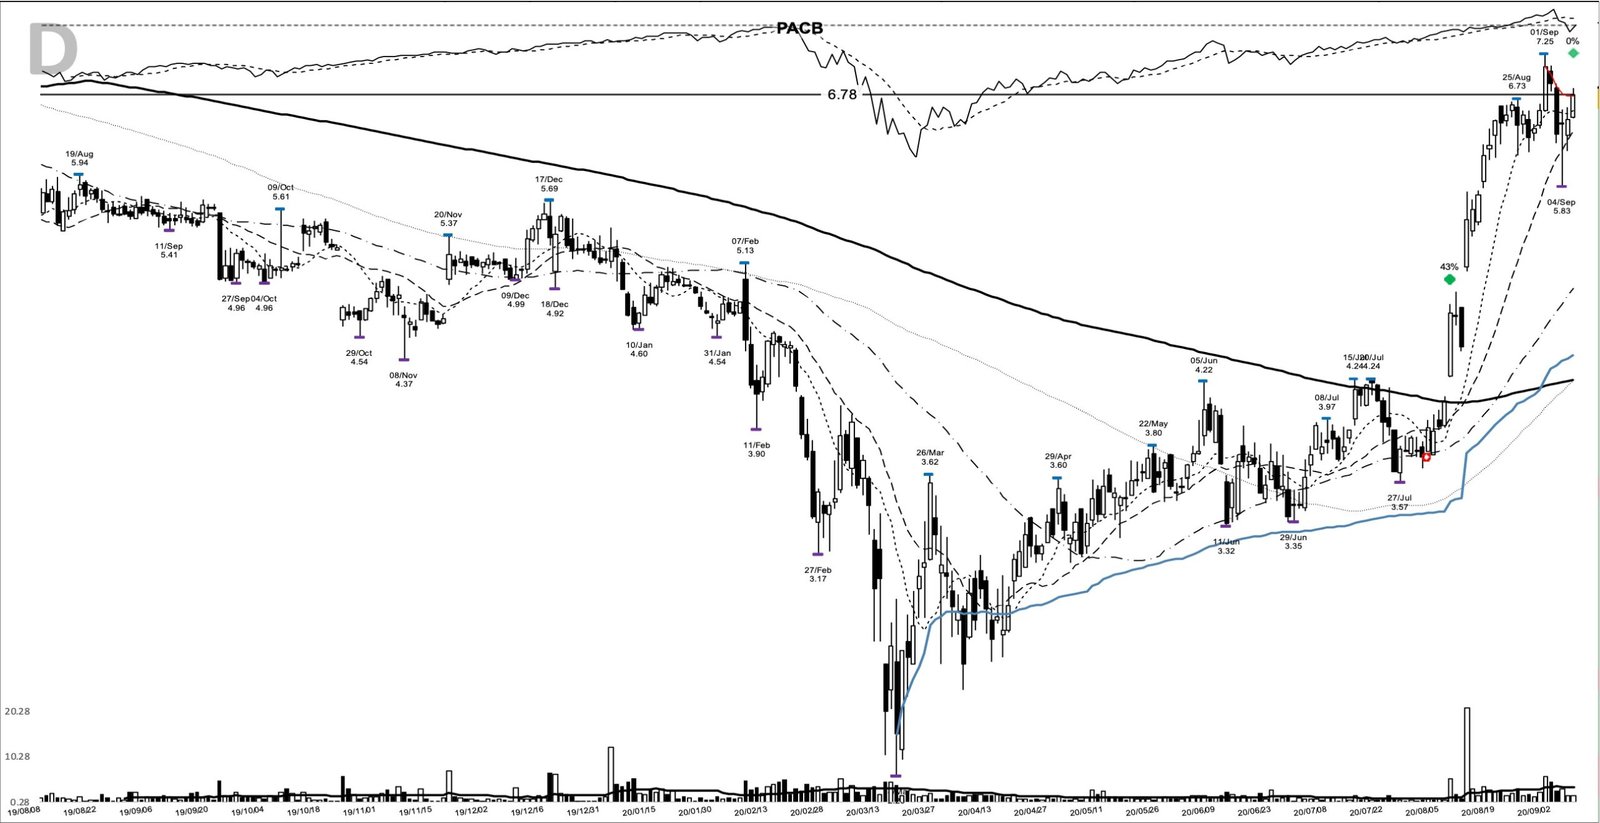
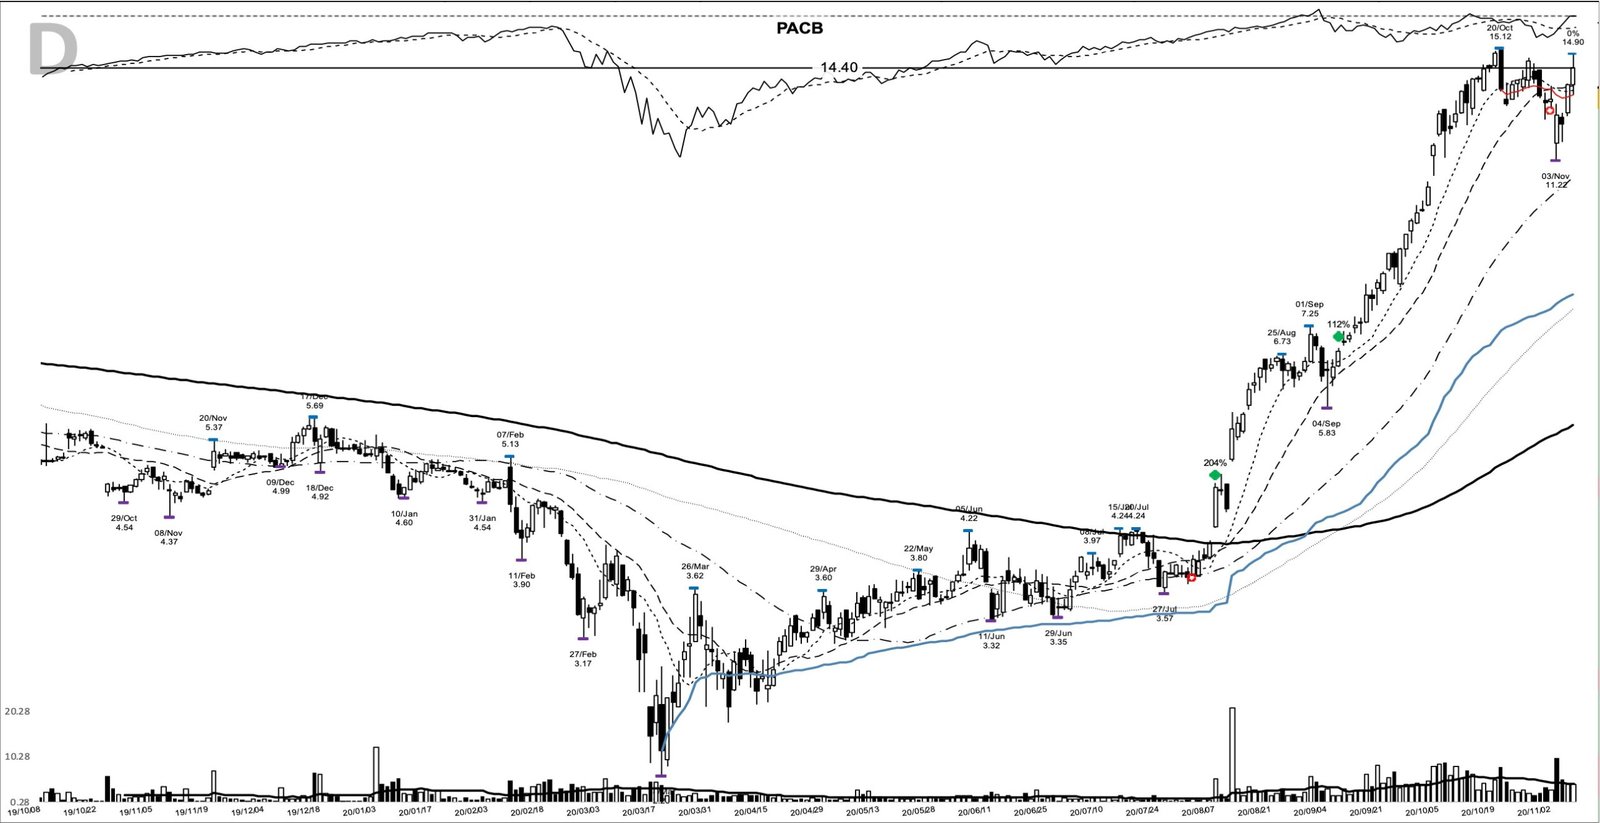
The chart, from my study archive, starts with a stock in decline. PACB printed $5.94 on 19 August 2019 and drifted lower through the autumn. A gap on 7 February 2020 reached $5.13 intraday and closed at $4.53, and from there the crash took over. On 18 March the stock traded at $2.20, 57.1% below the February high. By most measures that’s a wide and loose base, the kind a model-book reader would normally pass over.
What changed it was the right side. Between May and July the highs came in at $3.80 on 22 May, $4.22 on 5 June and $4.24 on 15 and 20 July. The lows rose underneath them: $3.32 on 11 June, $3.35 on 29 June, $3.57 on 27 July. Volume dried up through late July, with five straight sessions under 820,000 shares from 27 to 31 July. The range was narrowing toward a line, and the line was $4.24.
PACB opened at $4.26, above the pivot from the first trade, and the low of $4.25 never gave it back. It closed at $4.73 on 5,458,831 shares, against a 20-day average of 928,090. That’s a confirmed breakout: the close cleared the $4.24 pivot by 11.6%, on the largest volume the chart had shown since the March lows. The stock was still 20.4% under its 52-week high of $5.94, so this was a stock leaving a base, not one at new highs.
PacBio in 2020: a broken takeover and a shrinking top line
Pacific Biosciences makes long-read DNA sequencers. In November 2018 Illumina had agreed to buy it for about $1.2 billion in cash. After a UK competition probe and an FTC complaint, the two companies ended the deal on 2 January 2020, with Illumina owing PacBio a $98 million termination fee.
The model-book fundamental frame doesn’t fit this one. SEC data show March-quarter 2020 revenue of $15,598,000, down 5.0% from a year earlier. Earnings per share for that quarter, the one in which the merger ended, were 0.01, against a loss of 0.20 a year before. The June quarter, reported on 3 August, swung back to a loss of 0.15 per share, and the company’s release said revenue fell again as the pandemic cut instrument use at customer sites. There was no earnings acceleration to point to.
The argument for the stock was the technology and the balance sheet. On 11 August PacBio priced a stock offering of 19,430,000 shares at $4.47, raising about $86.9 million for product launches and commercial build-out. By 5 October, when it launched the Sequel IIe system under new chief executive Christian Henry, the company was pitching its HiFi long reads as the accurate end of the sequencing market.
A tape that paid for growth in August 2020
The market was in a confirmed uptrend in early August. Leadership was narrow and economically coherent: companies enabling work, shopping and communication from home were running, while airlines and other reopening names lagged. Distribution on the Nasdaq was light, even as the S&P 500 showed more selling.
By February 2021 the character had turned. Growth stocks went through a violent selloff and rebound, many leaders gapped down hard before recovering, and the charts that remained were wide and loose.
Writing the PACB plan before 7 August
The watchlist case was visible by late July. Price had closed above its 10-day moving average for five straight sessions into the pivot, and the 10-day, 20-day and 50-day lines sat within 18 cents of each other, at $3.94, $3.97 and $3.79 on the entry day. Three months of rising lows under a flat ceiling is the shape a screen for tightening ranges near a recent high picks up.
The plan a trend follower could have written that week needs only the chart’s own levels. Entry on a move above the $4.24 pivot. Initial stop below the $3.66 shelf low from 31 July, a 13.7% risk measured from the pivot. The $2.20 March low is where the whole structure fails, too far away to serve as a stop. Once in, trail the 10-day line, then widen to the 20-day after the stock is well advanced.
The gap open made that plan harder to follow than it looks. A trader whose order sat at the pivot filled near $4.26. One who waited for the close paid $4.73, 20.1% above the 10-day line, and carried a 22.6% distance to the same stop.
From $4.73 to $53.69 and back to $31.18
The first test came fast. On 11 August, the day of the offering, PACB closed at $4.47, back below the entry close. The next session it closed up 23.5% at $5.52 on 20,856,666 shares, the heaviest volume of the entire run. A first close below the 10-day line on 27 August led to a pullback low of $5.83 on 4 September, and on 9 September the stock closed at $6.78, back above both short averages. There was an opportunity to add there.
The October leg went near vertical, from $10.50 on 1 October to $14.95 on 19 October. The first close below the 20-day line came on 29 October at $13.36, and on 3 November the stock traded down to $11.22 on 9,991,843 shares before closing at $12.71, well above the 50-day line at $10.35. The 6 November close of $14.40 offered the next add, and 27 November at $15.43, after a dip to $14.07, offered another.
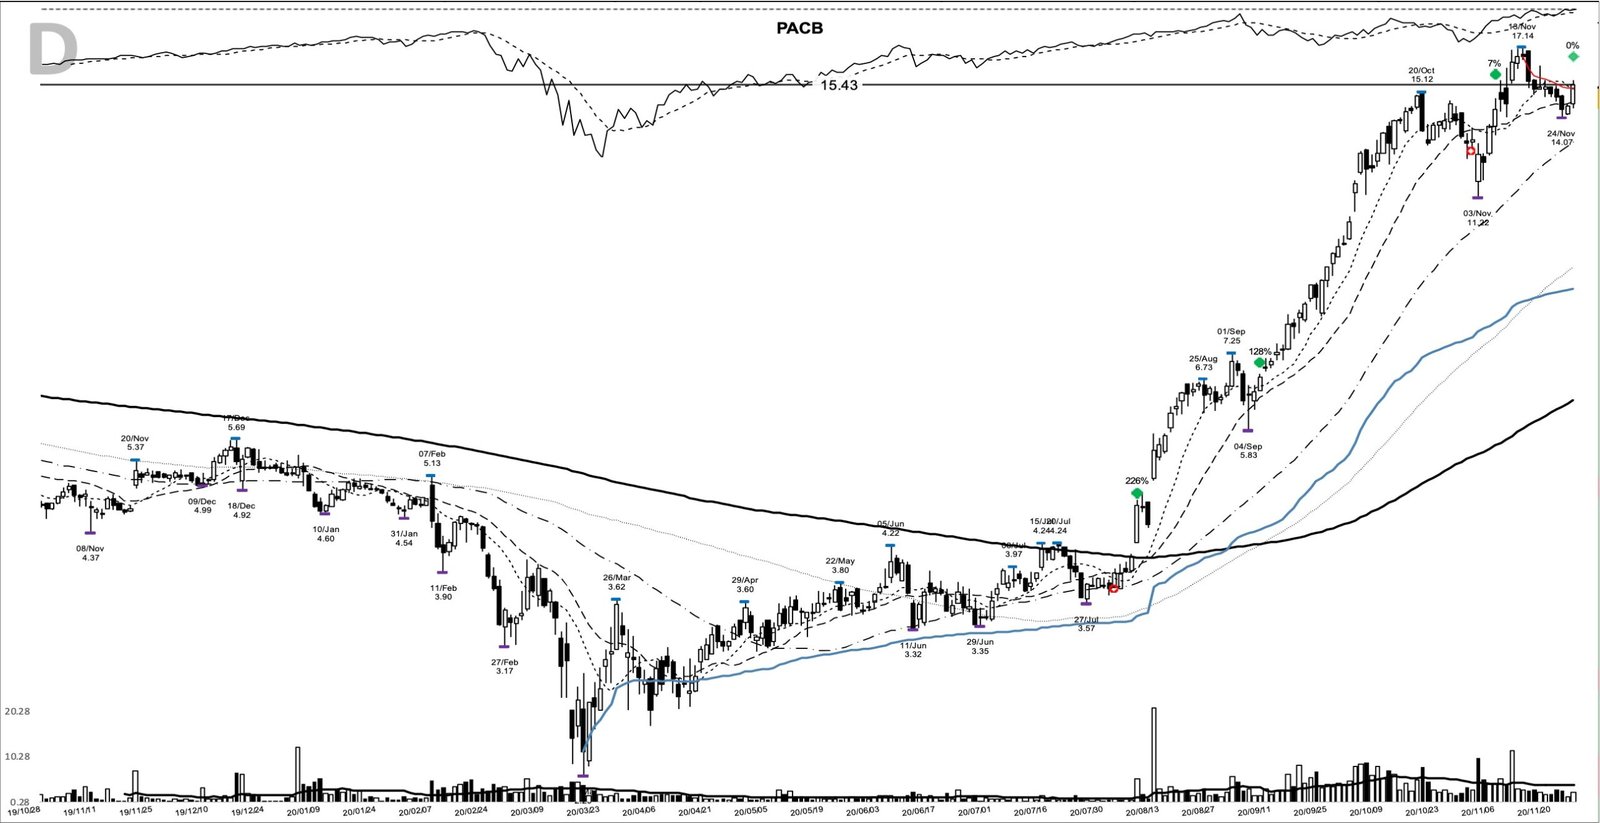
December repeated the pattern on a larger scale. After a week of drift from the 8 December close of $22.52, PACB rose 14.6% on 21 December to $23.04, on volume 2.1 times its 20-day average, and reached $28.50 two sessions later. A shakeout on 29 December to $22.20 closed at $25.38. The 6 January close of $28.30 came a week before PacBio announced a clinical sequencing partnership with Invitae, and the stock closed at $40.20 on 19 January.
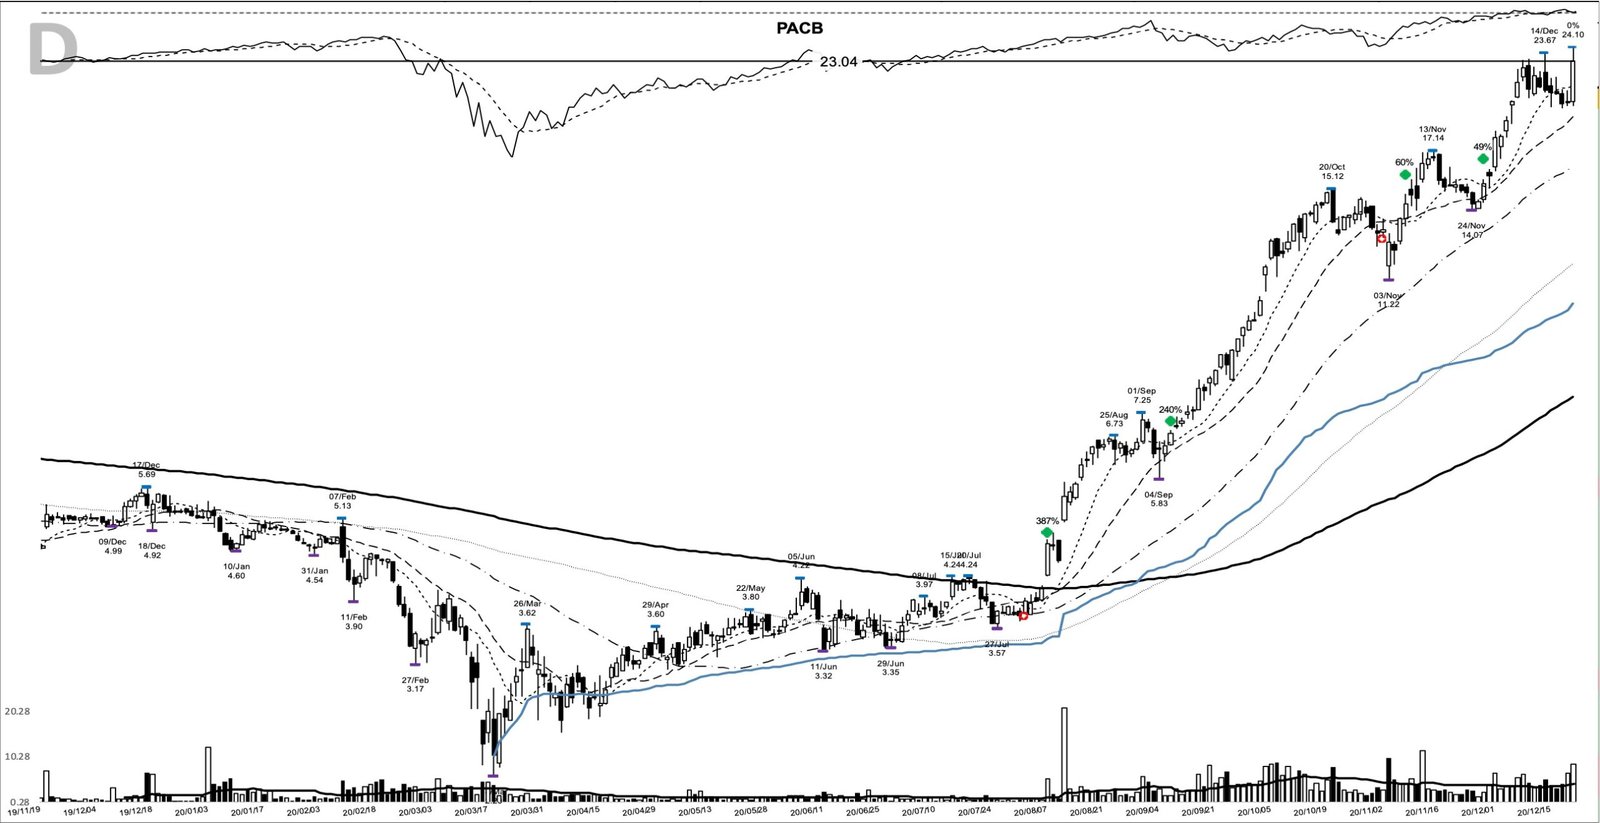
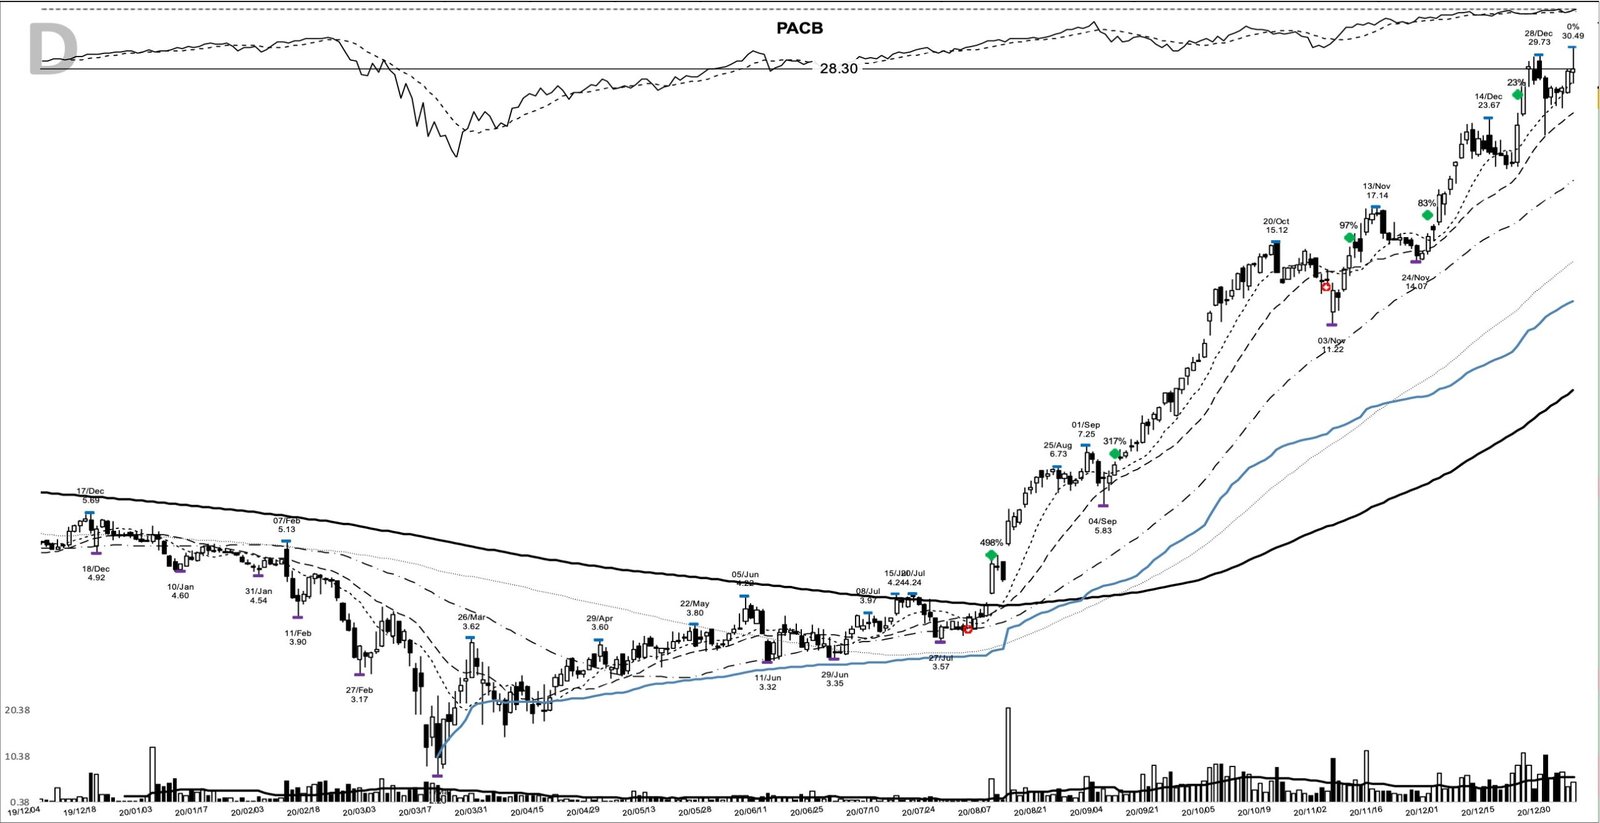
The climax came in February. After the 8 February add at $38.65, PacBio announced on 10 February a $900 million convertible investment from SoftBank, convertible at $43.50, a 10% premium to the 9 February close of $39.54. The stock opened at $48.50 that day and reached $53.69 on 11 February, 1,035.1% above the entry. Two weeks later it was gone: a low of $30.22 on 23 February, then a close of $31.18 on 25 February, below the 50-day line at $33.59 for the first time since the entry. That close ended the trend, and 1,000 dollars riding the full move would have become 6,591 dollars.

Where the PACB chart could mislead
The entry day looks cleaner than it traded. The close sat 11.6% above the pivot, so anyone who chased it was already extended, and two sessions later the stock was back at $4.47. Heavy volume on a breakout raises the odds. It doesn’t stop a 5.5% giveback in two days.
A 10-day trail exits on 27 August at $6.32, and a 20-day trail on 29 October at $13.36. Both lock in a gain, and both miss everything after November. Only the 50-day line held the whole way, and it gave back 41.9% from the peak before it triggered.
The late adds carried the least cushion. The 8 February add finished 19.3% below its own close at the exit, while the 9 September add was still 359.9% higher. Each add six months into a trend has a fraction of the room the early ones had. For the mechanics, see pyramiding into a position.
Then there’s the business. Revenue was falling, losses were back by June, and two of the sharpest single-day jumps, on 12 August and 10 February, came alongside financing news. Reading this chart as earnings leadership would have given a trader no reason to respect the 50-day break when it came.
PACB rewarded patience through six add points
The edge in PACB came from two habits: acting at a tight pivot on the right side of a broken base, and letting a slow trailing line decide the exit through three sharp shakeouts. The method William O’Neil taught asks for stronger earnings than PacBio had, yet the price and volume behaved the way his books describe a leader. Learn the pattern. Ride the trend. Keep the gains.
Related studies: BNGO base breakout, December 2020, another genomics name from the same run, and WKHS base breakout, June 2020, a theme stock that also ran without earnings. A new winner study lands most evenings.
Price and volume figures are as-traded daily OHLCV; company figures come from SEC filings where cited.
Educational content only. Not investment advice. Trading involves risk. You are responsible for your decisions.
Get the free Market Wisdom e-book
Join Trends and Breakouts — historical winners, breakout studies, and risk lessons. No spam, unsubscribe anytime.