On 15 October 1998, a small silicon carbide chip maker closed at 4.12 and pushed above the shelf it had been building for the better part of a year. That single high-volume bar is the whole point of the WOLF base breakout of October 1998, and it’s back in view because WOLF, now Wolfspeed, is one of the most active tickers on StockTwits this week. Cree, as the company was called then, spent months grinding lower and then flat before that day. The breakout close of 4.12 became the reference for a move that ran +1,876% over 517 calendar days, roughly seventeen months, with several chances to add along the way.
The chart below comes from my study archive. Here’s how the setup formed and how a trend follower could’ve spotted it.
Key takeaways from the WOLF base breakout
- The pattern was a base breakout: a long decline that flattened into a tight shelf, then a close above the 4.06 pivot on heavy volume.
- The breakout bar on 15 October 1998 closed at 4.12 on 4.4 times the 20-day average volume.
- From that close the trend ran +1,875.8% to an exit at 81.50, held 517 calendar days, with a peak of 101.00 on 6 March 2000.
- The move came in stages, offering repeated chances to add on strength from November 1998 into early 2000.
- The lesson is trend following, not prediction: a liquid leader breaking out with a turning market can run far longer than feels reasonable.
WOLF from 4.12 to 81.50: the trade at a glance
| Field | Value |
|---|---|
| Ticker | WOLF (Wolfspeed, formerly Cree) |
| Breakout date | 15 October 1998 |
| Breakout close (entry reference) | 4.12 |
| Volume vs 20-day average | 4.4x |
| Exit date | 15 March 2000 |
| Exit close | 81.50 |
| Gain | +1,875.8% |
| Calendar days held | 517 |
| Peak before exit | 101.00 (6 March 2000) |
Every price below is measured from that 4.12 close. The words matter here: the pivot is the resistance that was cleared, the breakout close is the reference for the returns, the peak is the highest print before the exit, and the exit close is where the study ends the move.
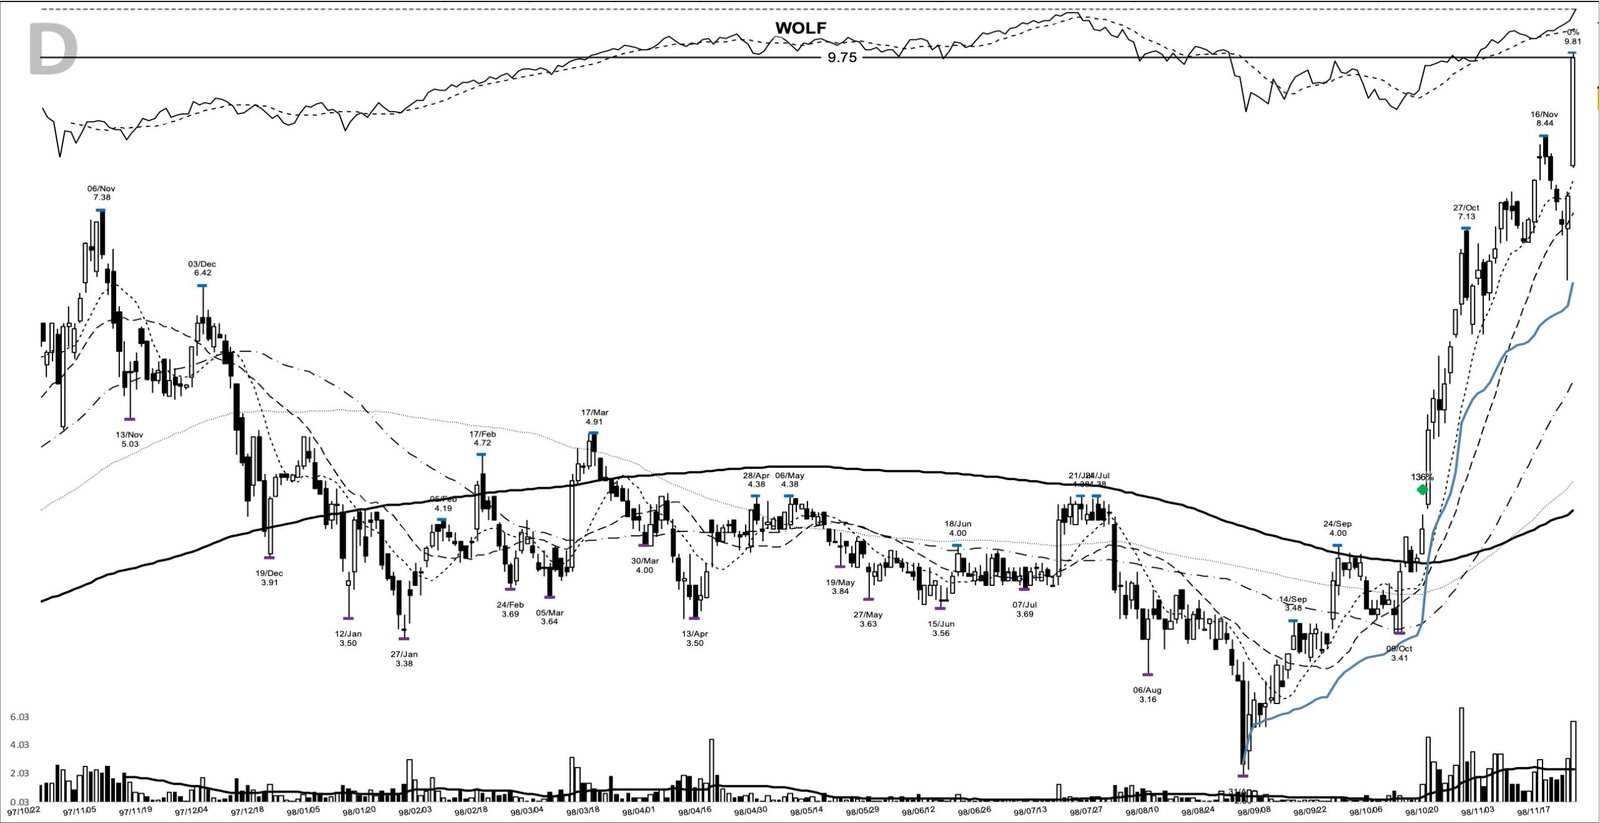
The daily chart into the 15 October 1998 breakout
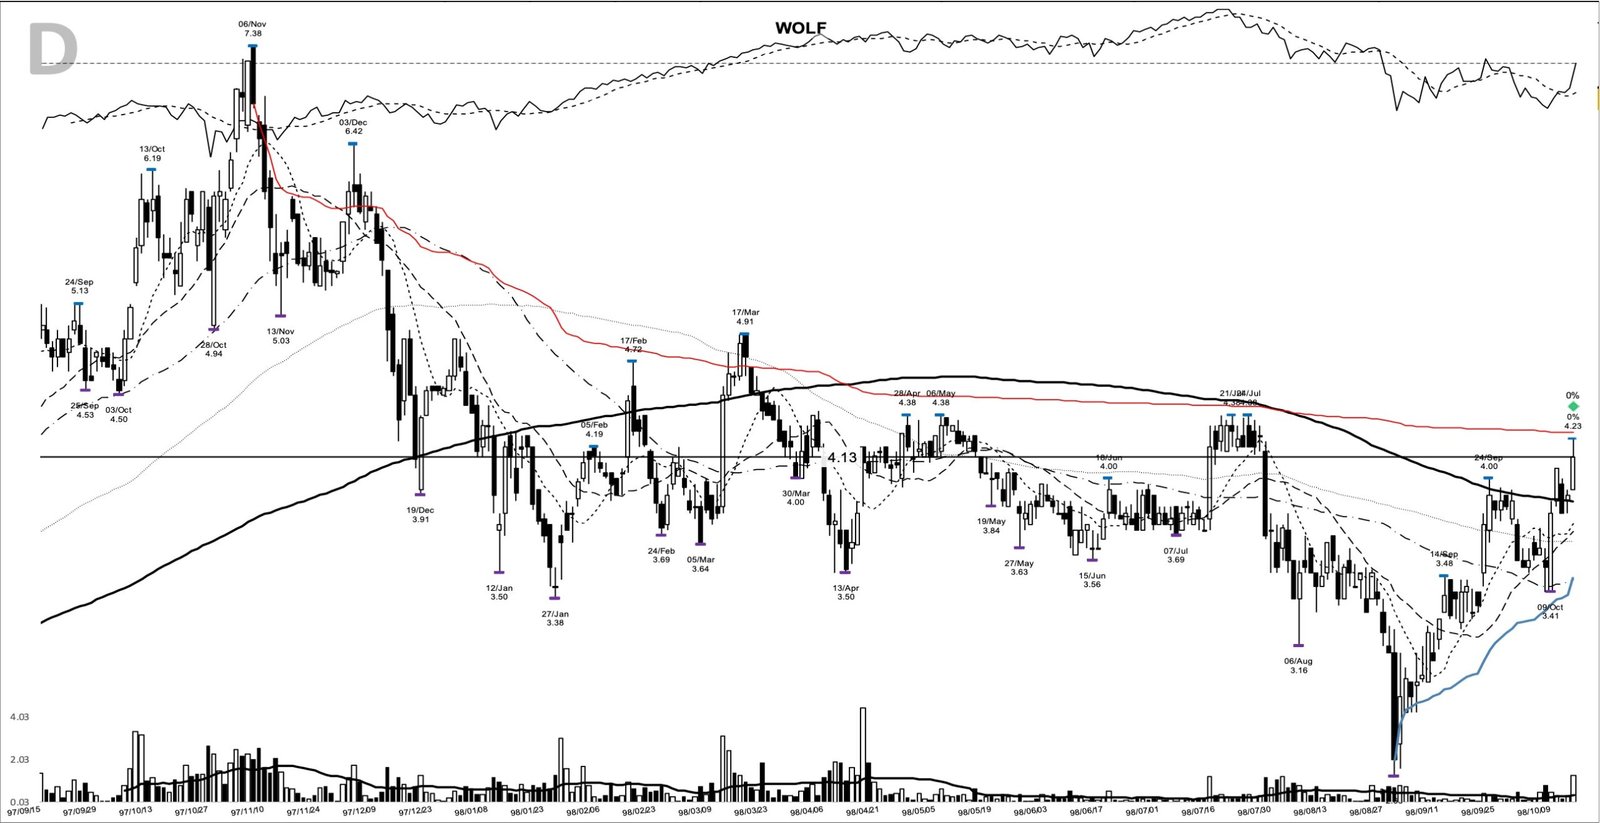
Read the chart left to right and the story’s plain. Price topped at the 7.38 high of 6 November 1997, then bled lower through 1998 to a 2.62 low on 31 August, the worst of the summer selling. From there the decline stopped going down. The last few weeks before the breakout coiled into a tight shelf around 3.40 to 4.06, with the fast 10-day line finally curling higher under price.
The relative strength line along the top is the tell most people skip. It had stopped making new lows well before price did. The note on the relative strength line covers why it often leads the candle.
How the base and the 4.06 pivot formed
Measured the model-book way, this was a six-month base roughly 40.2% deep, from a 4.38 high on 28 April 1998 down to that 2.62 August low. Deep bases shake out weak holders, which is why the eventual breakout has fuel behind it. The pivot, the level that had to give way, was the 4.06 high of 12 October 1998.
On 15 October price opened at 3.94, ran to a 4.23 high, and closed at 4.12, above the pivot and near the top of its range. Volume was 1,272,000 shares against a 20-day average near 292,000, so 4.4 times normal. That volume’s the confirmation that separates a real break from a quiet drift through resistance, which is why the way volume behaves at the pivot decides whether the pattern is worth taking seriously.
The model-book template pairs a breakout like this with accelerating earnings. There aren’t any quarterly earnings figures in the evidence bundle here, so this study reads the setup off price, volume, and structure rather than a growth table, and stays on what the chart can actually prove.
Cree, the company behind the 1998 ticker
The ticker reads WOLF today, but in 1998 this was Cree, Inc., the Durham, North Carolina firm whose silicon carbide research produced the world’s first commercial blue light-emitting diode. Cree supplied LED chips to original-equipment makers including Osram Opto Semiconductors, and it sat in the semiconductor group while anything tied to chips and the internet was being bid hard. The company kept the Cree name until October 2021, when it rebranded to Wolfspeed and moved to the NYSE under the WOLF symbol.
What matters for the pattern is that this was a genuine emerging leader, not a random low-priced stock. A base breakout carries the most weight when the name behind it has a real product story, and blue LEDs and silicon carbide were as real as it got in 1998. The base breakout playbook that made this setup famous belongs to William O’Neil, whose work on leaders emerging from bases is the backbone of the method.
The market that turned on 15 October 1998
The timing wasn’t a coincidence. The summer of 1998 was ugly: the Russian debt default in August and the near-collapse of the hedge fund Long-Term Capital Management drove a sharp global correction that bottomed in early October. Then, after the close on 15 October 1998, the Federal Reserve cut interest rates in a surprise move between scheduled meetings, and the Dow rallied about 4% the next session as the correction turned into a new advance.
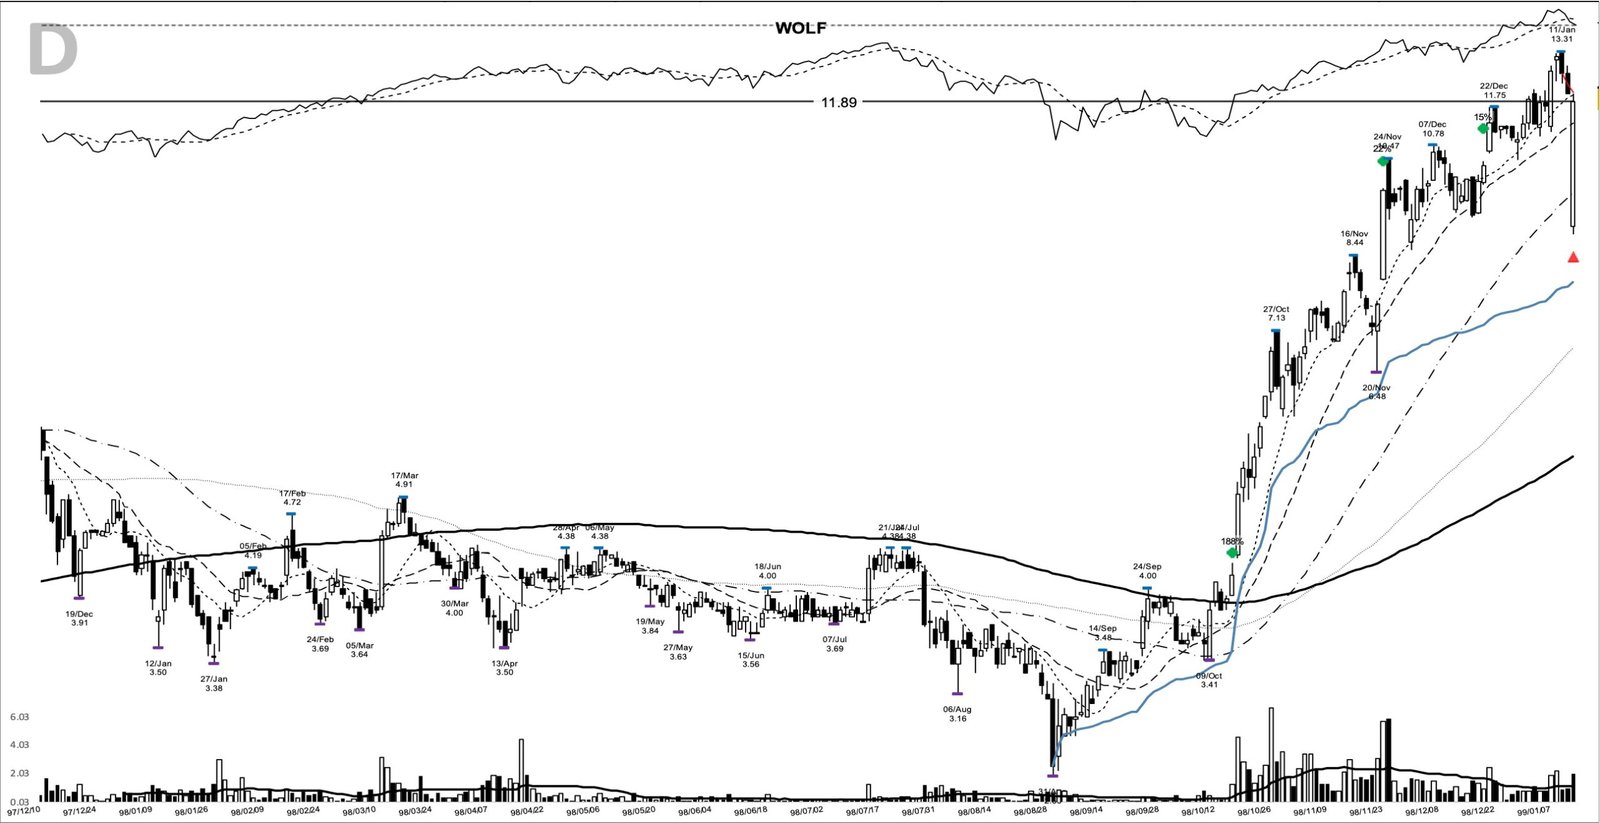
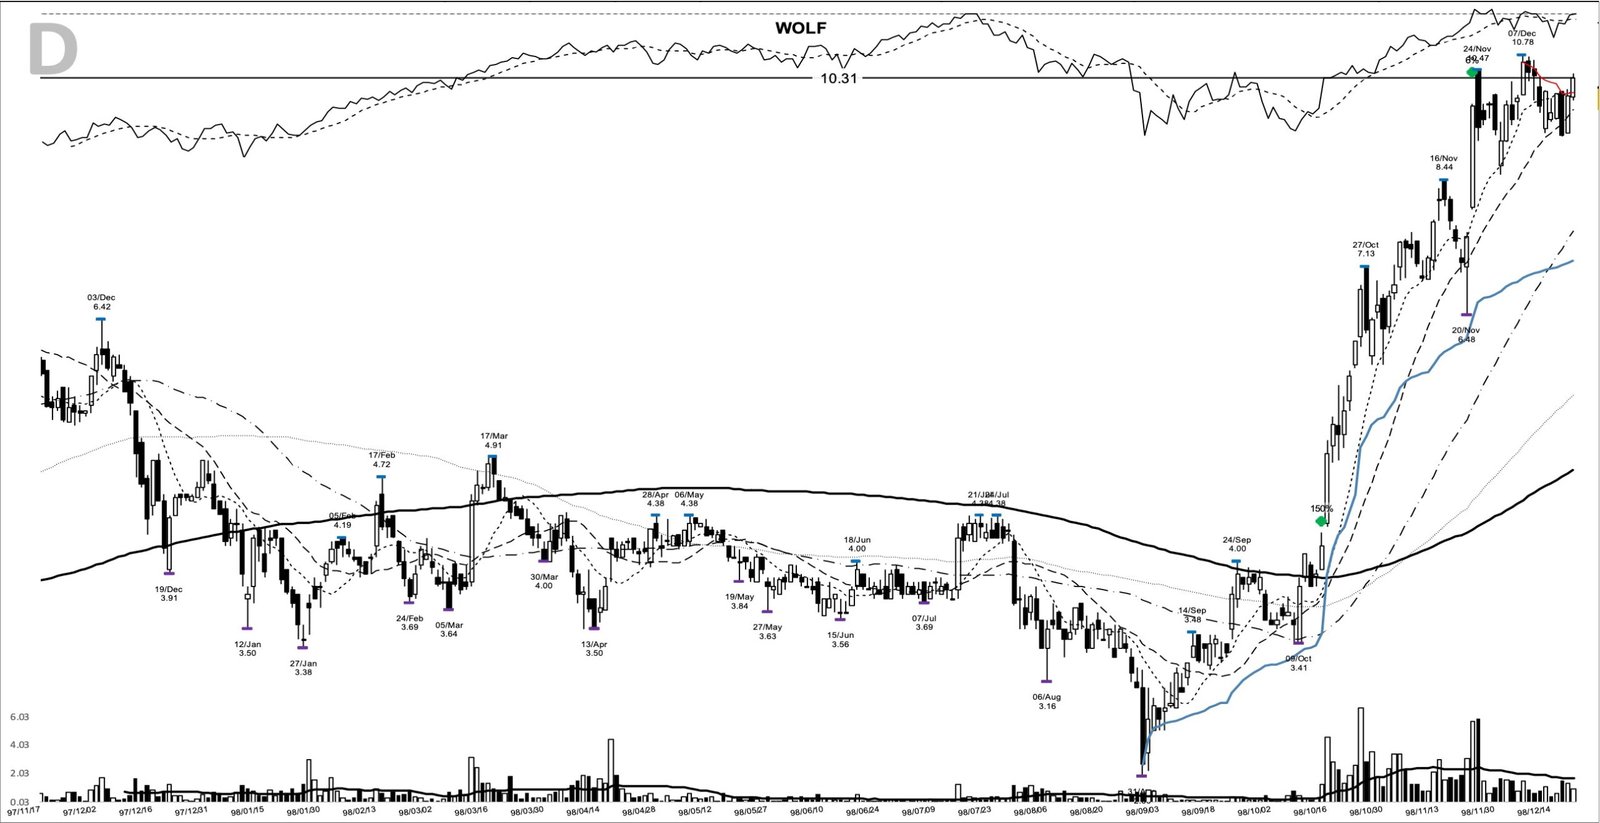
So the breakout fired on the exact day the broad tape flipped from fear to recovery. A leader clearing its base is a strong signal on its own, and far stronger when its market is turning up at the same moment. The pattern didn’t promise a straight line, though. By 13 January 1999 the first leg had carried the stock to a wide-range reversal near 11.89, then it stalled, round-tripping back near 11.56 by mid-May before the trend resumed. Four months of going nowhere is normal inside a big winner.
How a trend follower could have prepared for WOLF
None of this required a forecast. Into the pivot, price had closed above its 10-day moving average for five straight sessions and sat about 9.7% above that line, with the 10-, 20-, and 50-day averages stacked close together at 3.76, 3.71, and 3.47. That’s a stock coiling, not extended. A watchlist built on stage analysis would’ve flagged it as a base testing the top of its range.
The plan a trend follower could’ve written that morning is short. Enter on a move above the 4.06 pivot. Set the initial stop below the shelf, whose five-day low was 3.41, or below the 2.62 base low where the whole structure fails. Then trail the advance with the 10-day moving average, widening to the 20-day once the position’s well ahead. Sizing against that 3.41 shelf rather than a round number is the part that makes the risk repeatable, and the guide to position sizing walks through the arithmetic.
The 1999 uptrend: adding on strength
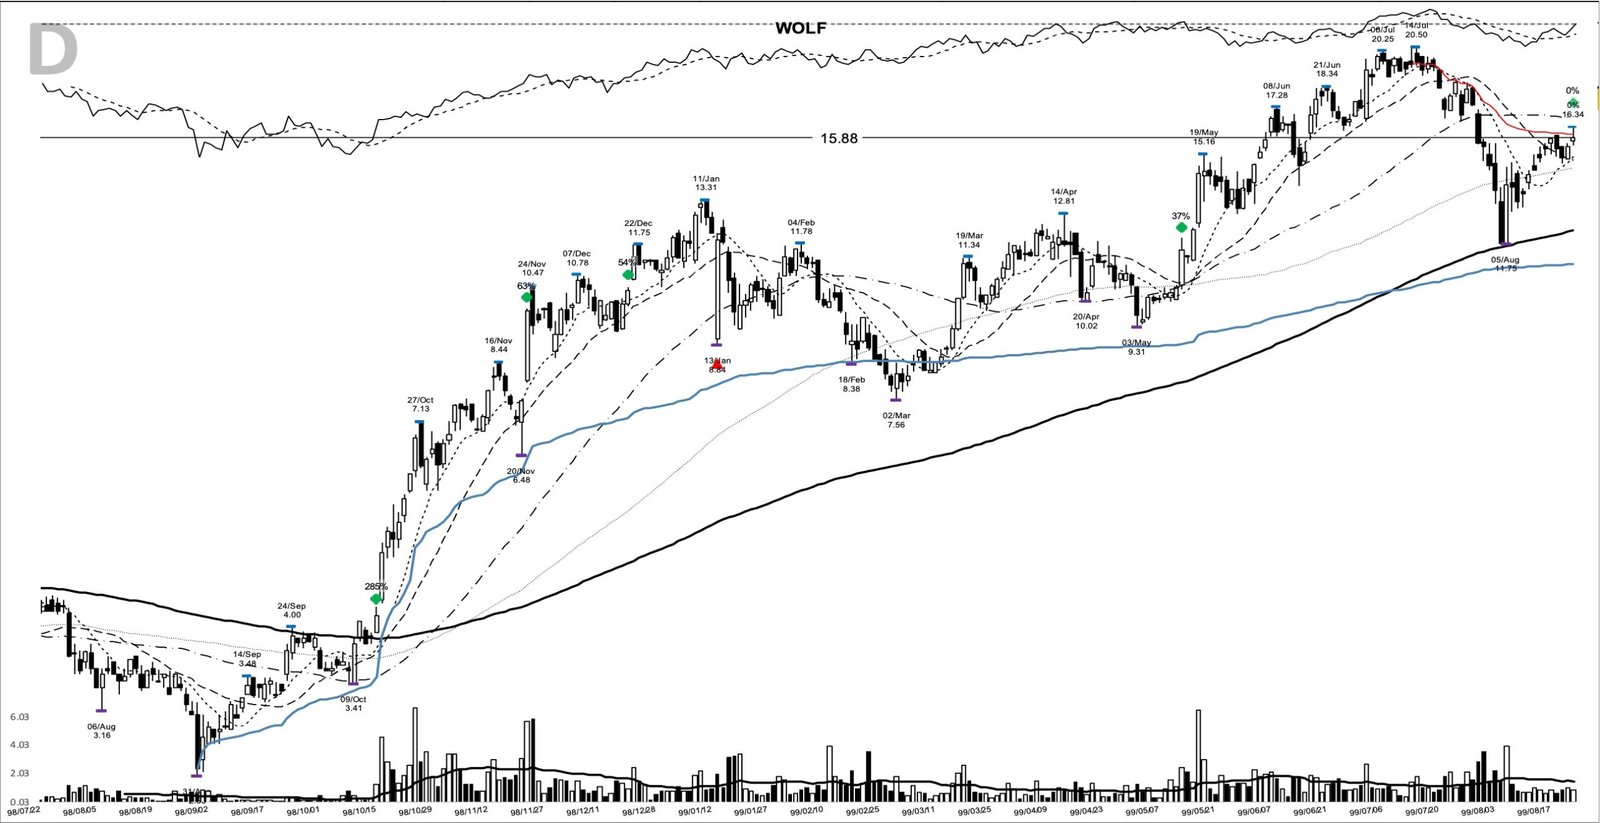
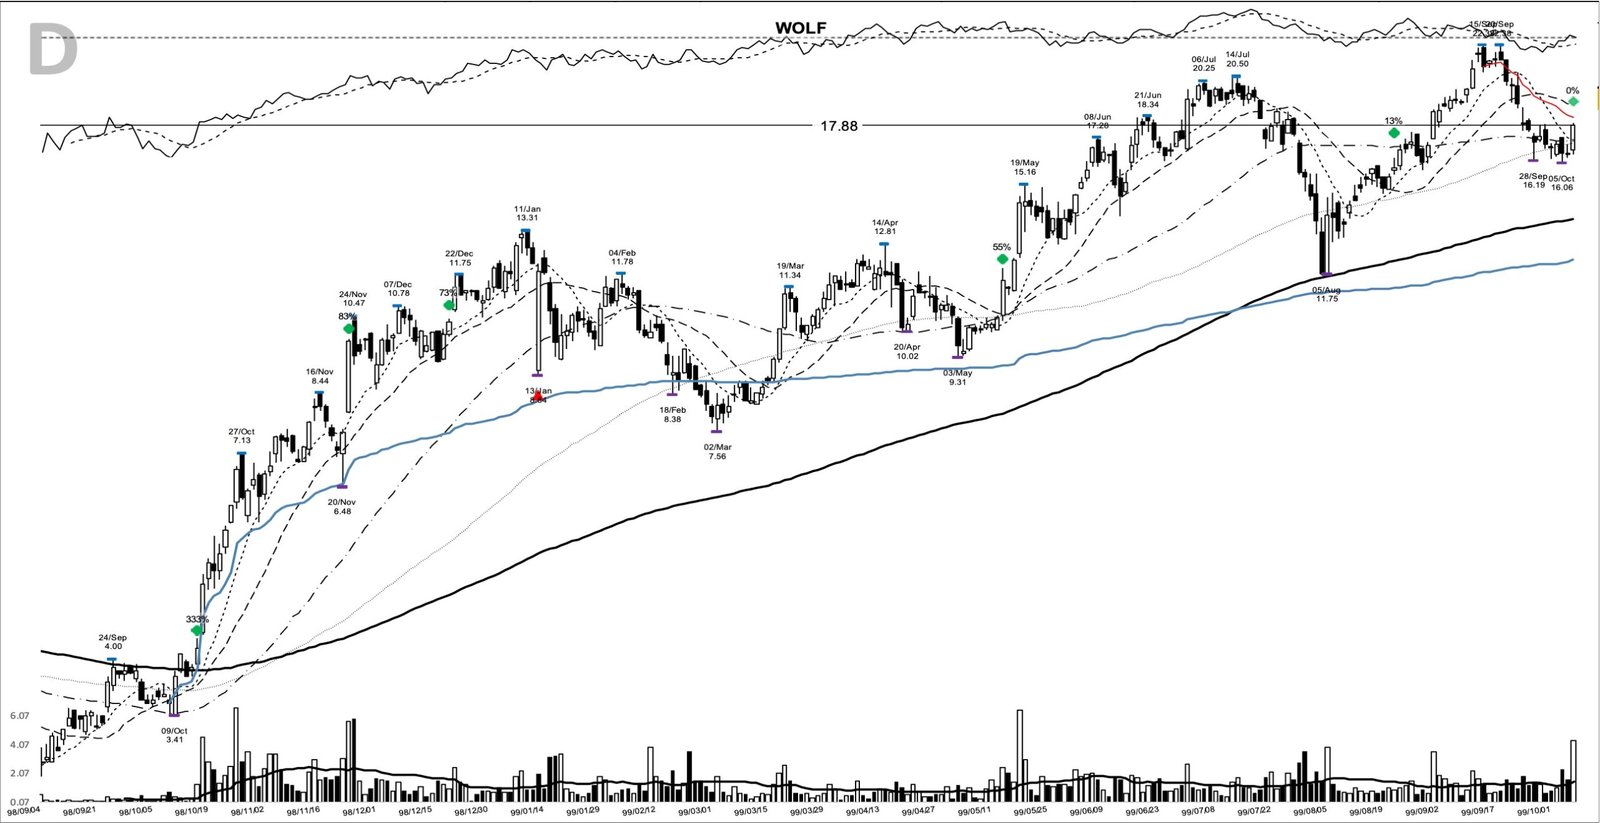
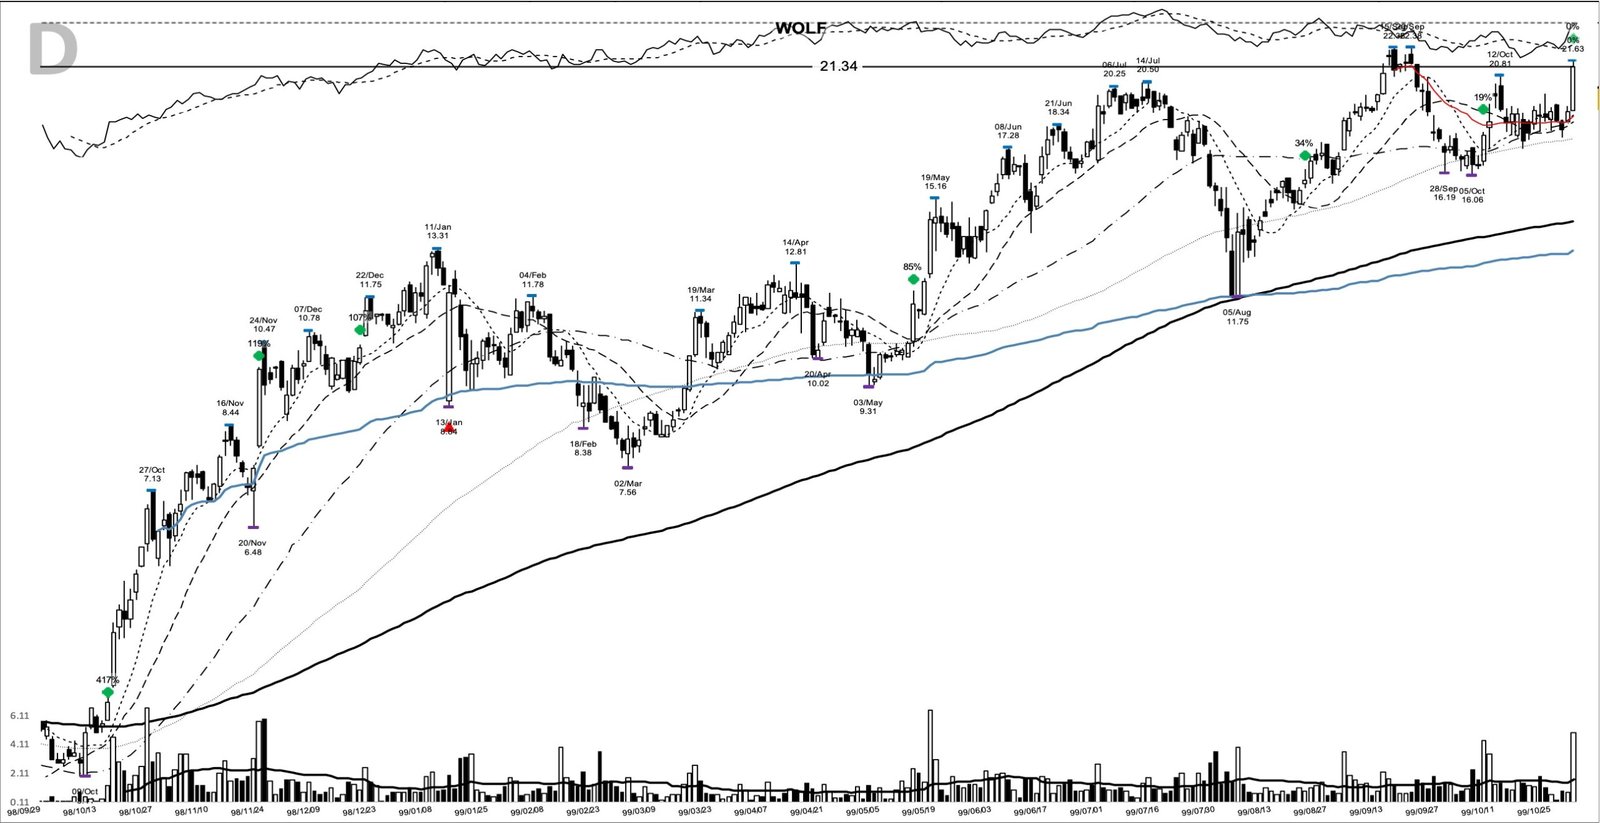
Once the trend was established, the chart handed out add points at higher and higher prices, each one a fresh base or pullback that held. There was an opportunity to add near 15.88 on 23 August 1999, then near 17.88 on 7 October, then near 21.34 on 29 October. Each add sat on top of a real move, which is the whole idea: you press a position that’s proving itself, not one you’re hoping into.
The blow-off into March 2000 and the exit at 81.50
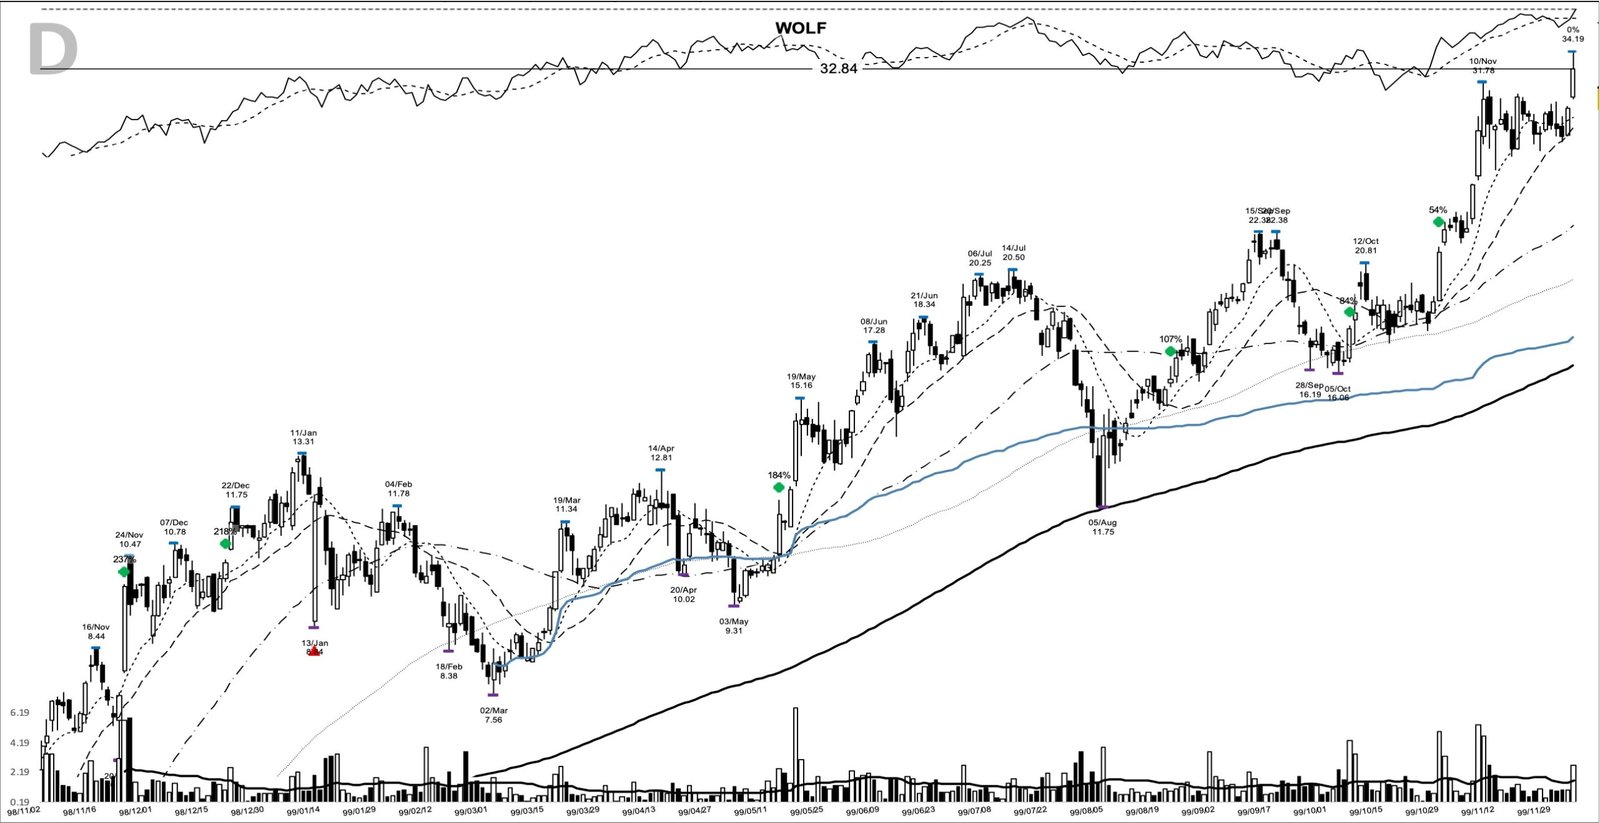
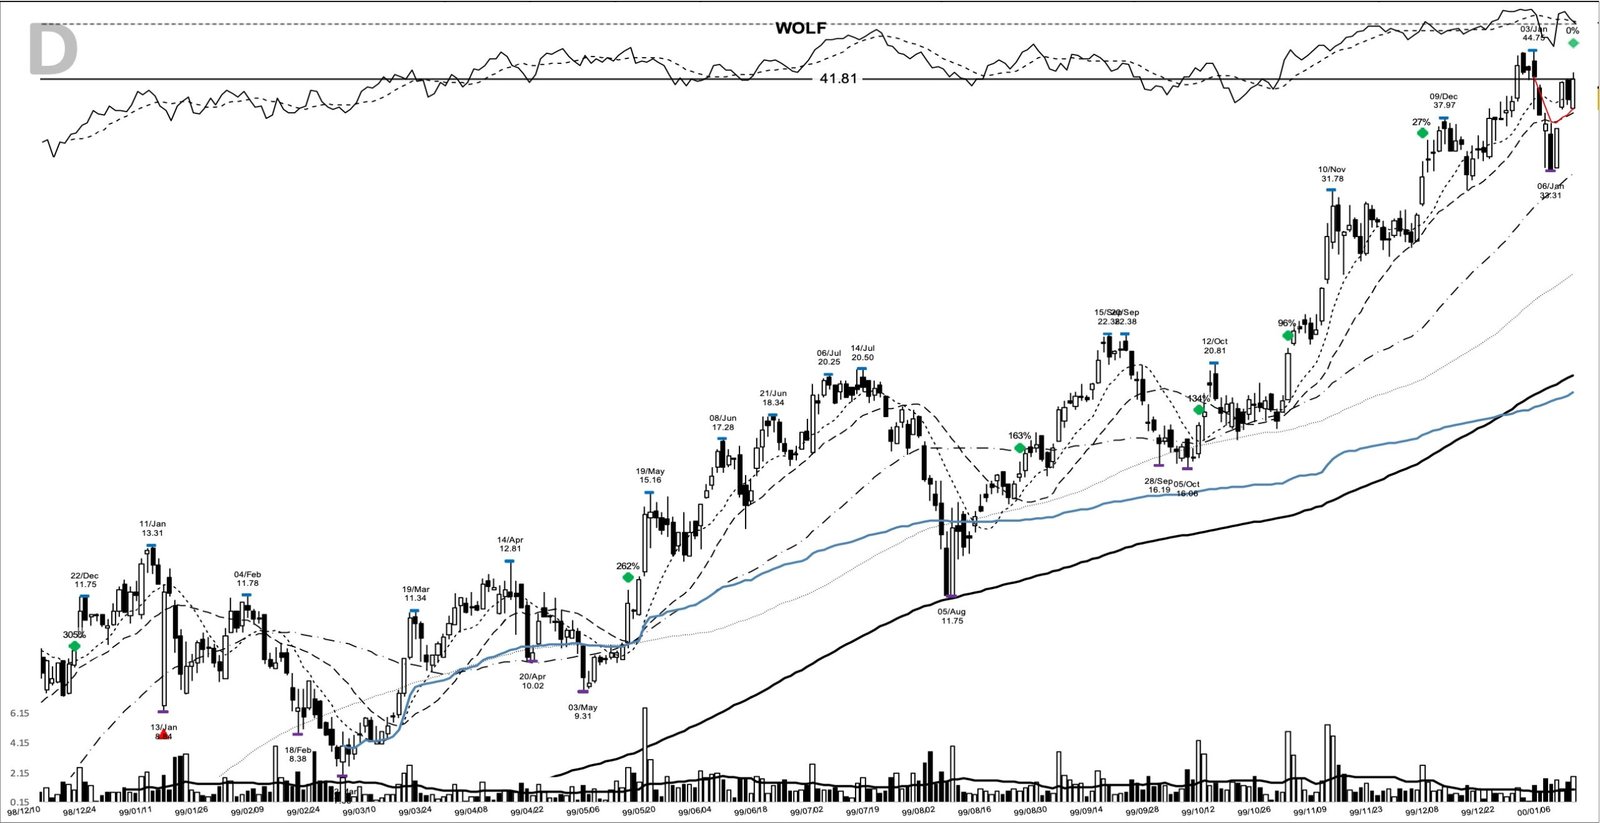
The last leg was the steepest and most dangerous. The trend accelerated through the close near 32.84 on 3 December 1999, near 41.81 on 12 January 2000, and near 60.00 on 2 February 2000, as the whole tech complex went vertical. Price peaked at 101.00 on 6 March 2000, then rolled over. The exit came on 15 March 2000 at 81.50, right as the broader technology advance was topping out.
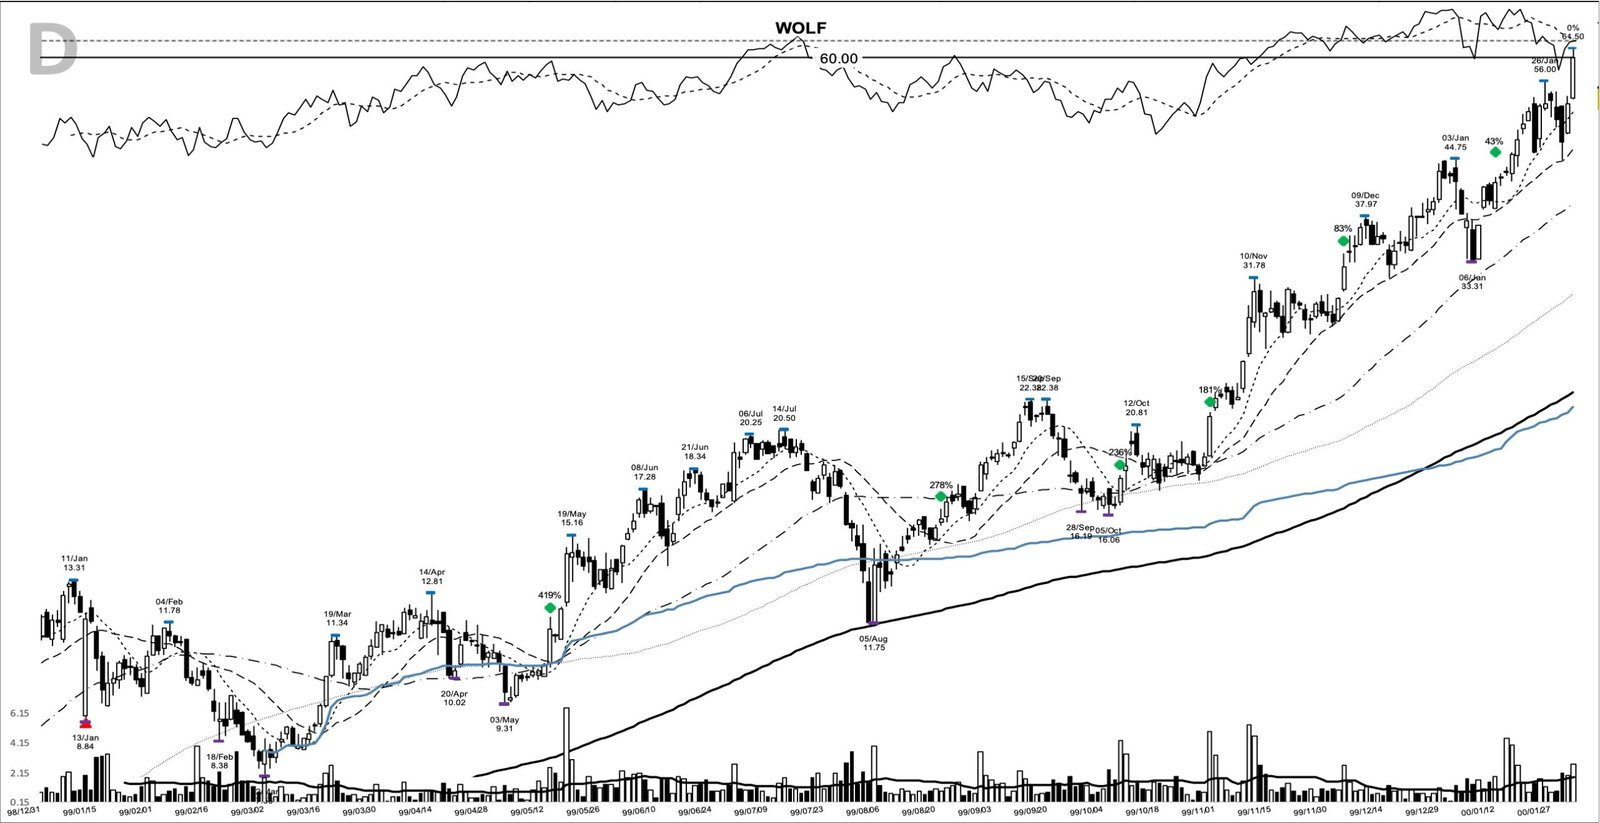
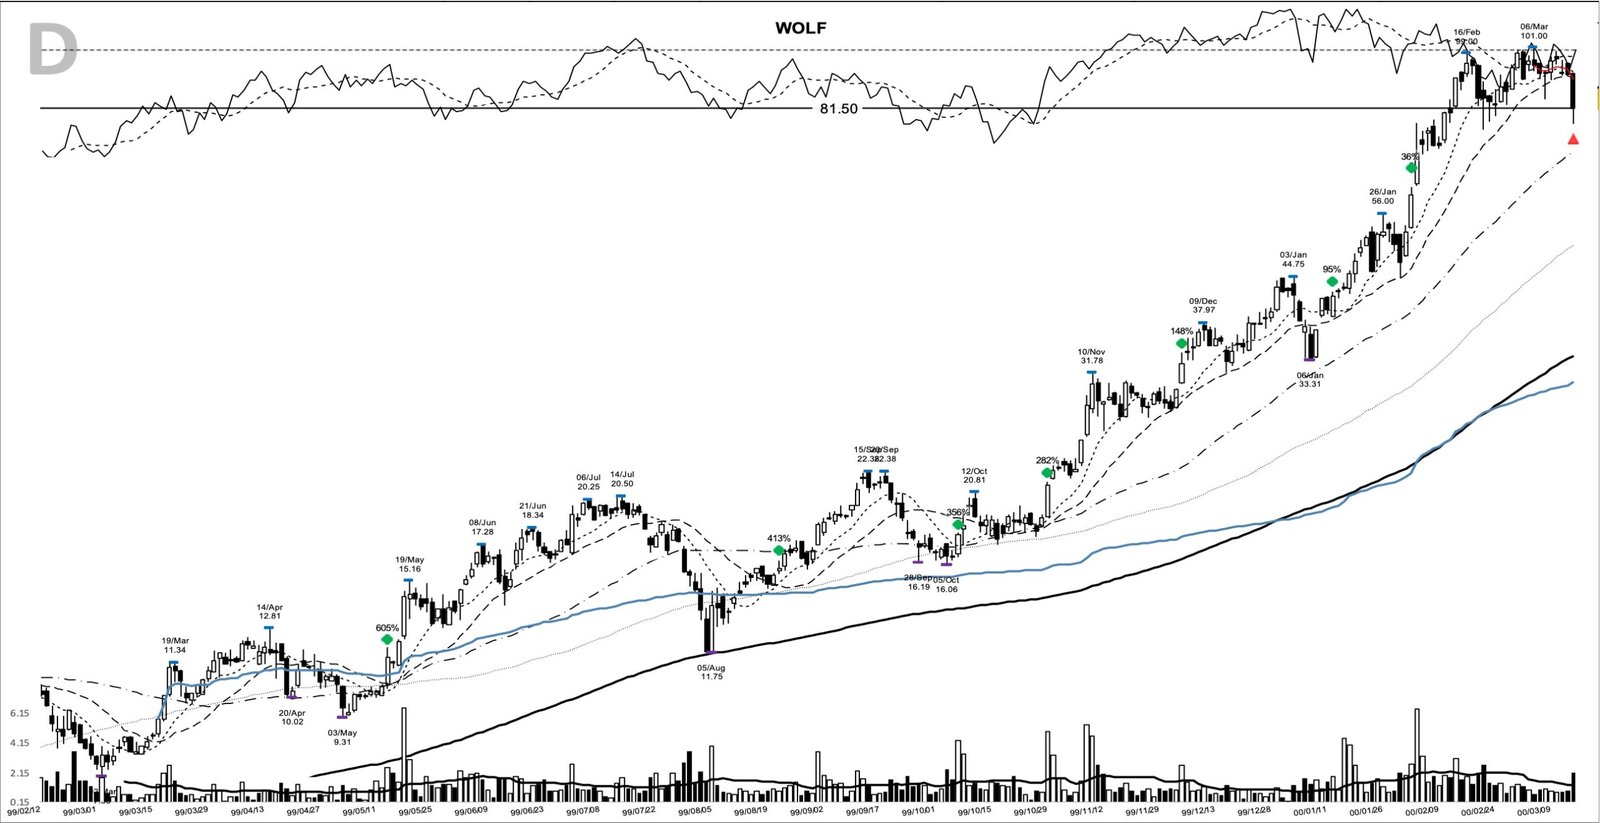
Put in money terms, a $1,000 position riding the full move from 4.12 to 81.50 would have become about $19,758. The trailing exit gave back some of the peak, the cost of never trying to sell the exact top. A move like this is a survivor, and the honest way to study it is spelled out in the note on survivorship bias: for every leader that ran like WOLF, plenty of similar-looking breakouts failed at the pivot.
Common misreads on the WOLF setup
The first trap is chasing. The session right after the breakout gapped up and closed roughly a fifth above the 4.12 breakout on even heavier volume. Buying there, extended above the pivot, meant a much wider stop and an invitation to the first shakeout. The pattern rewards buying near the pivot, not the fireworks the day after.
The second trap is expecting a clean line. This winner spent four months in early 1999 doing nothing, round-tripping from 11.89 back to 11.56, and it undercut short-term lows more than once on the way up. A base breakout is a starting signal, not a guarantee of a smooth ride, and a stop placed too tight under an early add would’ve been taken out during ordinary noise. The 4.06 pivot was the trigger, the 2.62 base low was where the idea was wrong, and everything between was the trend doing its work.
What WOLF still teaches about leaders
The setup is repeatable even if the exact result isn’t. Find a real leader building a deep base at the lows, wait for a heavy-volume close above the pivot, ideally with the broad market turning up, then follow the trend and add where the chart proves you right. The numbers here were extraordinary; the method behind them is ordinary and teachable. Learn the pattern. Ride the trend. Keep the gains.
Related studies: for the base-breakout method itself, start with William O’Neil and the mechanics of trend following, then read Jesse Livermore on adding to a winner. A new winner study lands most evenings.
Price and volume figures are computed from split-adjusted daily OHLCV data; company figures come from SEC filings where cited.
Educational content only. Not investment advice. Trading involves risk. You are responsible for your decisions.
Get the free Market Wisdom e-book
Join Trends and Breakouts — historical winners, breakout studies, and risk lessons. No spam, unsubscribe anytime.