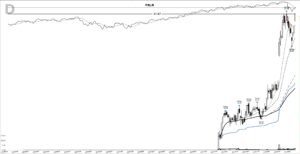
On 6 July 2020, Fulgent Genetics opened at $16.60 and closed at $18.33, up 13.1% on the day, still a dollar short of the $19.40 high it had printed three weeks earlier on news of an FDA authorization for its at-home COVID-19 test. That close is where this FLGT base breakout study begins. From a July 2020 entry out of a deep pandemic-era base, the trend closed 475.1% higher at the February 2021 exit, 231 calendar days later.
When FLGT shows up on traders’ screens again, this is the chart worth studying. It shows an early entry inside a base, a pivot set by one failed news spike, and a trend that outlasted every short moving average.
FLGT base breakout, July 2020: key takeaways
- Pattern: a 67.5% deep base from the 19 February 2020 high of $20.60 to the 16 March low of $6.70, rebuilt by June into a $19.40 pivot, with a $20.30 intraday high on 18 May above it.
- The entry came three sessions before the pivot cleared: the $19.40 level gave way on a $19.57 close on 9 July.
- The move: +475.1% from the $18.33 entry close to the $105.42 exit close, across 231 calendar days, with a $189.89 peak on 9 February 2021.
- Three add-on points, on 27 July 2020, 29 December 2020 and 26 January 2021.
- The trend lesson: from entry to exit, FLGT never closed below its 200-day moving average, even through two sharp sector selloffs.
| Ticker | FLGT |
| Study entry date (anticipatory) | 2020-07-06 |
| Entry close | $18.33 |
| Pivot | $19.40 |
| Pivot cleared | 2020-07-09, close $19.57 |
| Volume vs 20-day average | 1.3x |
| Exit date | 2021-02-22 |
| Exit close | $105.42 |
| Price change, entry close to exit close | +475.1% |
| Calendar days | 231 |
| Peak before exit | $189.89 (2021-02-09) |
A $19.40 spike, a $15.30 shelf and an early entry
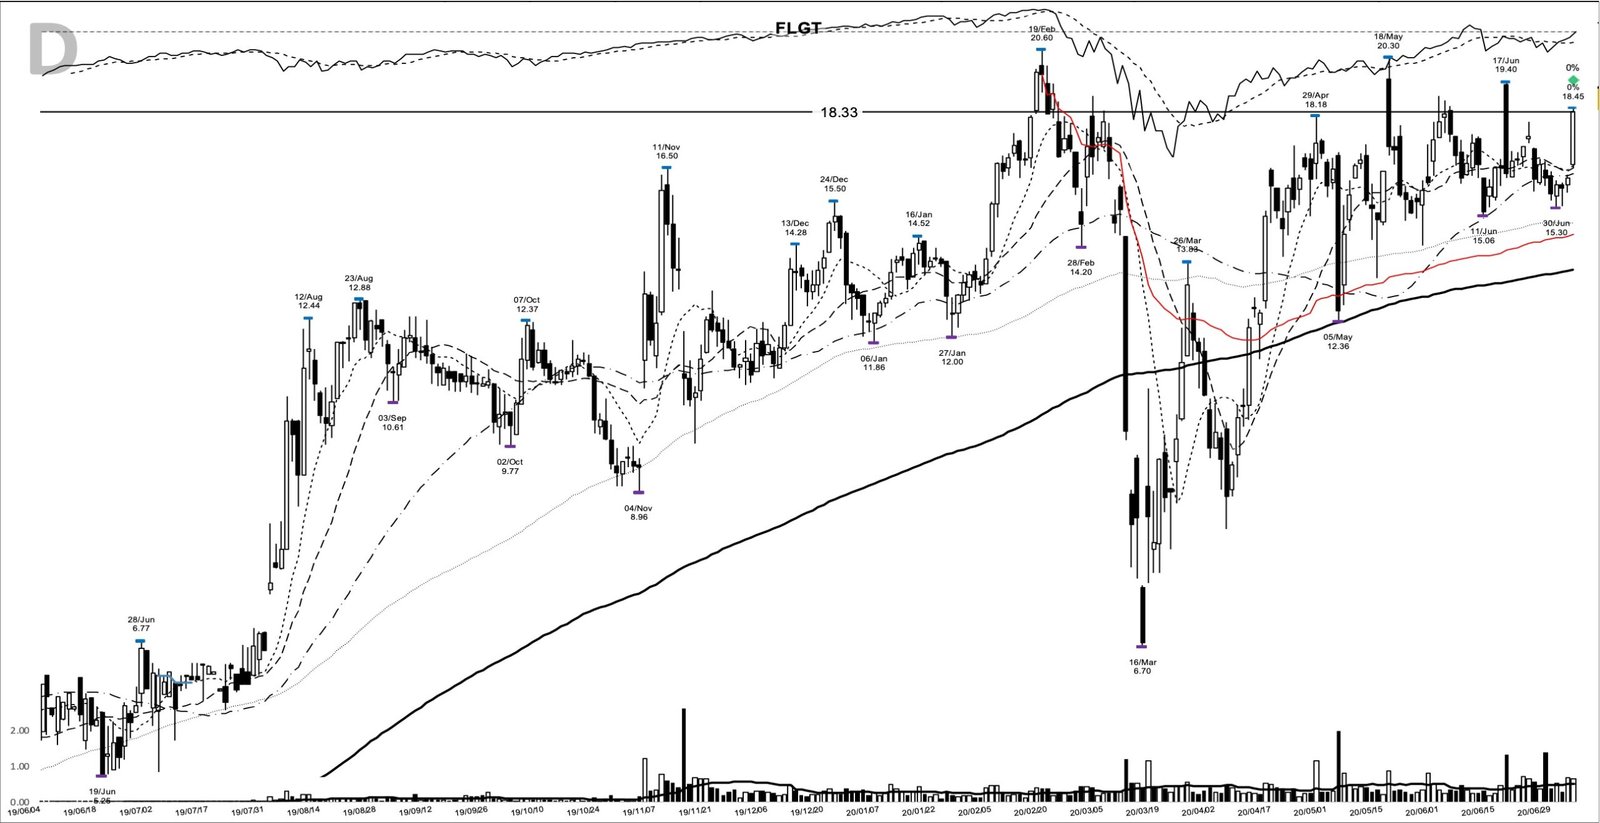
The chart, from my study archive, shows a stock that had already tripled once. FLGT climbed from a $5.30 low on 3 July 2019 to $20.60 on 19 February 2020. The crash then took it to $6.70 on 16 March, a 67.5% drop that most base-quality checklists would reject as a wide and loose base.
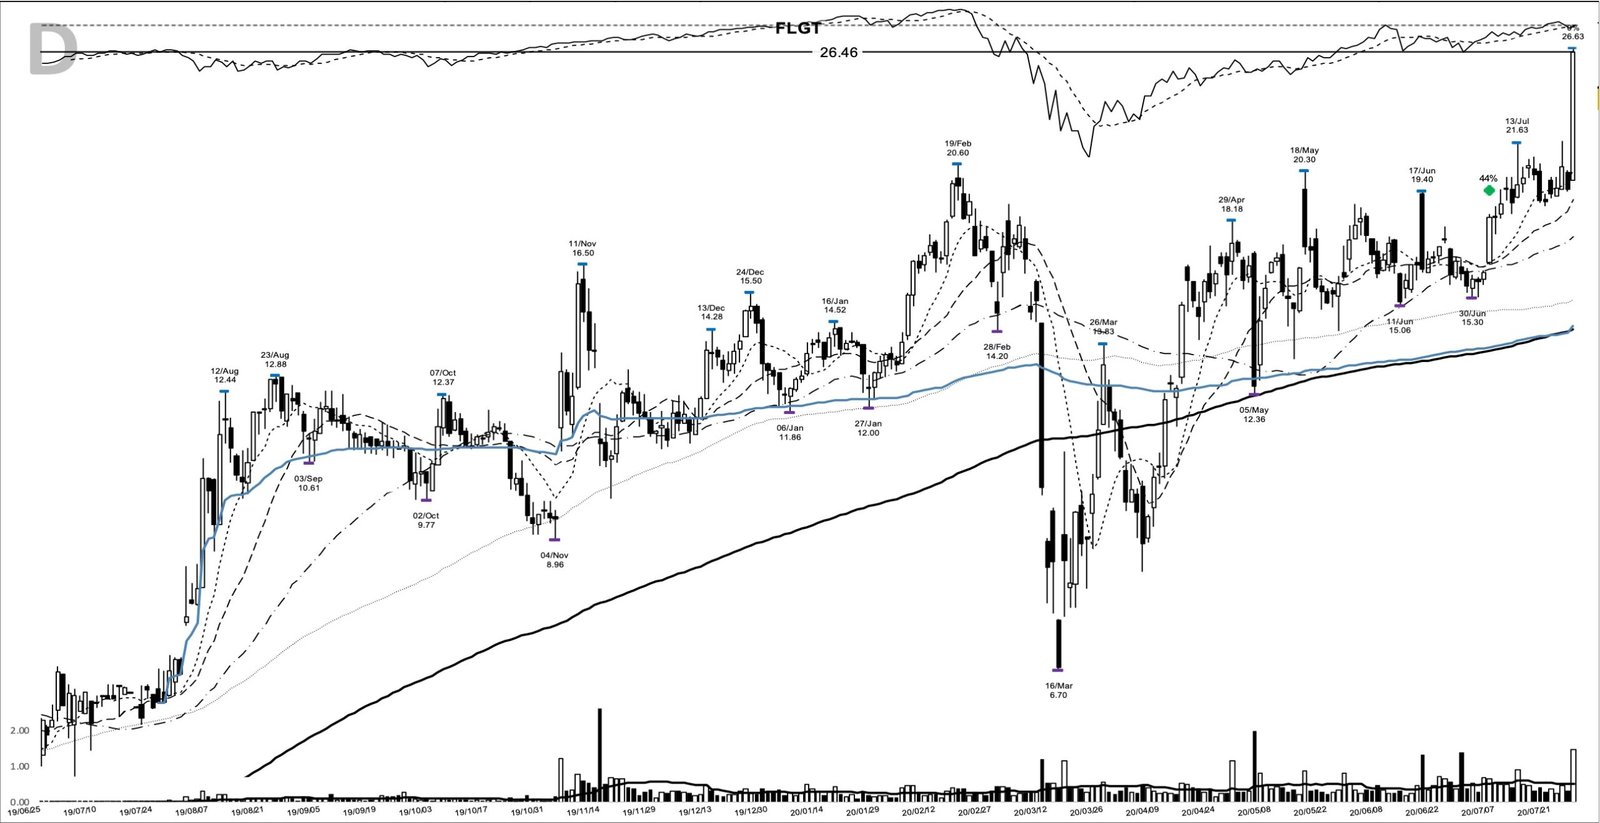
The recovery was just as fast. By 18 May the stock printed $20.30 intraday, then closed at $17.17. On 17 June it opened at $19.30, reached $19.40, and closed at $16.33 on 1,307,572 shares. That one bar set the 20-day high. Below it, the lows held at $15.06 on 11 June and $15.30 on 30 June, so the last weeks of the base sat in a band roughly four dollars wide.
On 6 July the stock left that band. It closed at $18.33 on 636,374 shares, against a 20-day average of 504,133. Volume ran 1.3 times the average, which is above normal and well short of the surge a textbook breakout asks for. The close was also 5.5% under the $19.40 pivot. That makes the marked entry anticipatory: a buy inside the base, before the level that defined it had been taken out. The 8 July high of $19.49 traded through the pivot and closed back at $18.87. The first close above it came on 9 July, at $19.57.
The entry day was also the first close above the 10-day moving average in the run-up, with the 10-day, 20-day and 50-day lines bunched at $16.58, $16.52 and $16.33. The close sat 10.6% above the 10-day line, so the day was already a stretch from the averages.
Fulgent in mid-2020: a genetics lab turned COVID test provider
Fulgent Genetics ran a genetic testing lab in Temple City, California. Before 2020 it was a small business with fast growth. SEC data show revenue of $8,424,000 in the June 2019 quarter, up 56.0% year over year, and $10,347,000 in the September quarter, up 83.9%. Growth then cooled to 47.8% in the December 2019 quarter and 44.4% in March 2020, on revenue of $7,753,000. The per-share series in the record stops at 2018, when the company was still posting small losses, including a loss of 0.11 per share in the December 2018 quarter.
The pandemic changed the business. On 16 June 2020 Fulgent said it had an FDA emergency use authorization for at-home COVID-19 testing, offered through its Picture Genetics unit. The shares rose in after-hours trade on that news, and the 17 June bar shows the gain was gone by the close. The pivot on this chart is the high of a news spike that sellers rejected.
The numbers caught up on 4 August. June-quarter revenue came in at $17,265,000, up 105.0% year over year, and GenomeWeb reported that COVID-19 testing made up about 60% of it. The stock opened at $39.18 the next morning. On 6 July those figures were still a month away. What a trader could see was the authorization and a chart pressing on its highs.
July 2020: an uptrend the Fed was holding up
The market was in a confirmed uptrend that summer. The Nasdaq showed almost no distribution, the S&P 500 carried a few distribution days, and zero rates plus fiscal support kept buyers coming back after every dip. Leadership was clear: online and technology businesses, plus anything tied to living with the virus, while travel and restaurants stayed broken.
By the exit in February 2021 the tone had turned. Growth stocks went through a violent selloff and rebound, many leaders gapped down 5% to 10% in a single session, and the bases that remained were wide and loose.
Preparing for FLGT before 9 July 2020
The watchlist case was there in June. The stock had rebuilt almost the whole crash in three months, and on the entry day it was 11.0% under its 52-week high of $20.60, with the 50-day line at $16.33 sitting under price. The 17 June reversal was the warning: news had already failed once at $19.40.
The plan a trend follower could have written needs only the chart’s own levels. Entry on a close above the $19.40 pivot, which arrived on 9 July. Initial stop below the $15.30 shelf low from 30 June, a 21.1% risk measured from the pivot. The $6.70 March low is where the whole structure fails, far too distant to use. Once in, trail the 10-day line, widening to the 20-day after the stock is well advanced.
Entering at $18.33 changed that math. Bought at $18.33, the same $15.30 stop sat 16.5% away, a smaller risk, paid for by owning the stock before the pivot had been proven. Had 17 June repeated, that buyer would have owned a failed test of the highs.
From $18.33 to $189.89, then $105.42
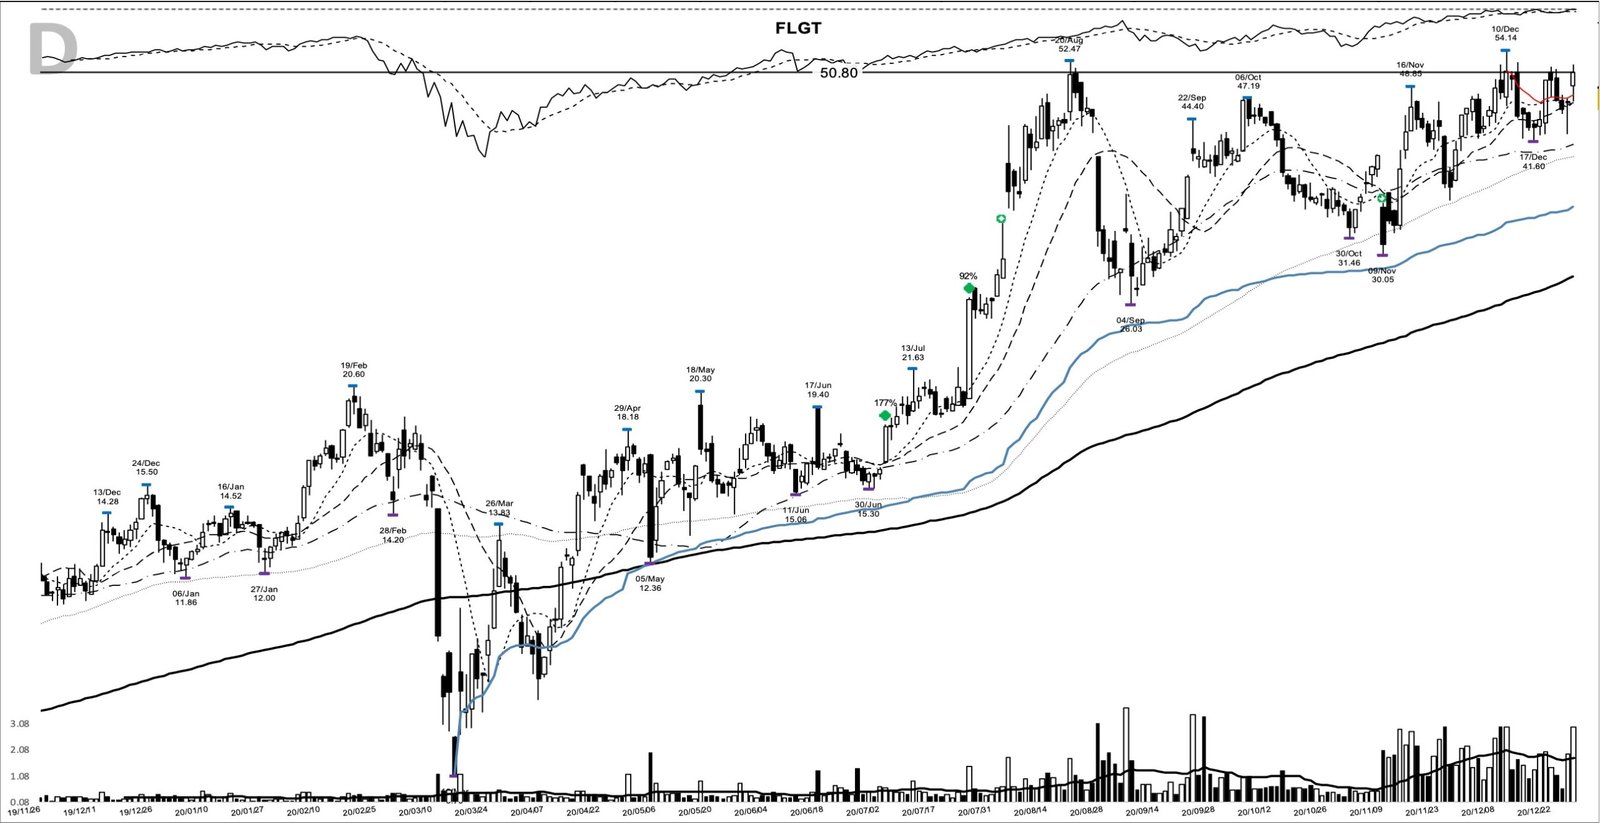
The first weeks were quiet. FLGT closed below its 10-day line on 17 July at $19.03, then closed between $18.99 and $20.56 until 27 July, when it jumped 35.6% to $26.46 on 1,453,042 shares, 2.9 times its 20-day average. There was an opportunity to add there. The June-quarter report pushed it to $36.14 on 5 August, and on 20 August it reached $52.47.
Then the sector broke. Abbott won authorization for a $5 rapid antigen test, and on 27 August FLGT fell 28.1% to $32.22, its first close below the 20-day line since the entry. A low of $26.03 came on 4 September, the same day the stock first closed under its 50-day line. The October drift spent weeks below the 50-day as well, and on 9 November, the day Pfizer reported its vaccine data and Fulgent reported third-quarter results, it opened at $34.50 and closed at $31.01. Every short average failed at some point that autumn. The 200-day line never did.
November brought two raises to revenue guidance, and the trend rebuilt. After a 17 December low of $41.60, the stock closed at $50.80 on 29 December, back above all three short averages, offering a second add. A third came on 26 January 2021 at $75.61, 312.5% above the entry.
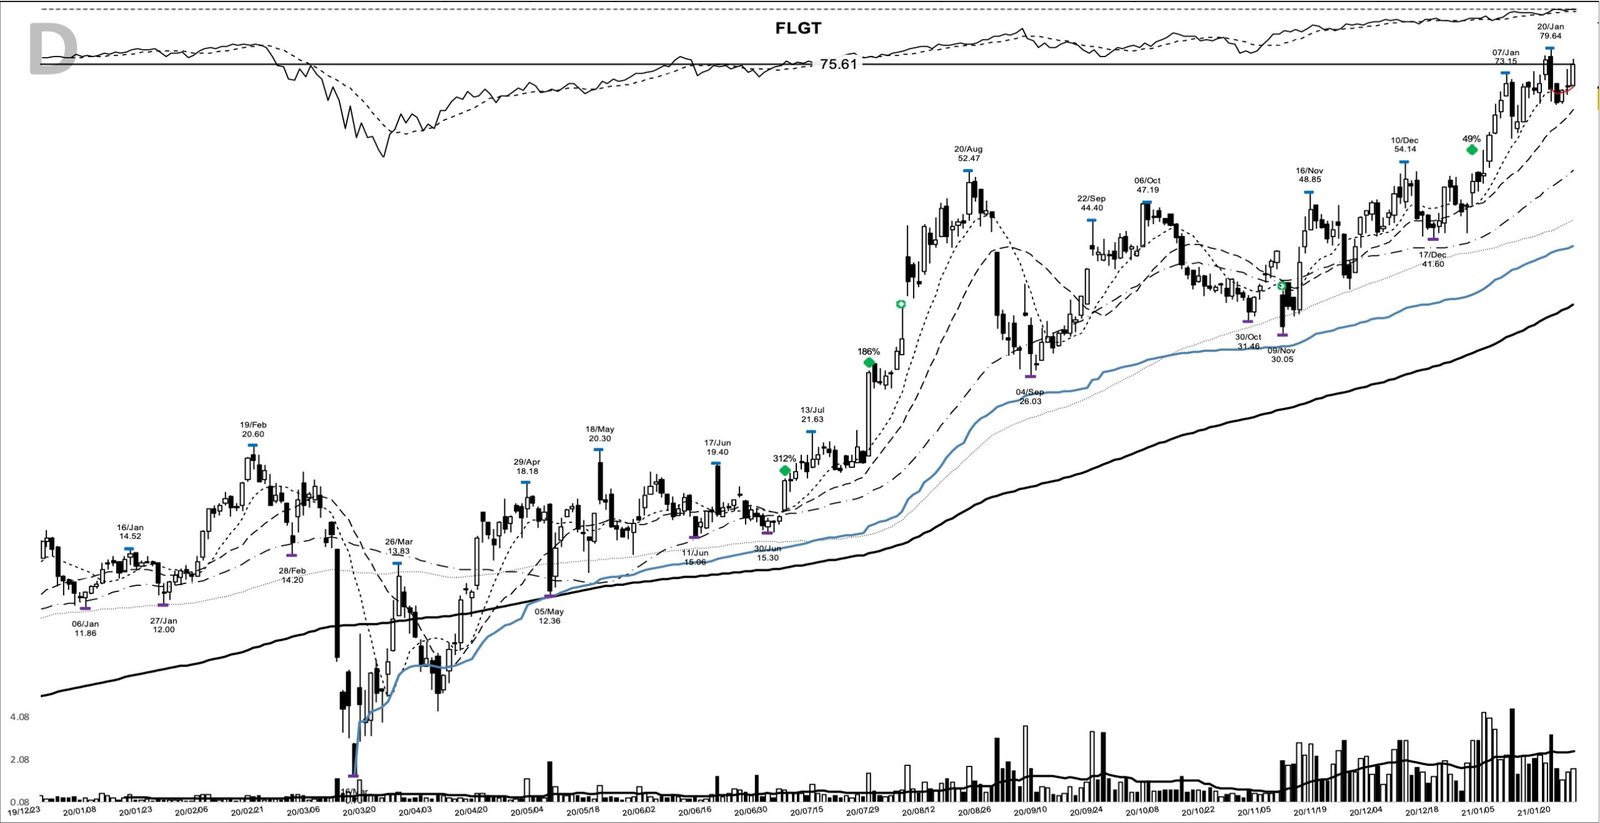
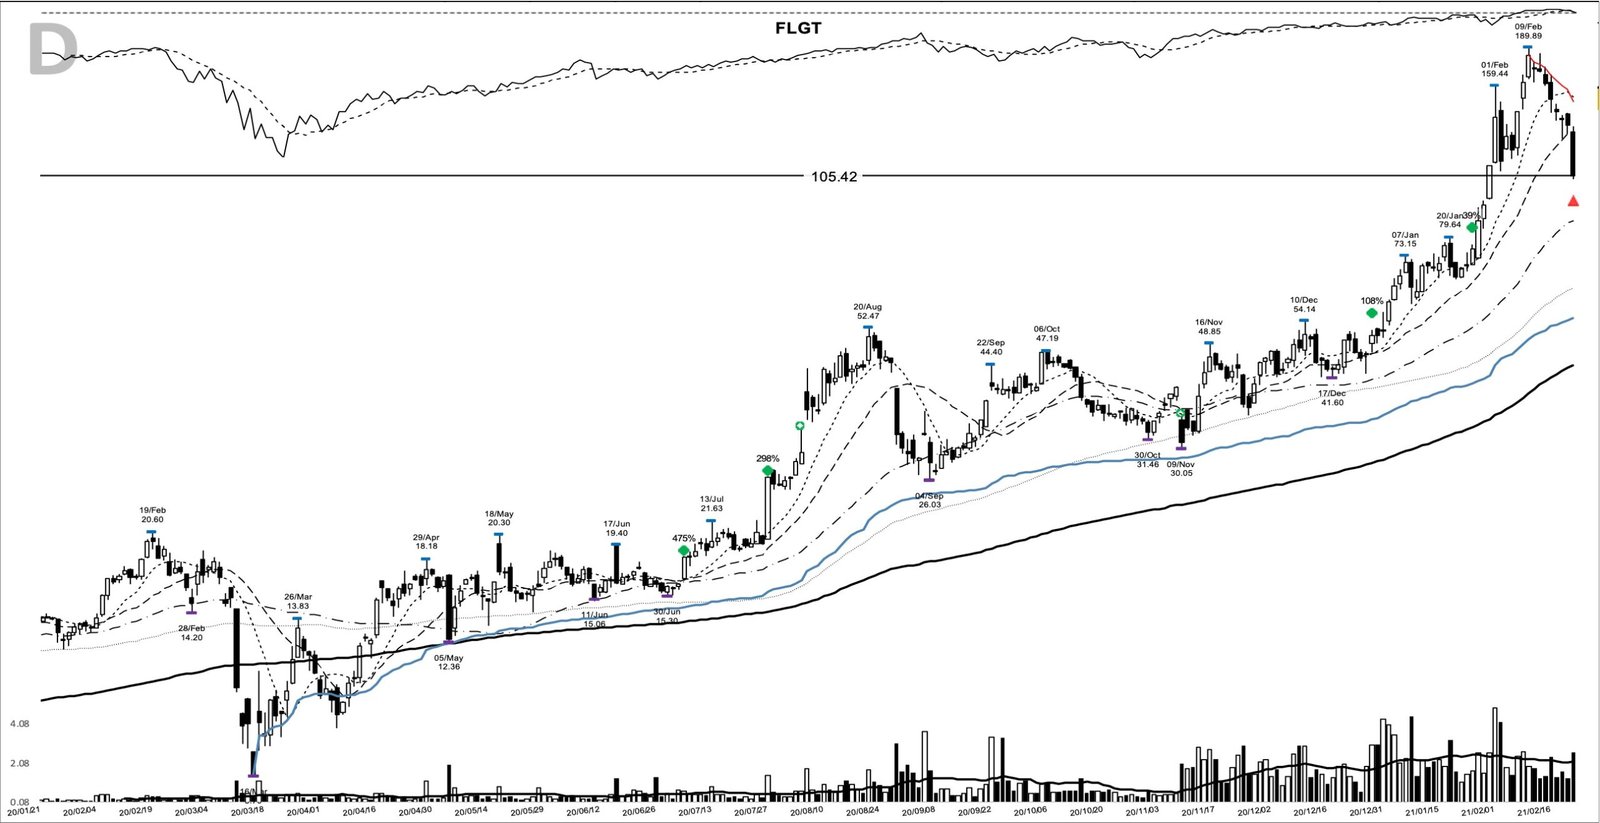
What followed was a climax. FLGT closed at $110.49 on 29 January, traded to $159.44 on 1 February, and peaked at $189.89 on 9 February, 936.0% above the entry close. Two weeks later, on 22 February, it fell 20.7% in a session to $105.42, its first close below the 20-day line since 24 December. That close ended the trend 44.5% below the peak, and 1,000 dollars riding the full move would have become 5,751 dollars.
Three ways the FLGT chart misleads
The entry day looks stronger than it was. A 13.1% gain reads like a breakout, but the close never reached $19.40, and volume at 1.3 times average shows no unusual demand. It took three more sessions to clear the level. Calling 6 July a breakout would teach the wrong trigger.
No single trailing rule captured this trend. A 10-day trail exits on 17 July at $19.03, up 3.8%. A 20-day trail exits on 27 August at $32.22, up 75.8%. A 50-day trail exits on 4 September at $28.29, up 54.3%. The full move needed a much looser leash than any of them, and the cost of that leash showed up in the 44.5% giveback from the peak. For how adds fit around those shakeouts, see pyramiding into a position.
The business was a single-theme story. Most of the gain came from pandemic testing demand, and the two hardest falls, on 27 August and 9 November, came from news about cheaper tests and a vaccine.
A news-spike pivot, then a trend that outlasted its averages
FLGT shows two things at once. The base and pivot came from a news spike that failed, so the entry worked only because the next attempt held. And the run that followed rewarded patience well past the point where tight trailing rules would have let go. William O’Neil asked for earnings power before the price move; here the sales came first and the chart got there before the reports did. Learn the pattern. Ride the trend. Keep the gains.
Related studies: PACB base breakout, August 2020, a genomics name from the same summer, and BNGO base breakout, December 2020, which ran into the same February 2021 top. A new winner study lands most evenings.
Price and volume figures are as-traded daily OHLCV; company figures come from SEC filings where cited.
Educational content only. Not investment advice. Trading involves risk. You are responsible for your decisions.
Get the free Market Wisdom e-book
Join Trends and Breakouts — historical winners, breakout studies, and risk lessons. No spam, unsubscribe anytime.