On 3 December 2020, Foresight Autonomous closed at 1.36 on volume 1.9 times its 20-day average, still below a 1.54 high printed nine days earlier. When FRSX shows up on traders’ screens again, this is the chart worth studying. The FRSX base breakout that followed turned a six-month base into a 535.3% move by the February 2021 exit, in 77 calendar days.
Key takeaways from the FRSX trade, December 2020 to February 2021
- A six-month base under a 1.95 high from 5 June 2020, with a low of 0.81 on 4 September, set up the move.
- The entry came one day before the 1.54 pivot cleared, so it was early by design.
- From the 1.36 entry close to the 8.64 exit close, price rose 535.3% in 77 calendar days.
- There were two chances to add, on 22 December 2020 and 13 January 2021.
- The exit came on the first close below the 20-day moving average since the entry.
| Item | Value |
|---|---|
| Ticker | FRSX |
| Study entry date (anticipatory) | 2020-12-03 |
| Entry close | 1.36 |
| Pivot | 1.54 |
| Pivot cleared | 2020-12-04, close 1.58 |
| Volume vs 20-day average | 1.9x |
| Exit date | 2021-02-18 |
| Exit close | 8.64 |
| Price change, entry close to exit close | 535.3% |
| Calendar days | 77 |
| Peak before exit | 12.14 (2021-02-10) |
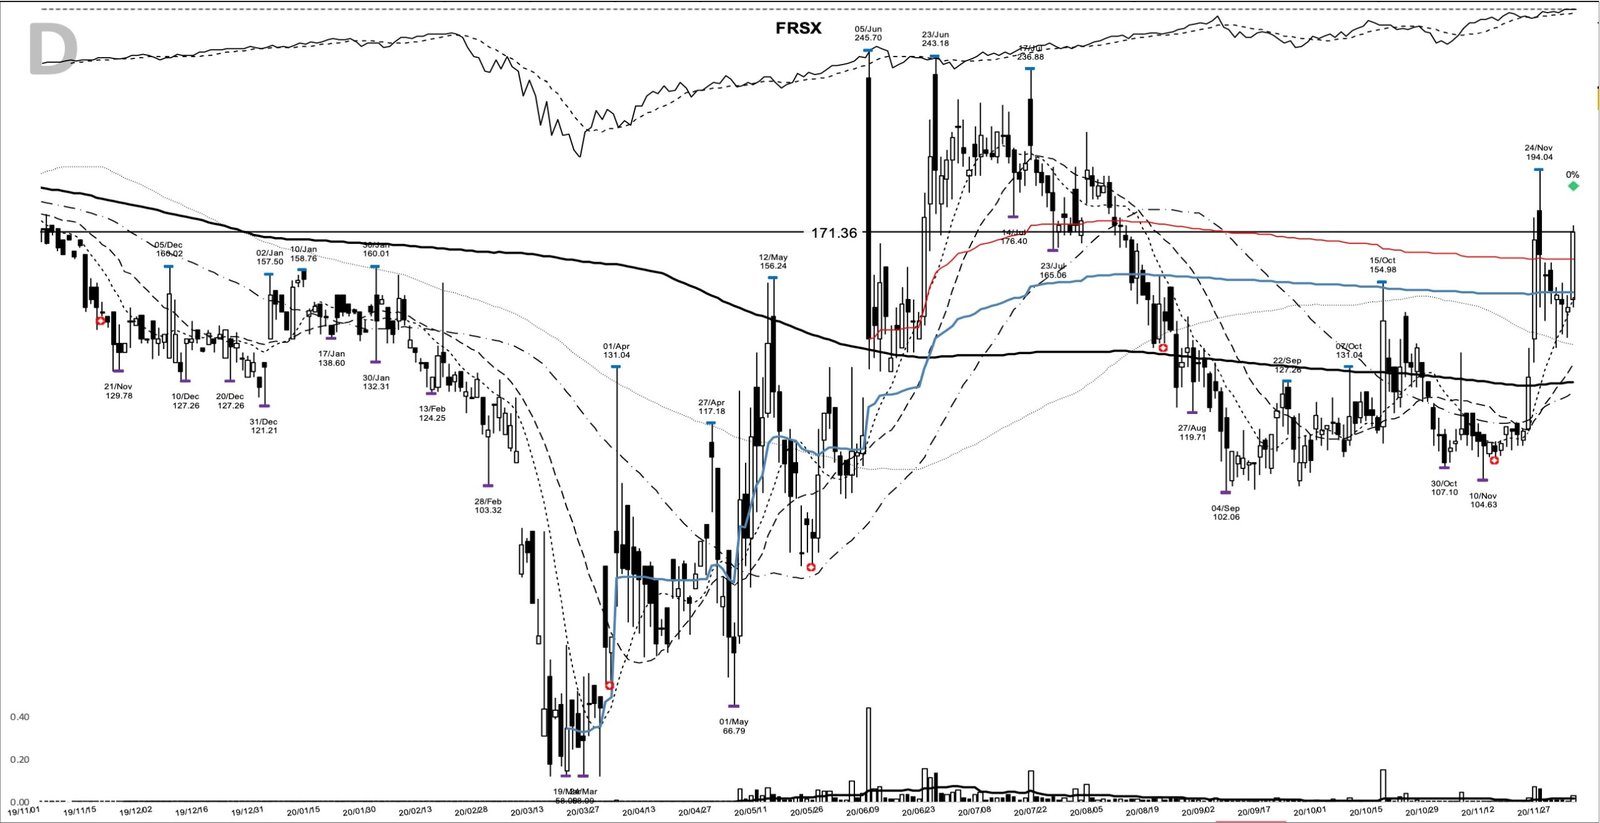
Six months of base under 1.95, then an early entry below 1.54
The charts in this piece come from my study archive. The entry chart shows the whole arc. A collapse into the March 2020 low of 0.461, a violent spike to 1.95 on 5 June, a ragged summer, then a slow bleed to 0.81 on 4 September. That base was 58.5% deep from high to low, which is wide for a textbook base and normal for a sub-two-dollar stock.
Late in the base the candles got small. From 28 October to 19 November every close sat between 0.86 and 0.9249, and on most days volume stayed under 800,000 shares. Then 23 November printed a close of 1.34 on 8,835,120 shares, the heaviest day since 15 October, and 24 November reached a high of 1.54 before closing at 1.30. That 1.54 high became the pivot.
The study entry was anticipatory. On 3 December the stock opened at 1.19, ran to 1.38 and closed at 1.36, near the top of its range but 0.18 below the pivot. The pivot cleared the next session, 4 December, with a close of 1.58 on 19,194,588 shares. That was the actual breakout day, and its volume ran 10.7 times the prior 20-day average, far heavier than the entry day’s 1.9 times.
The trend posture was already in place. Price had closed above its 10-day moving average for 13 straight sessions into the entry, the 10-day (1.19) sat above the 20-day (1.05), and the 20-day sat above the 50-day (0.9901). The entry close was 14.3% above the 10-day line, a little stretched for an early entry.
Foresight Autonomous in late 2020: vision systems and an Apple-car tailwind
Foresight is an Israeli developer of vision systems for vehicles, listed in Tel Aviv and on Nasdaq. Its QuadSight product pairs two visible-light cameras with two thermal cameras for obstacle detection, and a subsidiary, Eye-Net, was building a cellular accident-prevention system that lets vehicles and infrastructure warn each other of collisions.
The SEC filings in the evidence bundle carry no quarterly EPS or revenue series for this period, so this study cites no earnings figures. That gap matters. This was a story stock, priced on what autonomy might become, and a model-book reader should file it under speculative leaders rather than earnings-driven ones.
The story got louder in late December. On 21 December 2020, Reuters reported that Apple was targeting passenger-car production by 2024 with self-driving technology. Israel’s Globes reported on 27 December that Foresight’s shares had risen 314% since the start of December on that theme, while noting the company had no connection to Apple’s vehicle. Foresight used the strength to launch a further share offering in New York.
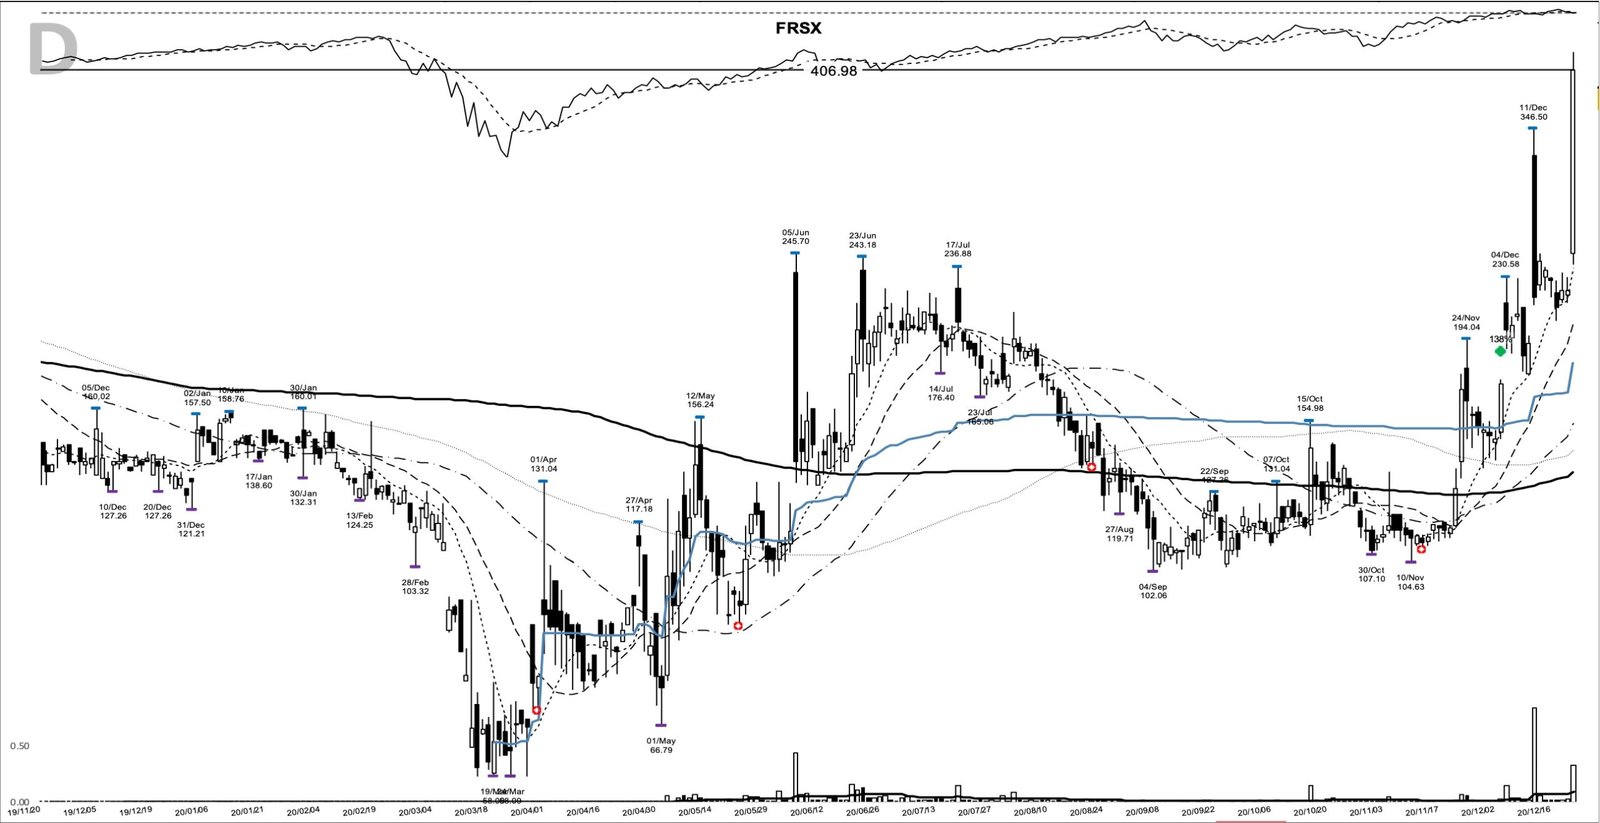
On 22 December, the first full session after the Reuters report, FRSX closed at 3.23 on 41,548,122 shares, its first close above the 1.95 June high and 137.5% above the entry close. That was the first opportunity to add.
The second came on 13 January 2021. Eye-Net announced a pilot with the intelligent-transport division of an unnamed Japanese vehicle maker, as part of a smart-city project. The stock closed at 6.80 on 100,867,536 shares, 6.2 times its 20-day average.
The tape in December 2020 rewarded speculative themes
The general market was in a confirmed uptrend through the entry. Breadth among leading growth names was broad, but many leaders were extended and their breakouts were choppy, so the sensible approach was to start small and build only on profits. By mid-February 2021 the tape had turned euphoric: dips were bought within days, options volume ran at record levels, and short-squeeze, cannabis and electric-vehicle names drew the fast money. FRSX rode that wave, and the same backdrop explains how quickly it gave ground once the wave crested.
How a trader could have had FRSX on a list before 4 December
Three things were visible before the pivot cleared. First, the 23 November volume burst came out of a quiet, tight stretch of the base. Second, the 1.08 low on 30 November held as a five-day shelf, so the pullback after the 1.54 spike stayed shallow. Third, the 10, 20 and 50-day lines had stacked in order under price.
A trend follower writing a plan that weekend might have set it out like this. Entry on a close above the 1.54 pivot. Initial stop below the 1.08 shelf, a distance of 29.9% from the pivot, or below the 0.81 base low where the whole structure fails, 47.4% away. Both distances are wide, a reminder that position size has to shrink when a low-priced stock’s structure is this loose. After that, trail the 10-day moving average, and widen to the 20-day once the move is well advanced.
The anticipatory entry changed that math. Buying the 1.36 close with the same 1.08 shelf stop put the risk at 20.6%, against 29.9% for the plan that waited. The trade-off is clear: the early entry carries a smaller stop, and it takes on the chance that the pivot never clears at all. Readers who want the mechanics of adding on strength can see pyramiding into a position, and how far price can run from a pivot before an entry becomes a chase.
How the FRSX base breakout played out to 12.14
A trader using this pattern might have watched for two things after 4 December: the close holding above 1.54, and the 20-day line rising underneath. Both were tested quickly.
On 9 December the close fell back to 1.47, under the pivot. On 11 December the stock opened at 2.56, traded to 2.75 and closed at 1.73 on 106,476,804 shares, a huge reversal that left a long upper wick. The low through 21 December was 1.40, comfortably above the 1.08 shelf, so the structure held even as the tape tested nerves.
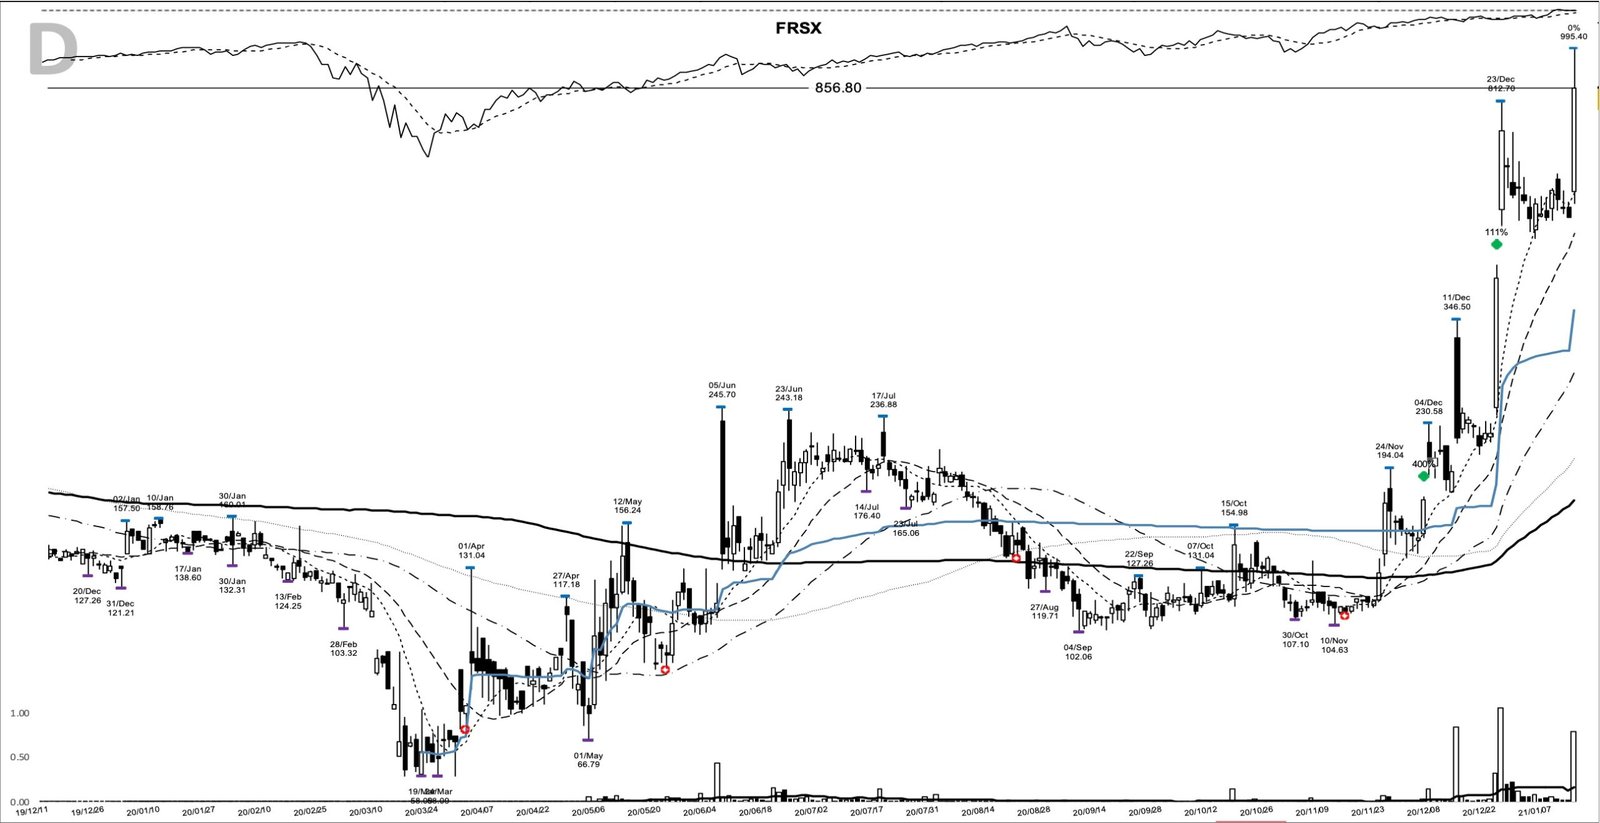
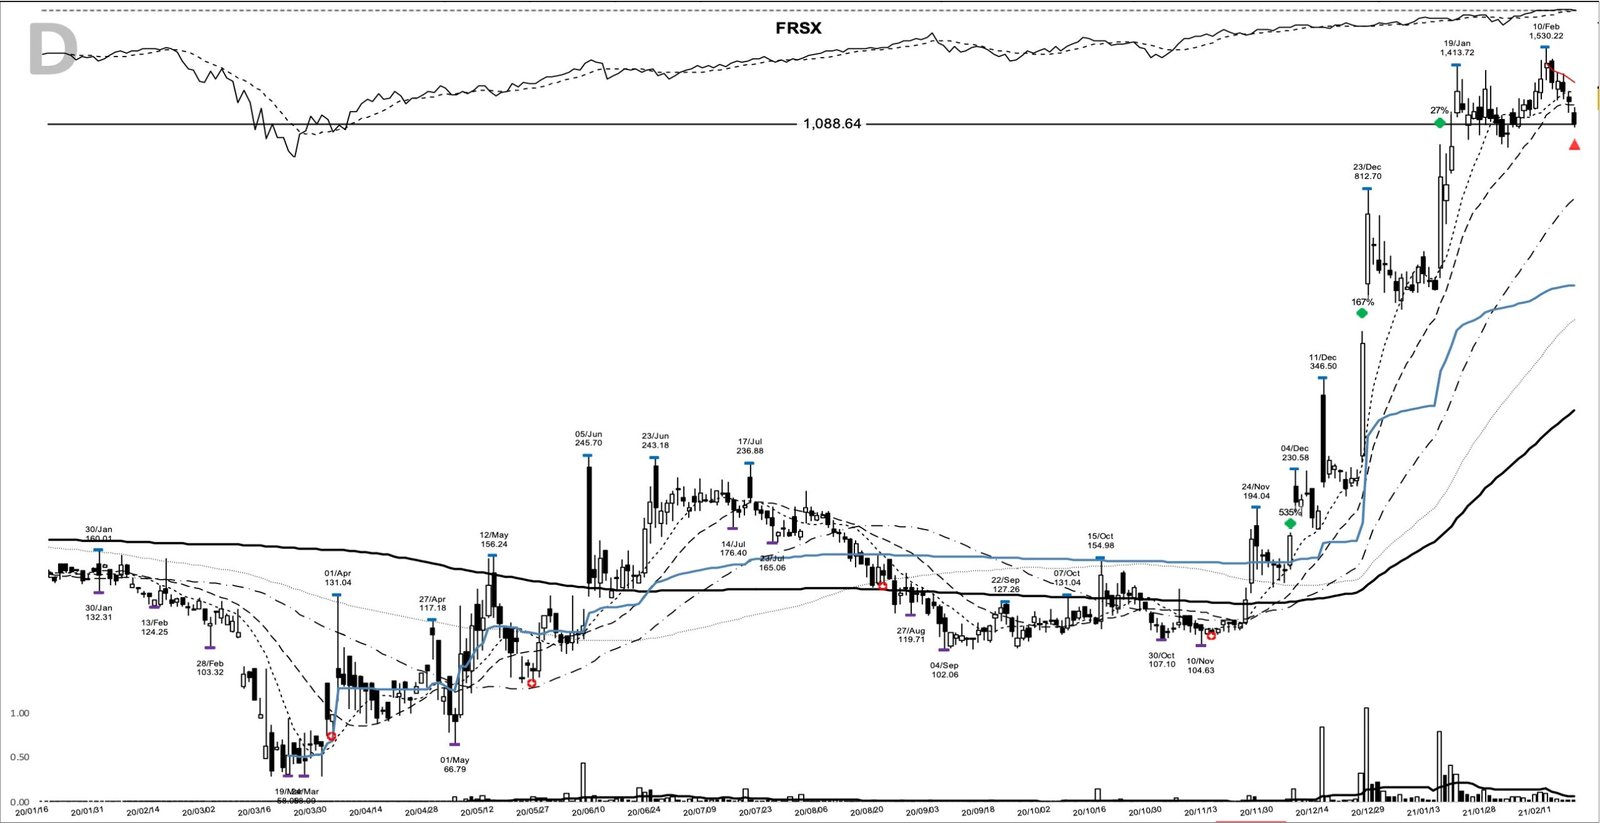
After 22 December, the stock spiked to a 6.45 high the next day on 133,335,971 shares, then slid to a 4.08 close on 31 December. That spike-and-fade is the kind of exhaustion bar described in climax run, and it came early in the move. The stock then spent two weeks with closes between 4.08 and 4.59. The 13 January add came out of that small shelf at 400.0% above the entry close. From there it ran to a 9.99 close on 19 January and to the 12.14 peak on 10 February, 793.0% above the entry close at its highest.
The 10-day line was too tight for a stock this volatile. Closes slipped under it on 17 December and again through early January, each time before higher prices. The 20-day line held every close from the entry until 18 February, when the stock closed at 8.64, below a 20-day average of 9.40. That was the exit: 535.3% above the entry close, 28.8% below the peak, and the 13 January add still showed 27.1% on top.
Where the FRSX chart misleads
The entry-day volume ran 1.9 times its 20-day average. That’s above average and short of the heavy demand the 4 December clearance showed at 10.7 times. Reading 3 December as a confirmed breakout would credit it with a signal it didn’t give.
The 11 December bar is the trap. Anyone buying the 2.56 open after the gap up from a 1.52 close took a 32.4% drop to the close in one session. Gap-and-fade days in low-priced stocks punish chasing, and the stock was already well extended from its pivot that morning.
The base also proved nothing about the business. With no earnings series in the SEC data, the move rested on a theme, and a share offering followed it. Thin fundamentals mean the trend is the only thing holding the trade together, and the 20-day line was the one honest measure of it.
A 1.54 pivot, a 20-day line, and patience in between
The lesson from FRSX is that a loose, low-priced base can still carry a huge trend if the exit rule fits the stock’s volatility. The 10-day line would have shaken a holder out repeatedly. The 20-day line kept the trade alive from 1.36 to 8.64, and 1,000 riding that full move would have become about 6,400. William O’Neil’s pivot-and-volume framework spots the start; the moving average decides how much of the run you keep.
Learn the pattern. Ride the trend. Keep the gains.
Related FRSX-era base breakout studies
A new winner study lands most evenings.
Prices and volumes are as traded at the time; FRSX later did a 1-for-6 reverse split (April 2023), a 1-for-7 reverse split (August 2025) and a 1-for-3 reverse split (February 2026), so today’s charts show different levels. Chart images show split-adjusted prices. Company figures come from SEC filings where cited.
Educational content only. Not investment advice. Trading involves risk. You are responsible for your decisions.
Get the free Market Wisdom e-book
Join Trends and Breakouts — historical winners, breakout studies, and risk lessons. No spam, unsubscribe anytime.